Online advertising has become a crucial and highly profitable marketing strategy lately. It seems like everyone’s jumping on the ‘online’ bandwagon these days.
But with all the competition and information out there, it can get pretty overwhelming.
That’s why we’re here with the latest and most important online advertising stats.
These numbers will help you figure out how well your online ads are doing and show you how they can boost your business’s revenue and sales.


What is Online Advertising?
Simply put, online advertising are those ads you see in your emails or on websites.
This strategy uses the internet to bring people to your website and send the right marketing messages to the right people.
The goal of digital ads is to get specific customers to take action, like buying something.
Unlike old-school ads, online advertising lets you target specific groups, like by gender, age, or where they live.
And the best part?
Online ads are interactive so people can click on them and head straight to your website.
General Online Advertising Statistics
To get started, let’s check out some of the top online advertising stats that can really boost your strategy. No matter what field you’re in, these stats are key to know.
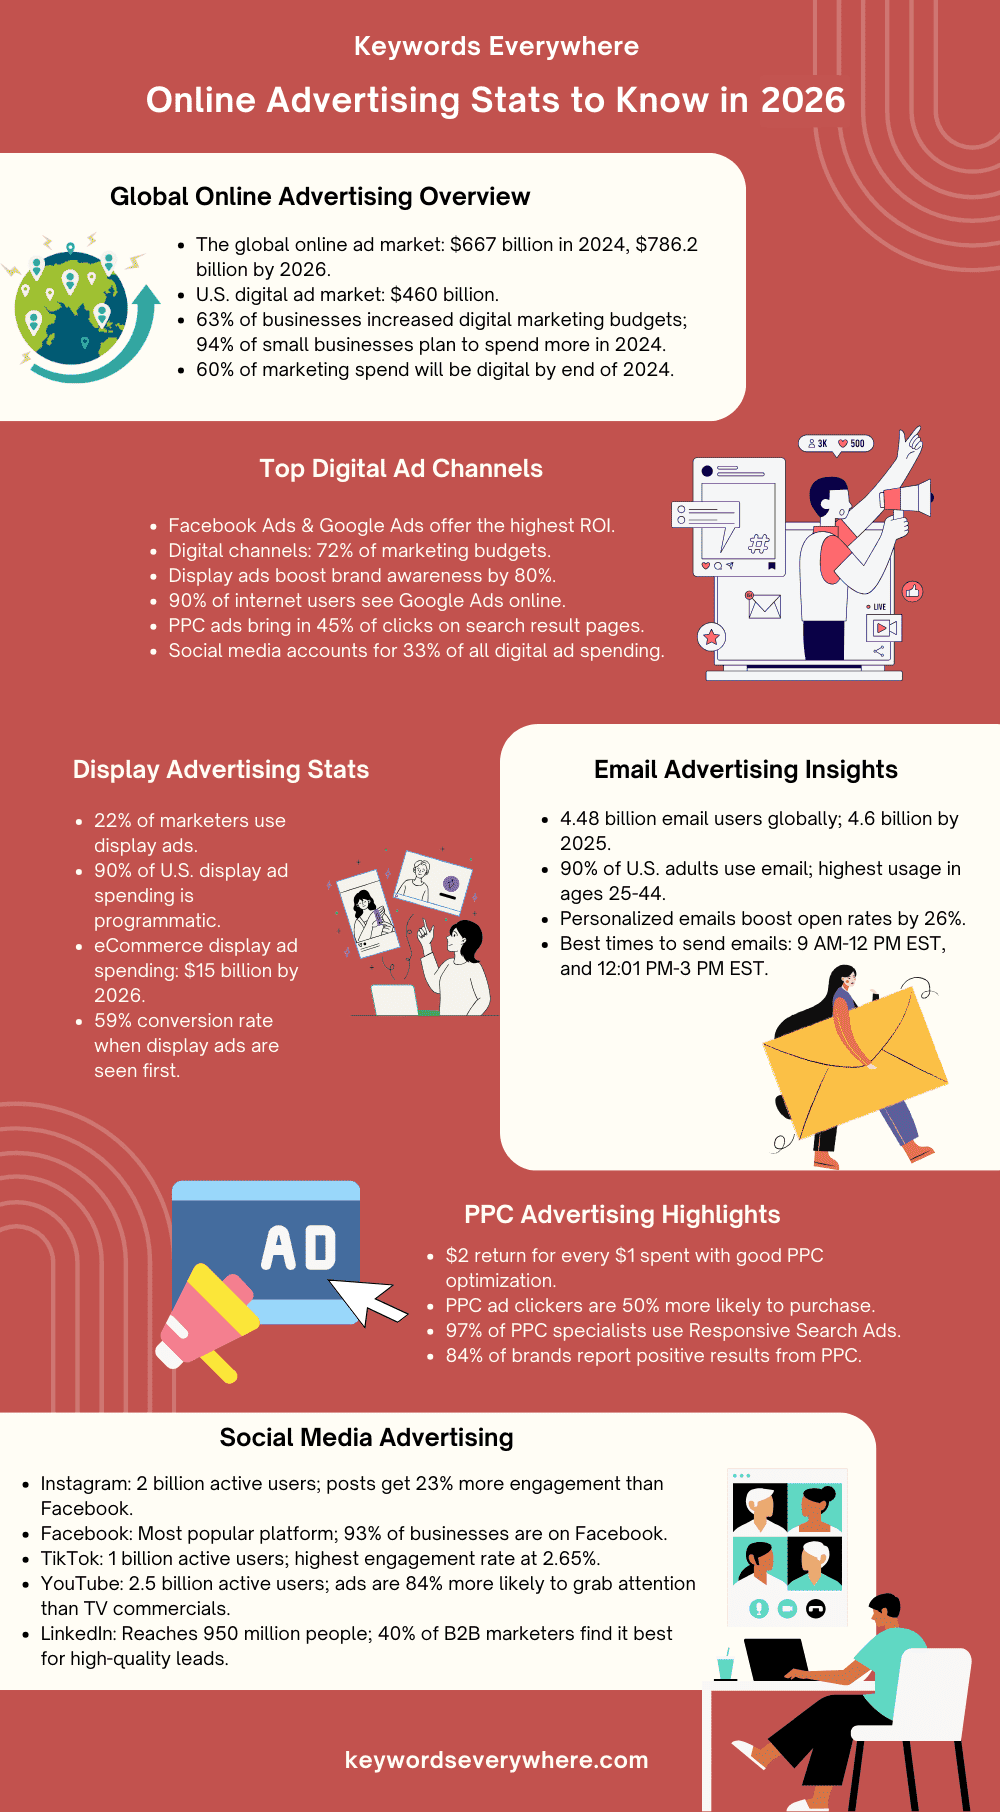
1. The global online ad market is set to hit $843.48 billion in 2025, with digital ad spending reaching over $777 billion. In the U.S., digital advertising is already a massive $460 billion market.
2. About 63% of businesses have recently boosted their digital marketing budgets, and a huge 94% of small businesses are planning to spend more on marketing in 2024.
3. It’s estimated that by the end of 2025, 60% of marketing spend will be digital, with spending on traditional media dropping.
Source
4. Facebook Ads and Google Ads offer the highest return on investment (ROI). But small businesses swear by email marketing for the best ROI.
5. Digital channels are getting a big chunk of marketing budgets—72% to be exact.
6. Digital ads can boost brand awareness by 80%.
7. After seeing display ads, people are 155% more likely to search for specific brand terms.
8. 90% of internet users will come across a Google Ad while browsing online.
9. PPC ads bring in twice as many website visitors as SEO and account for 45% of clicks on search result pages.
Source
10. Social media is a big player, making up 33% of all digital ad spending.
11. By the end of 2024, spending on social media ads was expected to top $220 billion.
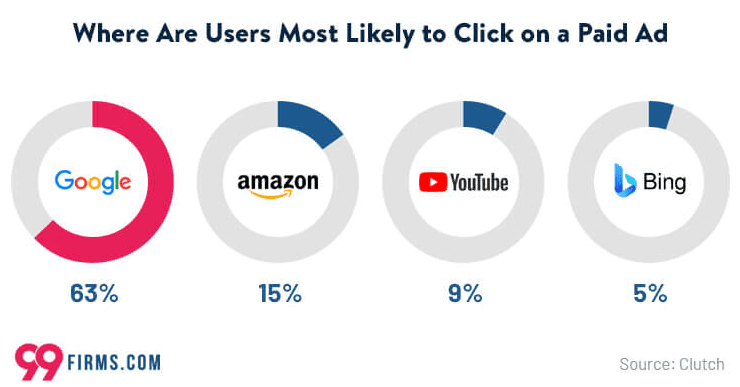
12. Paid search drives 15% of website traffic, while paid social ads bring in just 5%.
13. 45% of small businesses are using paid search, and 55% are investing in display ads.
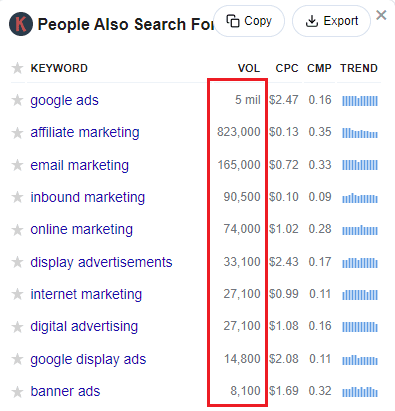
14. Keywords Everywhere reports that “online advertising” search terms have high search volumes, with Google Ads leading with 5 million searches per month.
Email Advertising Statistics
Email advertising is all about placing ads in emails or using emails to deliver your ads.
With around 4.6 billion people expected to use email by 2025, it’s a direct way to show your product, service, or offer.
You can use different types of email ads, like banner ads in newsletters, sponsored content, footer ads, or even sharing deals from other businesses.
Here are some key online advertising stats you need to know to fine-tune your email strategy:
15. Email is still a major player for businesses around the globe, with 4.48 billion users and counting. Experts expect this number to grow to 4.6 billion by 2025 and 4.73 billion by 2026.
16. In the U.S., 90% of people over 15 use email. The age group with the highest usage is 25-44 years old at 93.6%. The usage rate is also 90% or more for those aged 15-24 and 45-64, while it drops to 84.1% for those over 65.
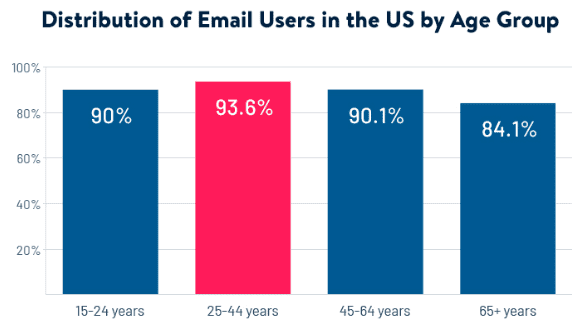
Source
17. Personalized emails get much better results. Tailoring content to each person’s preferences can boost open rates by 26%.
18. Most customers are fine with sharing their data for a more personalized experience, with 83% willing to do so.
19. The best times to send marketing emails are between 9:00 AM and 12:00 PM EST, and then from 12:01 PM to 3:00 PM EST. Avoid sending emails from 1:00 AM to 3:00 AM EST.
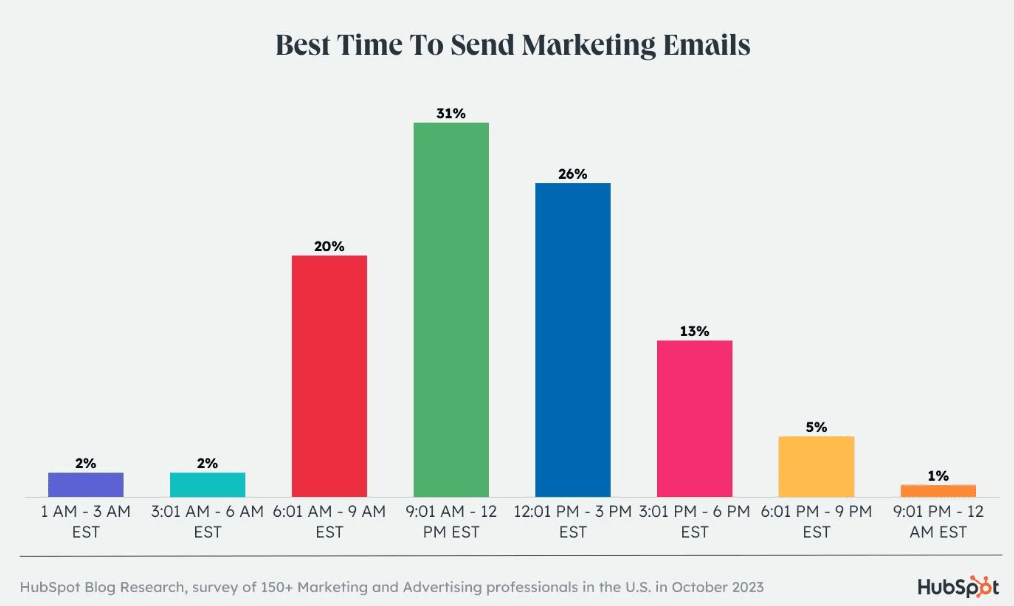
Source
20. 22% of marketers send 2-3 marketing emails per day, 21% send them daily, and 12% send them weekly.
21. On average, email marketing campaigns have a 36.5% open rate. Open rates are pretty steady throughout the week, with Saturday slightly leading at 37.6%.
22. Almost everyone checks their email daily, with some people checking as many as 20 times a day. It’s often the first thing people do online, with 58% checking email before social media or news.
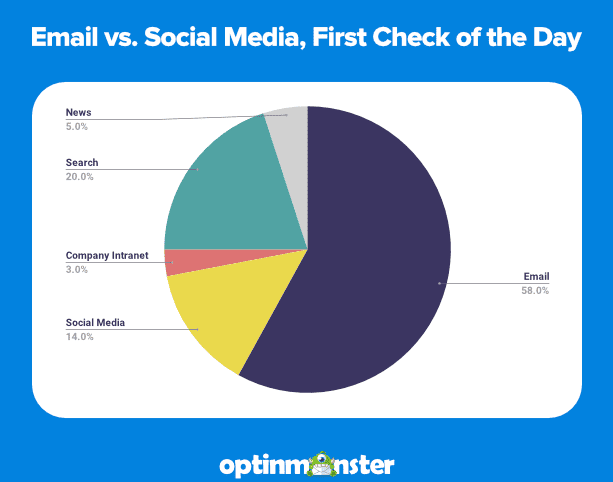
Source
23. Top email marketing strategies include segmenting subscribers (78%), personalizing messages (72%), and using email automation (71%).
24. 95% of marketers using generative AI for email creation find it effective, and 54% say it’s very effective.
Display Advertising Statistics
Display advertising involves placing visual ads on third-party websites.
These ads usually feature images or videos and appear as display banners, blog banners, or other placements on a site, or online portal.
You can buy advertisement space on popular blogs by contacting the publishers or use a platform like Google Adwords to launch a display ad campaign.
If you have an eCommerce product and can find websites or blogs willing to place your contextual ads, you can get a lot of impressions and even boost conversions.
Here are some key online advertising stats about display ads you should know:
25. 22% of marketers include display ads in their marketing strategy.
26. In the U.S., 90% of the money spent on display ads goes through programmatic buying.
27. U.S. e-commerce businesses are expected to spend over $15 billion on display ads by 2026.
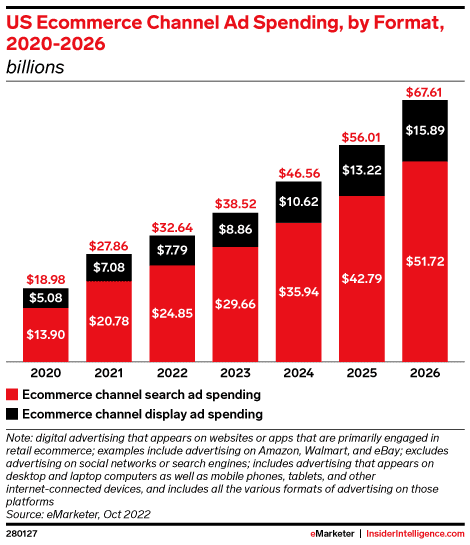
Source
28. If someone sees a display ad first and then searches for it, there’s a 59% chance they’ll convert.
29. A user’s search activity jumps by 155% after they see a display ad.
30. 27% of people search for a business after seeing its display ad.
Pay Per Click Advertising Statistics
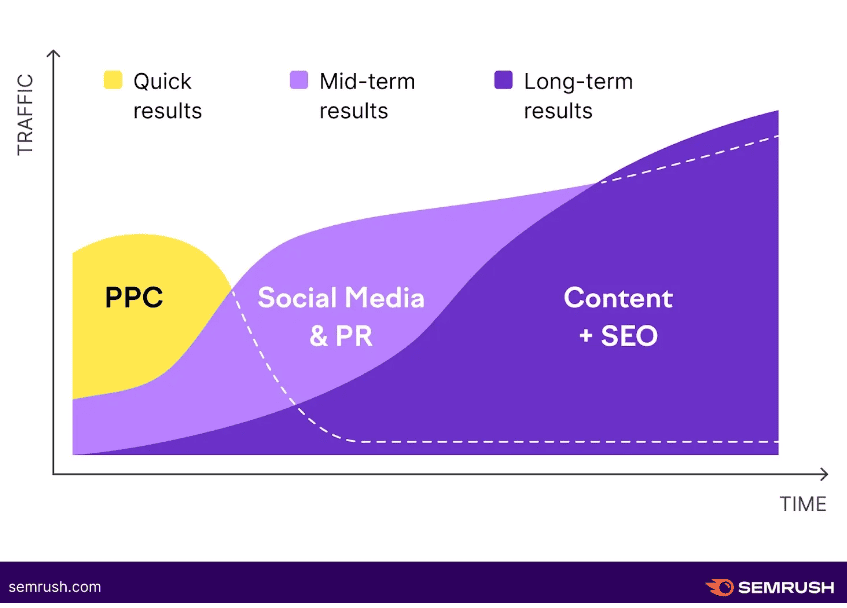
PPC is an amazing way to reach specific audiences and see quick results. It puts your ads in front of people on search engines, social media platforms, and digital marketplaces.
Plus, it’s low risk—you only pay when someone clicks on your ad.
Here are some key online advertising stats about PPC you should know:
31. With good optimization, PPC can give you a return of $2 for every $1 spent—a 200% ROI.
32. Users who click on PPC ads are 50% more likely to make a purchase than those who click on organic search results.
33. People are four times more likely to click on paid search ads on Google than on other search engines. The average cost-per-click (CPC) on Google Ads is $1.16.
Source
34. 42% of marketers spend less than $50K per month on PPC, 39% pay between $50K and $500K, and 18% pay over $500K per month.
35. A solid 97% of PPC freelancers and specialists use Responsive Search Ads on Google and 81% use Responsive Display Ads.
36. About 31% of PPC specialists use AI writing assistants to create ad copy—with Grammarly being the most popular tool (17%).
37. Personalized landing pages can make PPC ad campaigns 5% more effective.
38. 84% of brands and marketers report positive results from their PPC campaigns.
Source
Social Media Advertising Statistics
Social media ads work great for businesses that are active on social networks and have a big following.
Running ad campaigns on channels like Facebook, Twitter, and LinkedIn helps you get more brand exposure, reach a large audience, build a community, and attract new customers.
Since people spend so much time on social media, you can use these networks to target those who’ve already visited your website and pull in fresh leads.
Check out these online advertising stats to see how important social media is for your business:
39. More people find out about new brands, products, and services through social media ads than from word-of-mouth, brand websites, or review sites.
40. For people aged 16-24, social media ads are the top way to discover new brands.
41. On average, social media ads get a click-through rate (CTR) of 1.36%.
Source
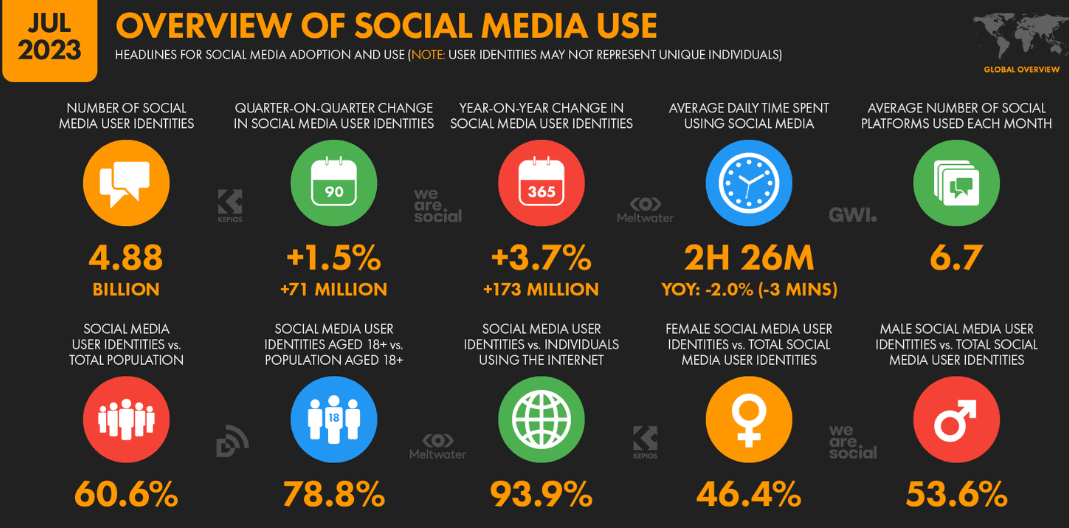
42. There are a whopping 4.88 billion social media accounts out there—about 60.6% of the world’s population.
43. People spend around 2 hours and 24 minutes a day on social media. And they use about 6.7 different social media platforms each month.
Instagram Advertising Statistics
Instagram is a marketer’s dream thanks to its many ad options.
Whether it’s sponsored posts, boosted content, Stories, Reels, or shopping links, you have lots of ways to connect with your target audience.
Here are some important online advertising stats about Instagram you should know:
44. Instagram has over 2 billion active monthly users around the world.
45. Posts on Instagram get 23% more engagement than Facebook posts, even though Facebook has twice as many users.
Source
46. Instagram Live gives the best return on investment (ROI) and is great for gaining followers and shares.
47. On average, people spend about 30.1 minutes a day on Instagram.
48. There are over 200 million business accounts on Instagram, and 90% of Instagrammers follow at least one business.
Facebook Advertising Statistics
Since Facebook is now the most popular social media platform worldwide, it’s a great spot to target nearly any group with your ads and marketing efforts.
Here are some key online advertising stats about Facebook:
49. Facebook continues to stand as the most popular social media platform for marketers—with many saying it gives the best return on investment (ROI) compared to other platforms.
50. 93% of businesses are on Facebook, and 86% are using Facebook ads.
51. With over 3 billion active users each month, Facebook is the most-used social network worldwide.
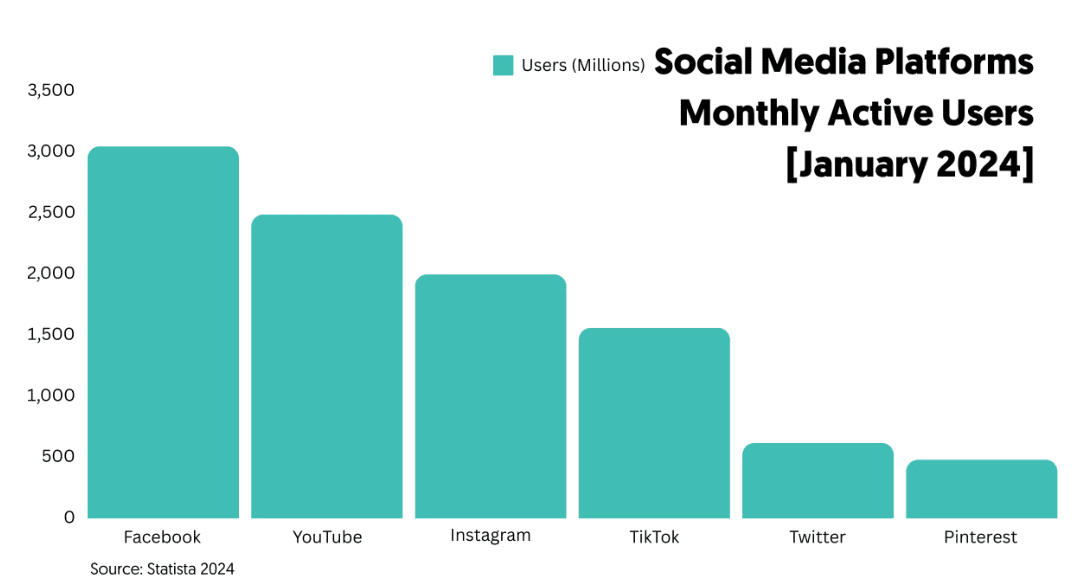
Source
52. About one in four marketers think Facebook is great for building a community.
40% of Facebook advertisers use Click-to-Messaging format, while less than 5% use video ads. This means there’s a big chance to stand out with video!
X/Twitter Advertising Statistics
X has had a fascinating journey since billionaire Elon Musk took it over. So should you still consider advertising on the app formerly known as Twitter?
Here’s what the latest online advertising stats have to say:
54. X had 335.7 million users in 2024, which is a drop of 32.7 million from the last two years. Still, ads on X can reach around 544.5 million people.
55. In 2023, 66% of marketers said they’d stick with X, but 71% spent less time on the platform compared to previous years, and 67% were looking into other options.
56. Over 80% of B2B businesses use X for organic social media marketing and ads.
Source
57. Adding videos to your tweets can boost engagement by up to 33%.
58. Launching new products on X can seriously up your chances of hitting your goals, making you 2.3 times more likely to succeed.
LinkedIn Advertising Statistics
LinkedIn was designed with B2B marketers and advertisers in mind. It’s a top tool for connecting with professionals from various industries.
Here’s a quick rundown of what’s happening with LinkedIn advertising right now:
59. LinkedIn’s ads can potentially reach over 950 million people around the world.
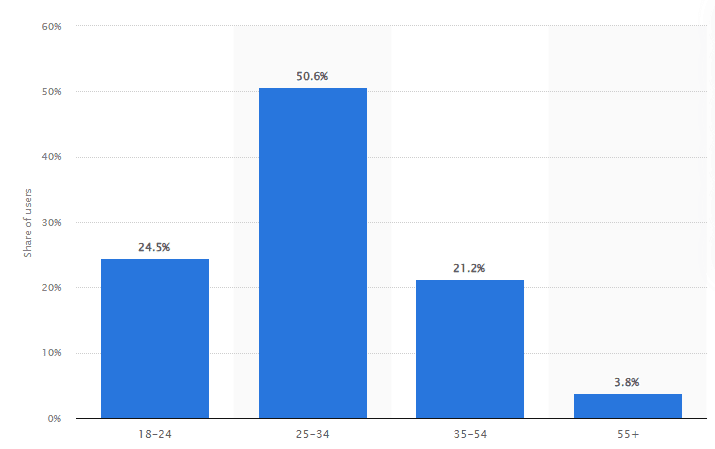
60. About 60% of LinkedIn’s ad audience is between 25 and 34 years old, while only 2.9% are over 55.
Source
61. 40% of B2B marketers say LinkedIn is the best place to get high-quality leads.
62. 89% of B2B marketers use LinkedIn to find leads, and 62% find that it works well for them.
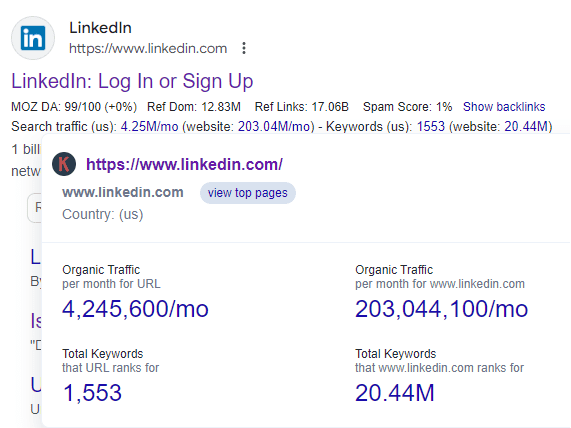
63. According to Keywords Everywhere, LinkedIn’s site gets more than 203 million organic visits each month and ranks for more than 20 million keywords.
YouTube Advertising Statistics
YouTube is more than just a place to watch videos—billions of people go there every day for information and entertainment. With only 100 million users having ad-free Premium accounts (based on the latest count), it’s clear that most people see ads regularly.
Here some important YouTube online advertising stats that you need to know:
64. YouTube has over 2.5 billion active users. The user base is made up of 45.6% women and 54.4% men.
65. On average, people spend about 23.2 hours a month watching videos on YouTube.
66. Over half of U.S. viewers feel YouTube advertisements are more relevant than ads on traditional TV or other streaming apps.
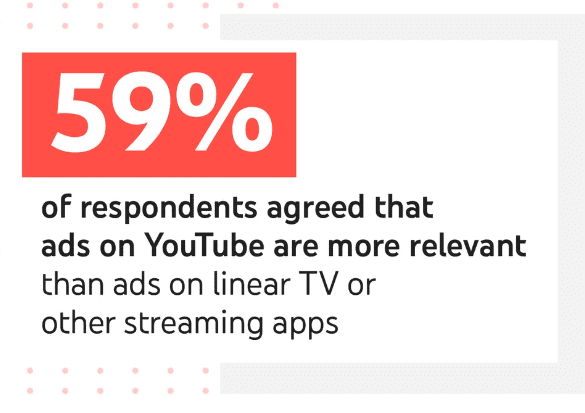
Source
67. 22% of marketers are using YouTube Stories in their video marketing.
68. About 70% of YouTube viewers have purchased from a brand after seeing its content on the platform.
TikTok Advertising Statistics
TikTok’s quick rise in popularity makes it a must-use for online advertisers. With its many ad formats and targeting options, it’s a powerful tool. Check out these TikTok’s online advertising stats that show why it’s so important for businesses:
69. TikTok is growing quickly, and 40% of businesses plan to use it in their 2024 social media strategies.
70. TikTok hit 1 billion active users in just five years—faster than Facebook did. Out of these, 100 million are in the US.
71. TikTok has the highest engagement rate (about 2.65%) among social media platforms.
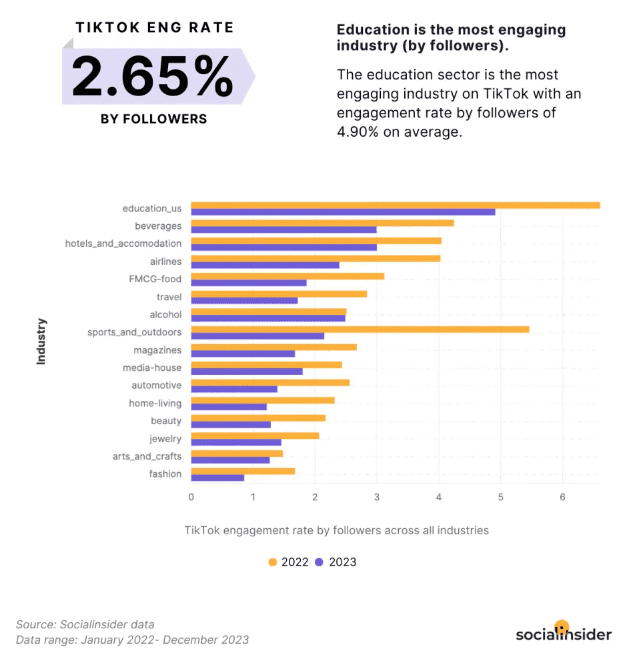
Source
72. 72% of TikTok users find its ads “inspiring,” and 70% say they enjoy them.
73. 25% of TikTok users have looked up or bought a product after seeing a TikTok about it.
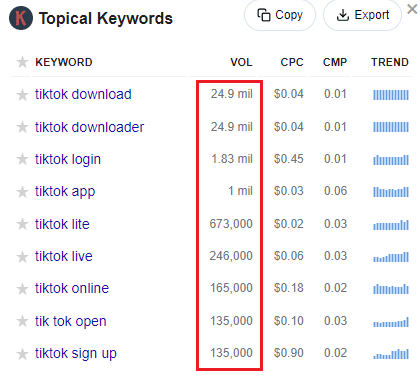
74. According to Keywords Everywhere, TikTok-related keywords have very high search volumes, showing its big potential for advertising due to high traffic
Influencer Advertising Statistics
Influencer advertising is like word-of-mouth marketing, where you get people who are trusted by others to spread the word about your products and services.
As social media grows, influencers are becoming more important because they can easily share their thoughts on brands and products.
Here are some key stats on influencer advertising that can help boost your business success:
75. A solid 92% of people trust recommendations from others more than ads from brands.
76. 81% of marketers believe influencer advertising is effective.
77. About 44% of influencers enjoy working with brands to create content that their followers value.
78. Word-of-mouth advertising keeps customers 37% longer than other types of ads.
79. According to the Collabstr 2023 Influencer Marketing Report, 77% of content creators making money from their work are women, while only 23% are men.
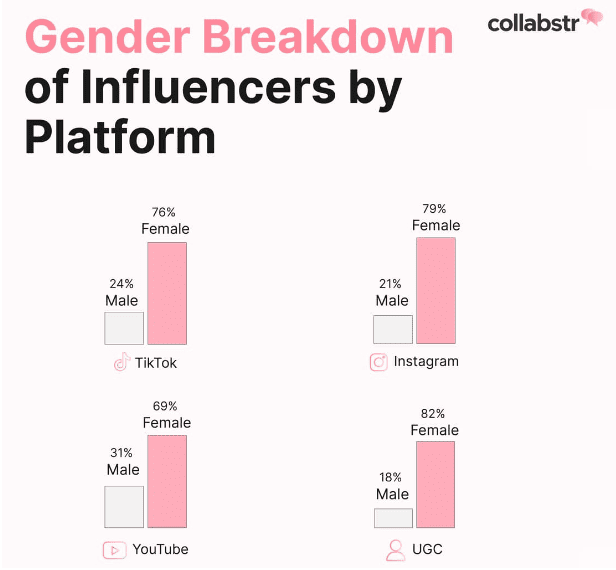
Source
80. Nano-influencers (with 1,000-5,000 followers) have a 2.19% engagement rate—which is higher than even influencers with over one million followers.
81. Businesses earn about $6.50 on average for every $1 spent on influencer marketing, with 3% making $20 or more for every $1 spent.
Video Advertising Statistics
Video ads are a top way to boost your brand because people love watching videos. They get much more attention than traditional banner ads.
Platforms like YouTube and TikTok offer great options for video advertising, and you can even team up with YouTubers to review your products.
Here are some important video advertising statistics that show how it can boost your business’s revenue and sales:
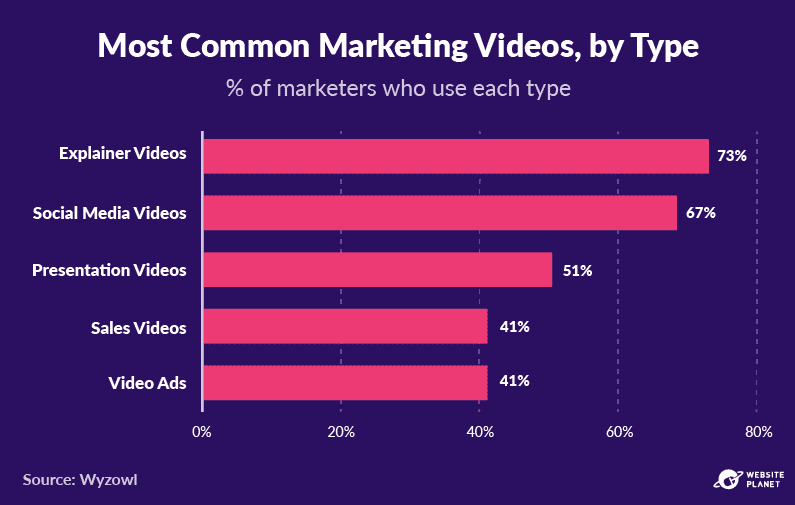
82. Video marketing is the top choice for content marketers.
83. About 49% of businesses say they grow their revenue faster with video content.
84. YouTube is now the leading platform for video marketing.
85. Short videos are the most popular format in marketing strategies.
86. 64% of people who watch branded videos on social media end up making a purchase.
87. 42% of video marketers spend between $0 and $500 on a typical video.
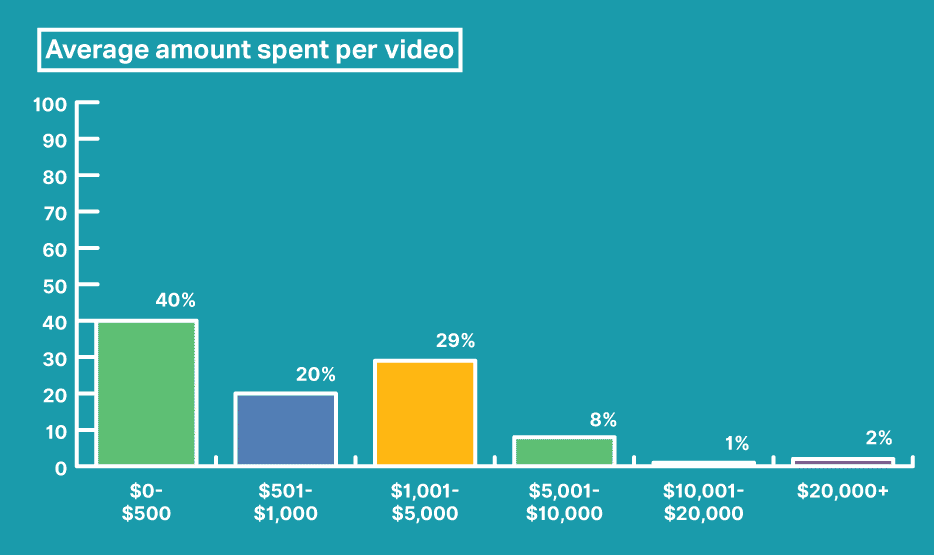
Source
88. 8% of marketing videos get fewer than 10,000 views, 16% get under 1,000 views, and 16% get over 100,000 views.
89. 36% of video marketers think the best length for a video is between one and three minutes, 27% prefer four to six minutes, and 15% go for seven to nine minutes.
90. 60% of video marketers focus on engagement rate, 56% on conversion rate, and 52% on click-through rate.
91. 86% of buyers want to see more video content from their favorite brands.
Source
92. Video marketing is growing—with 92% of businesses seeing it as a key part of their digital marketing strategy.
Mobile Advertising Statistics
Mobile advertising lets you target users directly on their smartphones. As more people use their phones to shop and learn about products, mobile marketing is becoming crucial.
Here are some key online advertising stats that show why mobile marketing is so important for your business:
93. Global spending on mobile advertising is set to top $300 billion by 2024.
94. The U.S. leads in mobile ad spending—with over $150 billion spent each year.
95. As of 2024, around 4.88 billion people have a smartphone. That’s an increase of 635 million new users just in the past year (from 2023 to 2024).
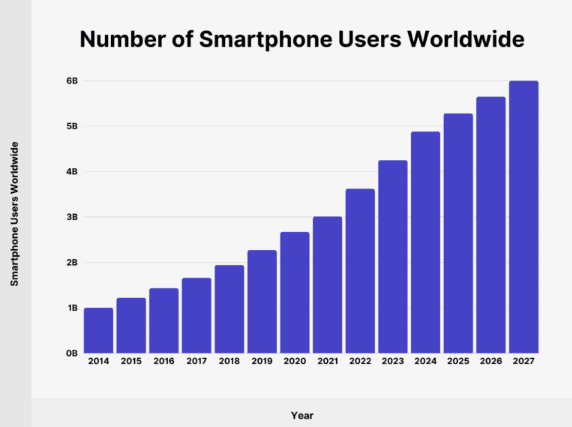
Source
96. 95% of internet users browse the web on their mobile devices at least part of the time.
97. Mobile ads will make up $205.4 billion of total social media ad spending by 2027, up from $170.3 billion in 2023.
98. U.S. marketers are putting 19% of their marketing budgets into mobile advertising.
99. Mobile ads account for $2 of every $3 spent on mobile.
100. Paid ads on mobile YouTube are 84% more likely to grab viewer attention compared to traditional TV commercials.
101. Most marketers say mobile devices drive more than half of their annual traffic.
Google Ads Online Advertising Statistics
Google leads in search, and that means it also leads in search advertising. This makes it a must-use for marketers in every industry. Here are some latest stats on Google Ads:
102. Google has a solid 92% of the global search engine market share.
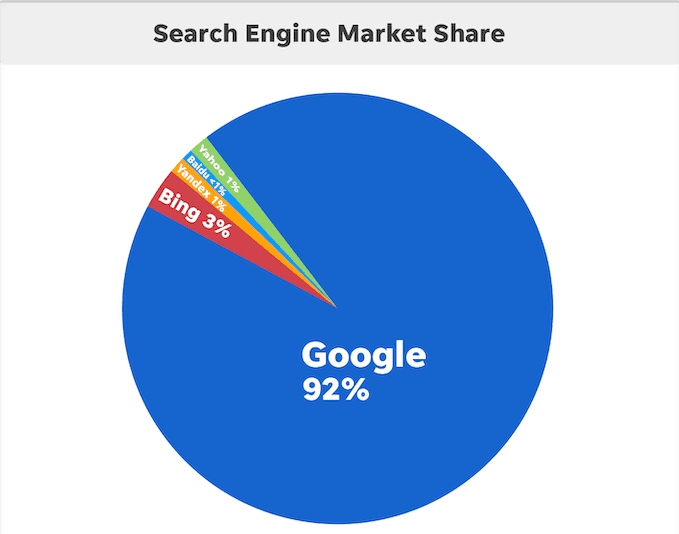
Source
103. 90% of internet users will notice a Google Ad while online.
104. Google Ads generate 96% of Google’s revenue.
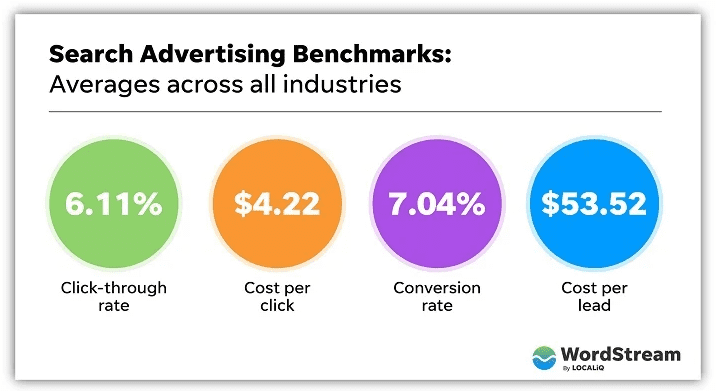
105. The average click-through rate (CTR) for Google Ads is 6.11%. The average cost per click (CPC) is $4.22, and the average cost per acquisition is $53.52.
Source
106. About 46% of total Google searches are for local products or services.
107. Only 25% of people go to the second page of Google search results—75% never look beyond the first page.
108. The top-ranking site on Google gets an average click-through rate of 31%.
Conclusion
By keeping up with these latest online advertising stats, you can easily adjust your strategy to what’s working and what your audience needs. With social media, eCommerce, and mobile gaming booming, advertising revenue is set to keep climbing.
Whether you go for organic or paid ads, online advertising will stay a big player in the digital world. So use our online advertising stats to fine-tune your plan for the year ahead and amp up your brand’s visibility and conversions.