For any business today, a strong digital marketing plan that boosts the mobile experience is a must. Investing in mobile marketing isn’t just important—it’s key to your digital success and will give your online campaigns a serious boost.
Mobile marketing used to be a minor part of the digital landscape, but now it’s the top way to reach customers. In this article, we’ll dive into the latest mobile advertising stats and figures from this fast-moving industry.
These insights will shed light on why mobile marketing is booming and why brands around the globe are using it to engage with their audience.
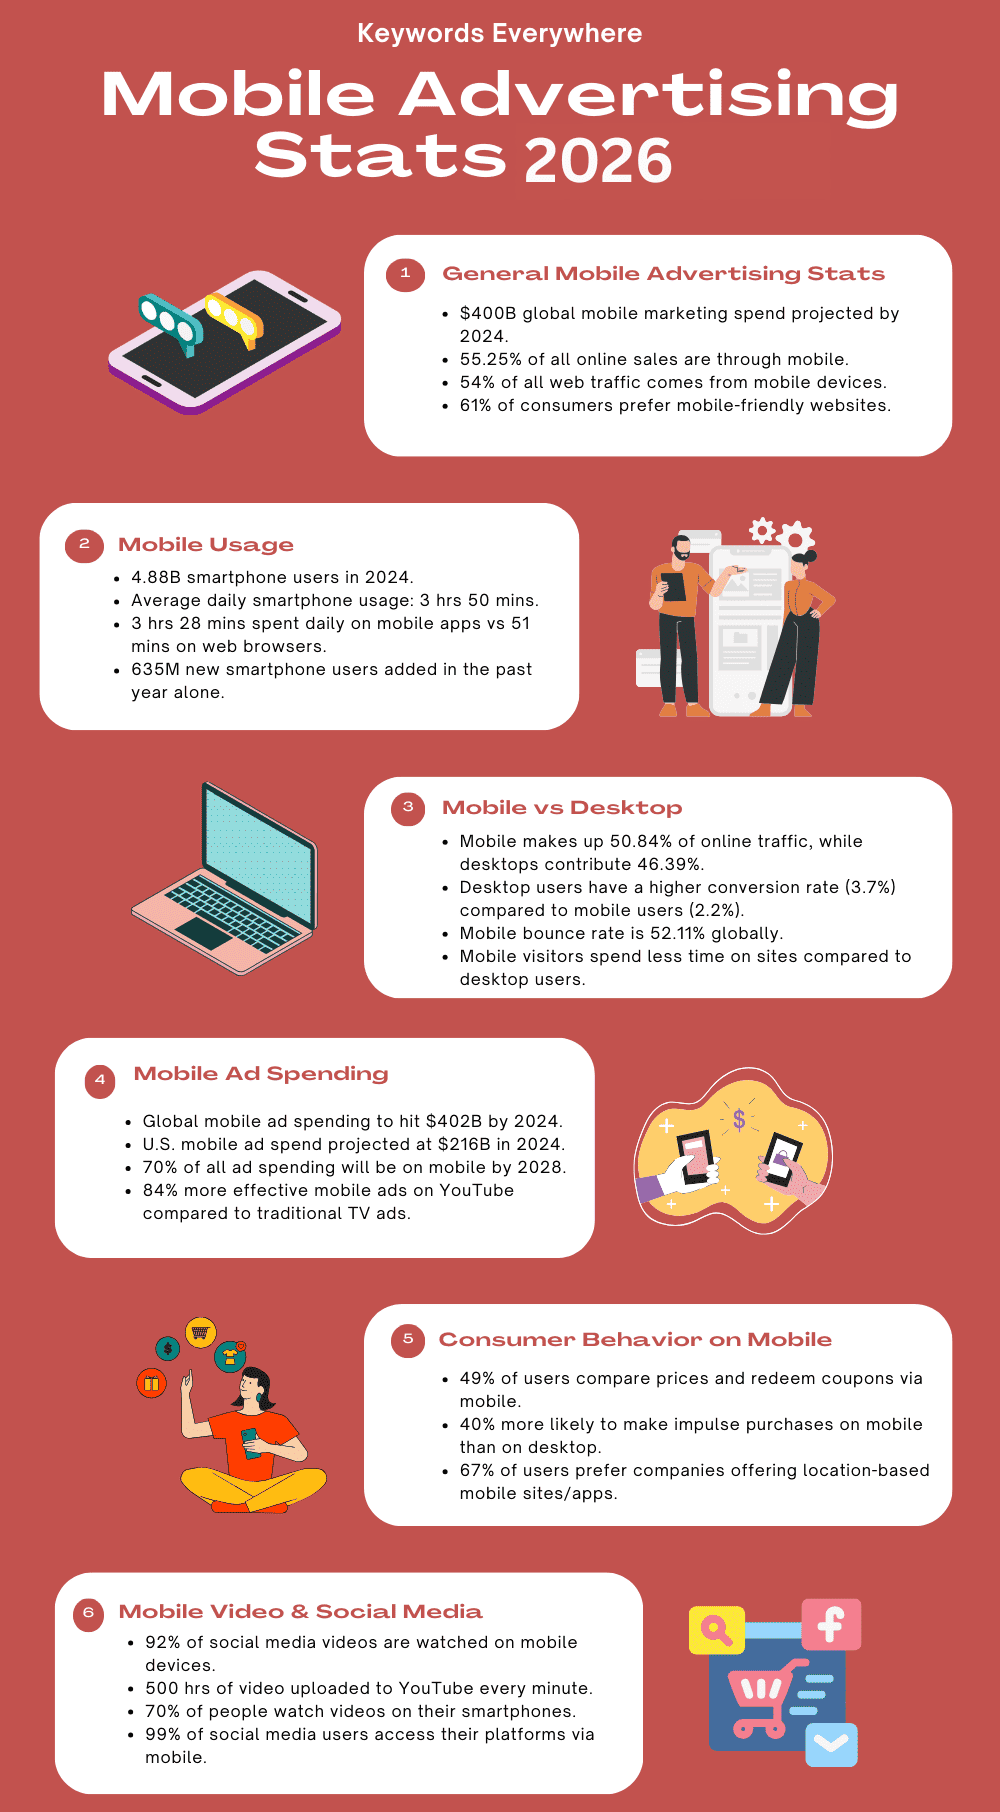


General Mobile Advertising Statistics
Let’s start with some key mobile advertising stats. These figures will provide you with a clear snapshot of the market and industry, giving you a solid understanding of how things are shaping up in mobile advertising.
1. In 2022, people shelled out $327 billion on mobile marketing. That number is expected to hit $400 billion by 2024.
2. Mobile sales account for 55.25% of all online sales, outpacing desktop sales.
3. In 2022, mobile made up 48% of business-to-business marketing in the U.S., and it’s predicted to top 50% by the end of 2024.
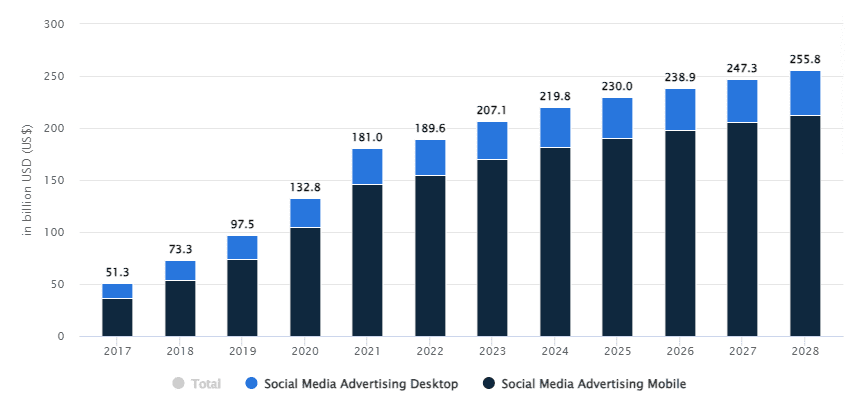
4. By 2028, mobile is expected to drive around $255.8 billion of the total social media advertising market.
Source
5. Mobile phones drive 54% of all website traffic. While you might optimize for desktop users, if your site isn’t mobile-friendly, you could be missing out on a lot of potential leads.
6. U.S. marketers allocate 19% of their budget to mobile advertising.
7. About 61% of consumers are more likely to buy from websites that are mobile-friendly.
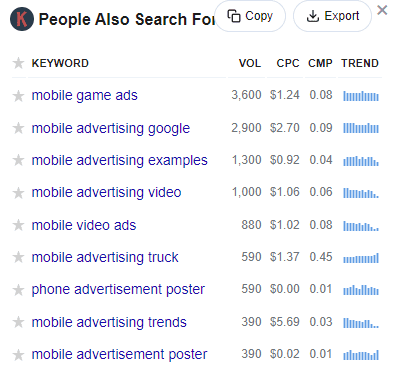
8. According to Keywords Everywhere, search terms related to mobile advertising are very popular, showing that marketers are keen to make it a key part of their strategy.
9. 92% of people who search on their smartphones will go on to make a purchase related to that search.
10. By 2025, SMS marketing in the U.S. is projected to be worth $12.6 billion, growing at a rate of 20.3% annually.
Mobile Usage Statistics
Smartphones have completely changed how we communicate and have made us more productive, letting us stay connected no matter where we are.
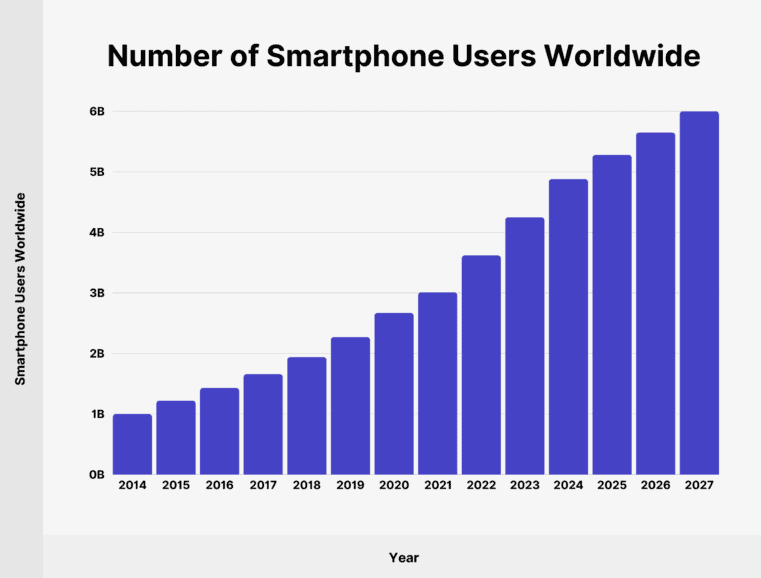
In 2014, there were 1 billion mobile users. Today, that number is close to 5 billion and is expected to reach 6 billion by 2027.
Here are some important mobile advertising stats to give you a clear picture of the market and mobile usage.
11. In Q3 2023, people spend an average of 3 hours and 50 minutes online each day using their smartphones.
12. Daily smartphone usage ranges from 1 hour and 54 minutes to 5 hours and 20 minutes, depending on the market.
13. By 2024, around 4.88 billion people will own a smartphone, which is an increase of 635 million new users just in the past year.
Source
14. Since 2020, the number of smartphone users worldwide has more than doubled, adding 2.61 billion new owners.
15. In 2024, American adults (18+) are expected to spend about 3 hours and 45 minutes each day on their smartphones, up nearly an hour from 2019.
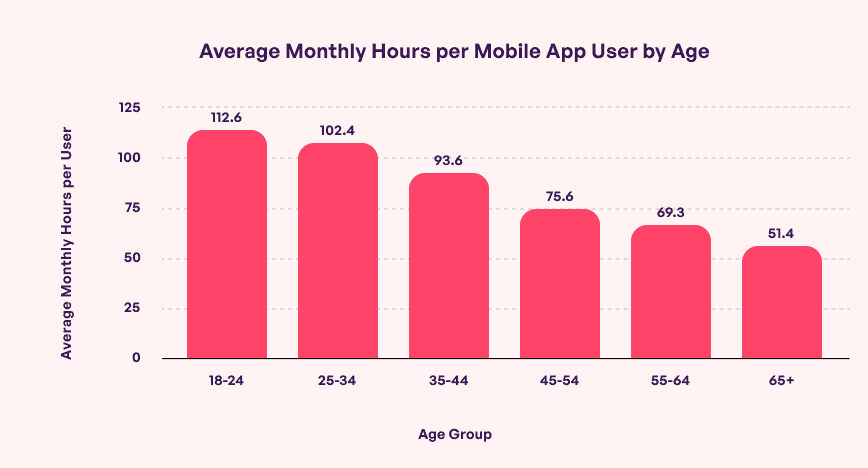
16. People are spending more time on mobile apps compared to web browsers. In 2023, mobile app usage averaged 3 hours and 28 minutes, while web browsing took up only 51 minutes.
Source
Mobile vs. Desktop Statistics
With the rise in sales of smartphones, tablets, and other devices, mobile browsing has become increasingly popular. Now, mobile and desktop internet usage are nearly equal, with mobile actually leading the way.
Below, we’ve gathered some key mobile advertising stats that dive into the comparison between mobile and desktop usage.
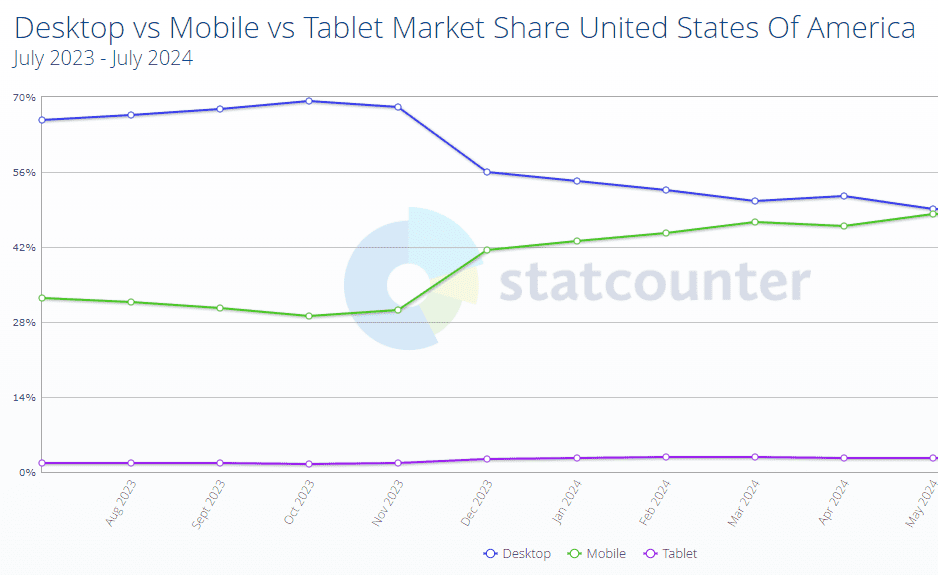
17. Mobile accounts for 50.84% of all online visits worldwide, while desktops make up 46.39% and tablets just 2.76%. It turns out the experts were right about mobile eventually overtaking desktop.
Source
18. In the U.S., web traffic is almost split evenly between mobile (49%) and desktop (48%). Another study shows that 63% of online traffic comes from smartphones or tablets, highlighting mobile’s dominance.
19. According to DataReportal, Americans spend about 4 hours a day on their desktops and 3 hours a day on their phones.
20. There are notable differences in how mobile and desktop users interact with websites. Desktop users visit more pages on average (3.95) compared to mobile (2.67) and tablet users (3.21).
21. When it comes to conversions, desktops still lead with a rate of 3.7%, while mobile lags behind at 2.2%.
22. Desktop users also spend about 40% more time on sites than mobile users.
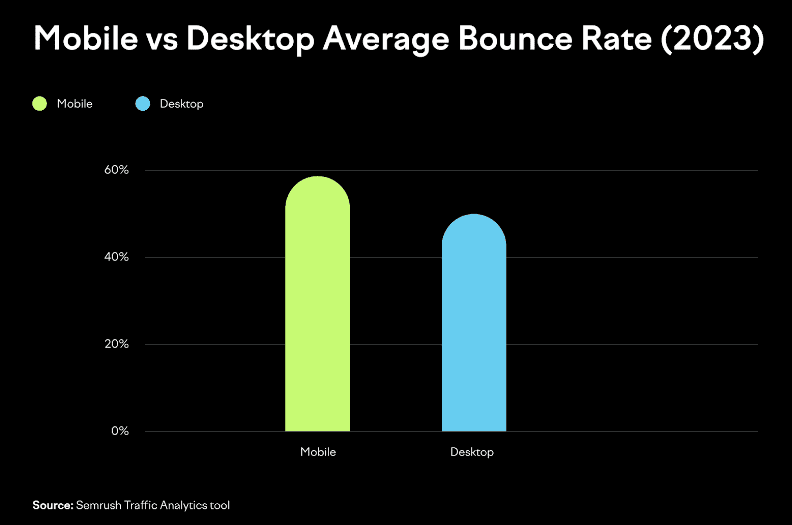
23. Mobile has the highest bounce rate globally at 52.11%, compared to desktop and tablet.
Source
Mobile Advertising Spending Statistics
The mobile ad spending market is set to grow a lot in the coming years, mainly because more people are buying smartphones, tablets, and other mobile devices.
Below, we’ve put together some mobile advertising stats that highlight the trends in mobile ad spending.
24. Worldwide spending on mobile advertising is set to hit $402 billion in 2024, an 11% increase from the previous year. This boost is mainly driven by revenue from short-form videos and video-sharing apps.
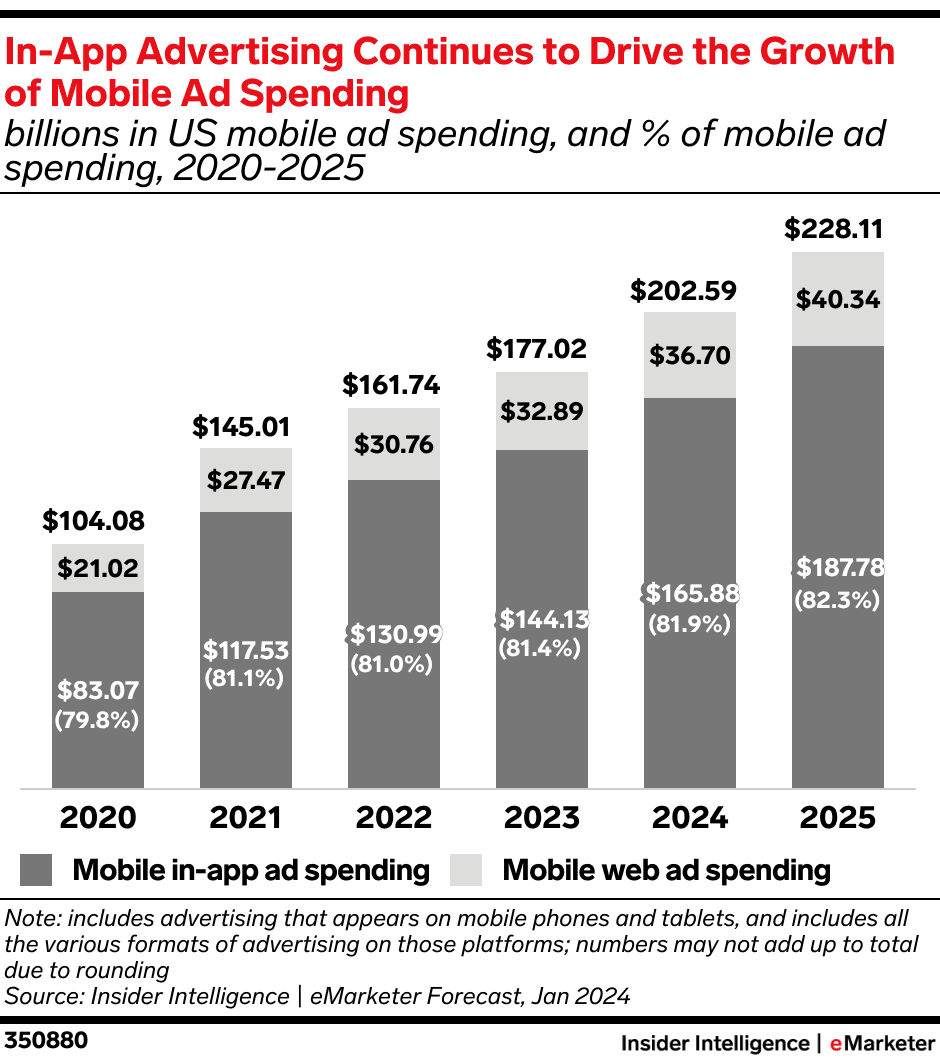
25. In the U.S., mobile ad spending is expected to go over $216 billion in 2024, up from $194.8 billion in 2023. While this is an 11.1% growth, it’s a bit slower compared to the 14.5% growth rate in 2023.
26. The U.S. leads the world in mobile ad spending, with over $200 billion annually. China is the second-largest market, spending nearly $150 billion each year on mobile ads.
Source
27. The rise in mobile ad spending is due to more people using smartphones and engaging more with mobile content.
28. By 2028, it’s estimated that 70% of all ad spending will be on mobile.
29. Paid mobile ads on YouTube are 84% more likely to be effective compared to traditional TV ads.
Consumer Behavior on Mobile Statistics
Smartphones are now an important part of our daily lives and have changed how we behave as consumers.
With more people using smartphones to search, shop, stay entertained, and find local info, new opportunities arise for marketers to connect with these always-connected consumers.
Here are some key mobile advertising stats that shed light on how people behave on mobile.
30. 63% of mobile users are more likely to shop from a company that has a mobile site or app offering helpful product recommendations.
31. Mobile users are 40% more likely to make impulse buys compared to desktop users, thanks to the convenience and personalized experiences on mobile.
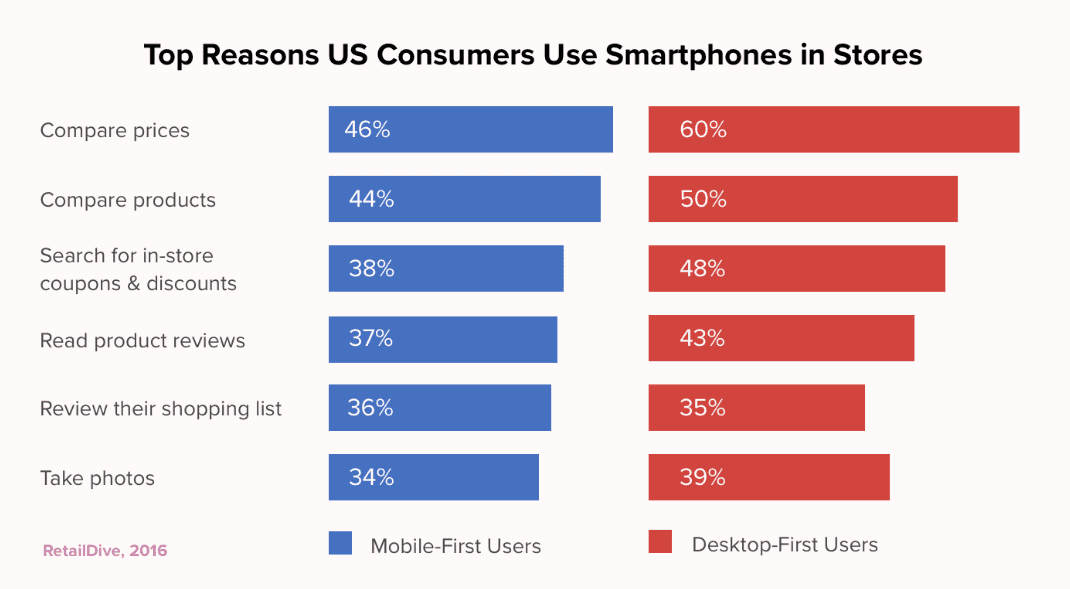
32. Around 49% of mobile users use their devices to compare prices, look for product reviews, or redeem mobile coupons.
33. The top reasons people use their phones for shopping are to browse products and find discounts and deals.
Source
34. If smartphone users can earn rewards or points, 51% are more likely to use a company’s mobile app for shopping.
35. When shopping on a mobile device, 30% of users prefer using a company’s mobile site for a one-time purchase.
36. Over half of consumers (54%) have made a purchase after a brand offered a deal through Mobile Wallet.
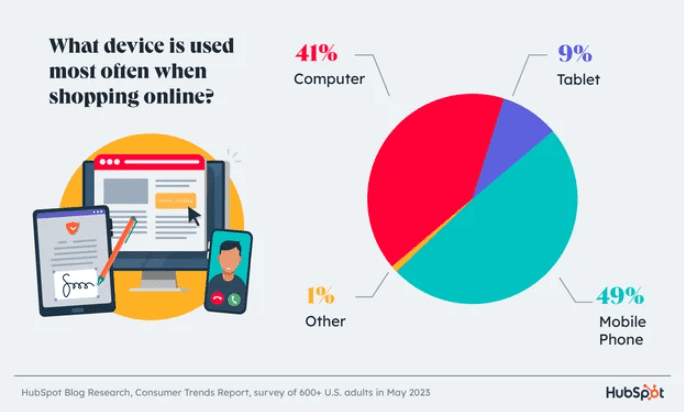
37. Mobile phones are the go-to device for more than 50% of people when searching for answers online and are also the most popular choice for shopping online.
Source
38. About 67% of mobile users are more likely to purchase goods from companies with mobile sites or apps tailored to their location.
39. In the first quarter of 2024, smartphones made up over 75% of retail site visits in the U.S. and generated 66% of online shopping orders.
40. 91% of mobile device owners have bought something after seeing a relevant ad.
Social Media Marketing on Mobile Statistics
It’s no surprise that we’re all hooked on social media—your mobile screen time data probably proves it!
To understand just how much time people are spending on social media through their phones, check out these mobile advertising stats that highlight the growing trend of mobile social media use.
41. Social media ad spending is expected to hit $219.8 billion in 2024, with mobile driving $255.8 billion of this by 2028.
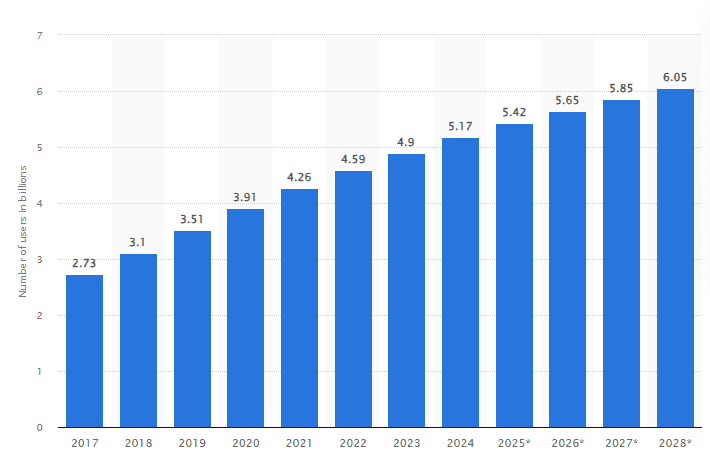
42. As of July 2024, there are 5.17 billion social media users worldwide, and mobile devices are crucial for accessing these platforms. This makes mobile-friendly content essential for marketers.
Source
43. A huge 99% of social media users access these platforms from their mobile phones, highlighting the need for mobile-optimized content in digital marketing.
44. Over 53% of the global population are active social media users.
45. In 2023, social media received the most investment in mobile advertising.
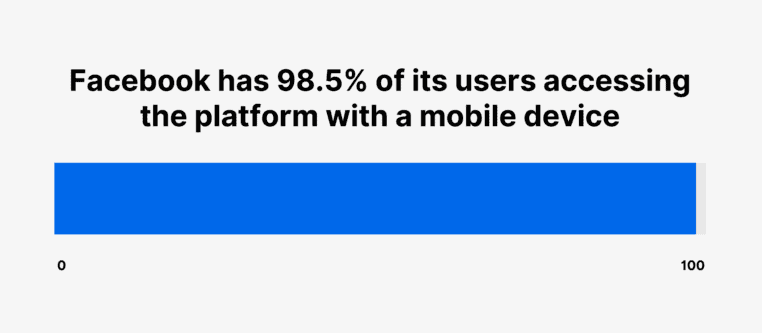
46. A solid 98.5% of Facebook users access their accounts via mobile devices.
Source
47. About 82% of Pinterest users use the mobile app to access their accounts. In December 2023, Pinterest.com saw nearly 1.2 billion visits from both desktop and mobile.
48. Almost 90% of YouTube visits come from mobile devices.
49. The number of social media users is expected to reach 6.05 billion by 2028.
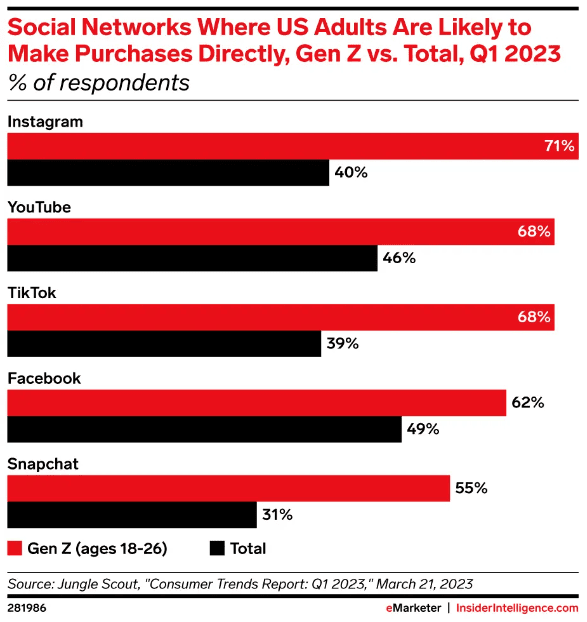
50. 71% of U.S. Gen Z social media users (ages 18-26) are likely to make a purchase directly on Instagram.
Source
Mobile Commerce Statistics
Mobile eCommerce, or mCommerce, lets you shop and make purchases right from your smartphone or tablet anytime and anywhere.
It’s incredibly convenient, so it’s no wonder mobile shopping is becoming increasingly popular.
Check out these top mobile advertising stats to see why it’s crucial to make sure your online store is optimized for mobile devices.
51. By 2024, more than 187 million people in the U.S. are expected to be active mobile shoppers, making up 66% of the American population who will have bought something using their mobile device.
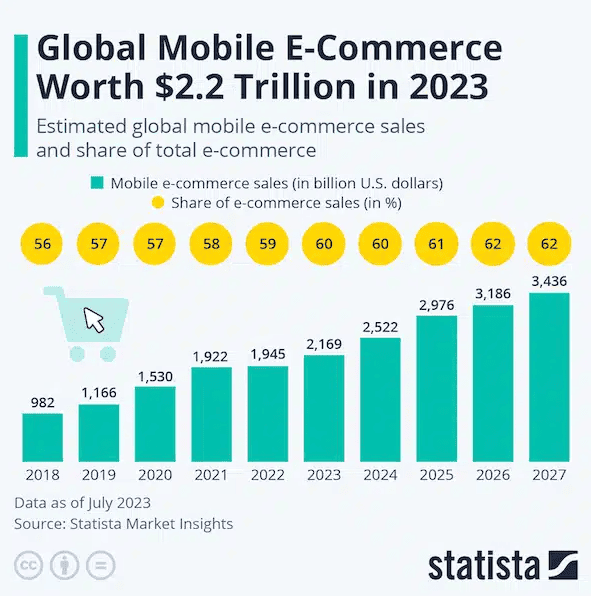
52. Mobile commerce (mCommerce) is booming—with sales predicted to reach a massive $2.52 trillion in 2024. That’s a 16.3% jump from the $2.16 trillion in 2023.
Source
53. Amazon Shopping is the top mobile commerce platform on iOS—with about 20.8 million daily active users.
54. While mobile shopping is super convenient, desktop users still have a higher conversion rate (3%) than mobile users (2%).
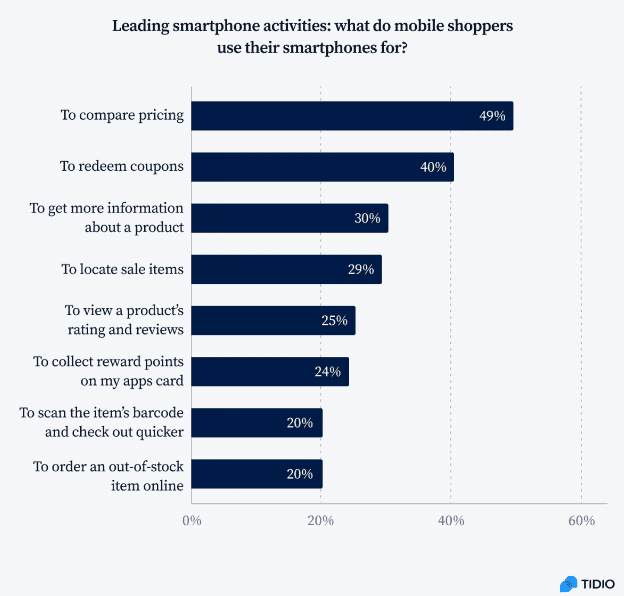
55. Mobile shoppers mainly use their devices to compare prices (49%), redeem mobile coupons (40%), and learn more about products they’re interested in (30%).
Source
56. Shopping apps are growing faster than other apps, with users engaging with them 48% more than the average app.
57. 55% of users have made a purchase after finding a product on social media, highlighting the impact of social media on buying decisions.
58. Dedicated mCommerce apps are preferred for mobile shopping, handling 54% of all mobile commerce payments.
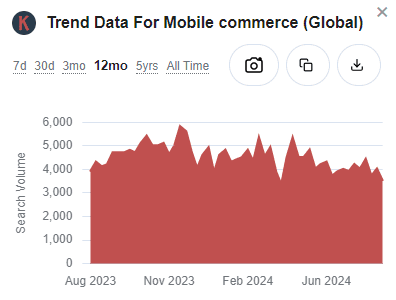
59. Trend data from Keywords Everywhere shows that mobile commerce search volume has stayed steady for the past year, with no major changes.
60. 61% of consumers prefer retailers that offer augmented reality (AR) experiences, showing a growing interest in interactive shopping.
61. Voice search is becoming more popular in mobile commerce, with 27% of searches on mobile devices now being voice-based.
Mobile Video Statistics
Using video marketing to tell a story lets you connect with your audience on a deeper level. This can boost brand awareness, offer value, and drive more traffic to your website. Plus, it can help you achieve conversions.
Check out these mobile advertising stats that show just how powerful videos can be for businesses.
62. YouTube remains a top platform, with over 500 hours of video uploaded every minute, and 70% of its videos watched on mobile devices.
63. Mobile devices are the go-to for watching social media videos, with 92% of videos viewed on these devices being shared, showcasing their viral potential.
64. Facebook and Instagram are also major players. Facebook sees over 8 billion video views daily, while Instagram’s video consumption has risen, especially with the addition of reels.
Source
65. Shoppable video ads are growing in popularity, particularly on Instagram, Pinterest, TikTok, and YouTube, where interactive videos can significantly boost conversion rates.
66. Mobile video advertising is becoming more effective, with YouTube and TikTok being favored by marketers for their strong audience targeting and engagement.
67. A lot of social media video consumption happens without sound, with 92% of users watching videos muted. This means captions are crucial for accessibility and engagement.
68. Short videos, especially those under 90 seconds, hold viewers’ attention well, making them an effective strategy for content creators.
69. About 75% of people prefer to watch videos horizontally on mobile devices.
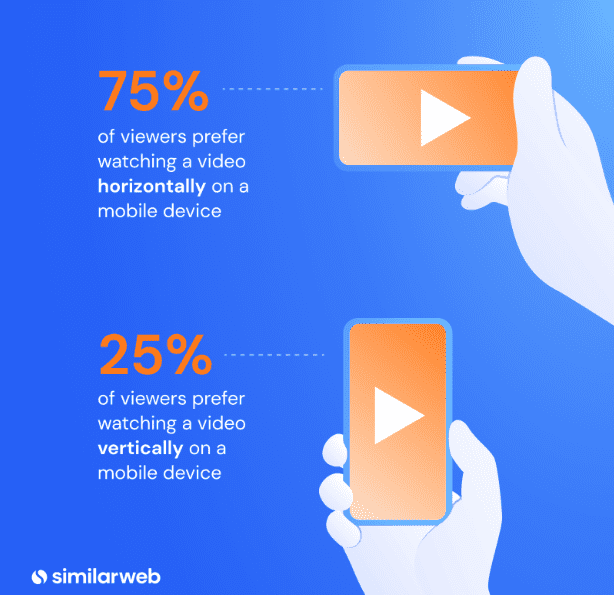
Source
70. 70% of people who watch videos online do so on their smartphones.
71. A solid 92% of people who view a video on a smartphone will share it with others.
72. On X (formerly Twitter), 93% of video viewers are using mobile devices.
73. 77% of people who watch a video about an app end up downloading the app.
74. 38% of marketing videos are created using smartphone apps.
Conclusion
Mobile marketing is thriving in 2025, and it’s very clear this trend is here to stay.
As more companies recognize the power of mobile-focused campaigns—the potential for reaching new leads, boosting sales, and attracting customers has never been greater.
If you haven’t embraced mobile marketing yet, you’re likely missing out on big opportunities.
So dive into our mobile advertising stats to refine your strategies and take full advantage of this growing field.