Back in 2006, what started as a simple idea to share short status updates became one of the most talked-about platforms in the world.
Twitter grew rapidly, became a public company, and eventually caught the attention of Elon Musk—who bought it in 2022 for $44 billion and renamed it X.
Since then, X has evolved far beyond tweets. It’s become a hub for real-time news, bold opinions, viral moments, and major cultural conversations. Despite the rebrand and ongoing changes, it remains one of the top social media platforms globally.
In this article, we’ll explore important X user stats, including how the platform has grown, where users are coming from, and how people engage with it every day.


Top X User Stats
If you want a clear picture of how big X has become and just how many people are using it, these top X user stats will give you the highlights in one quick glance, showing you the most important numbers that tell the story of X’s user base today.
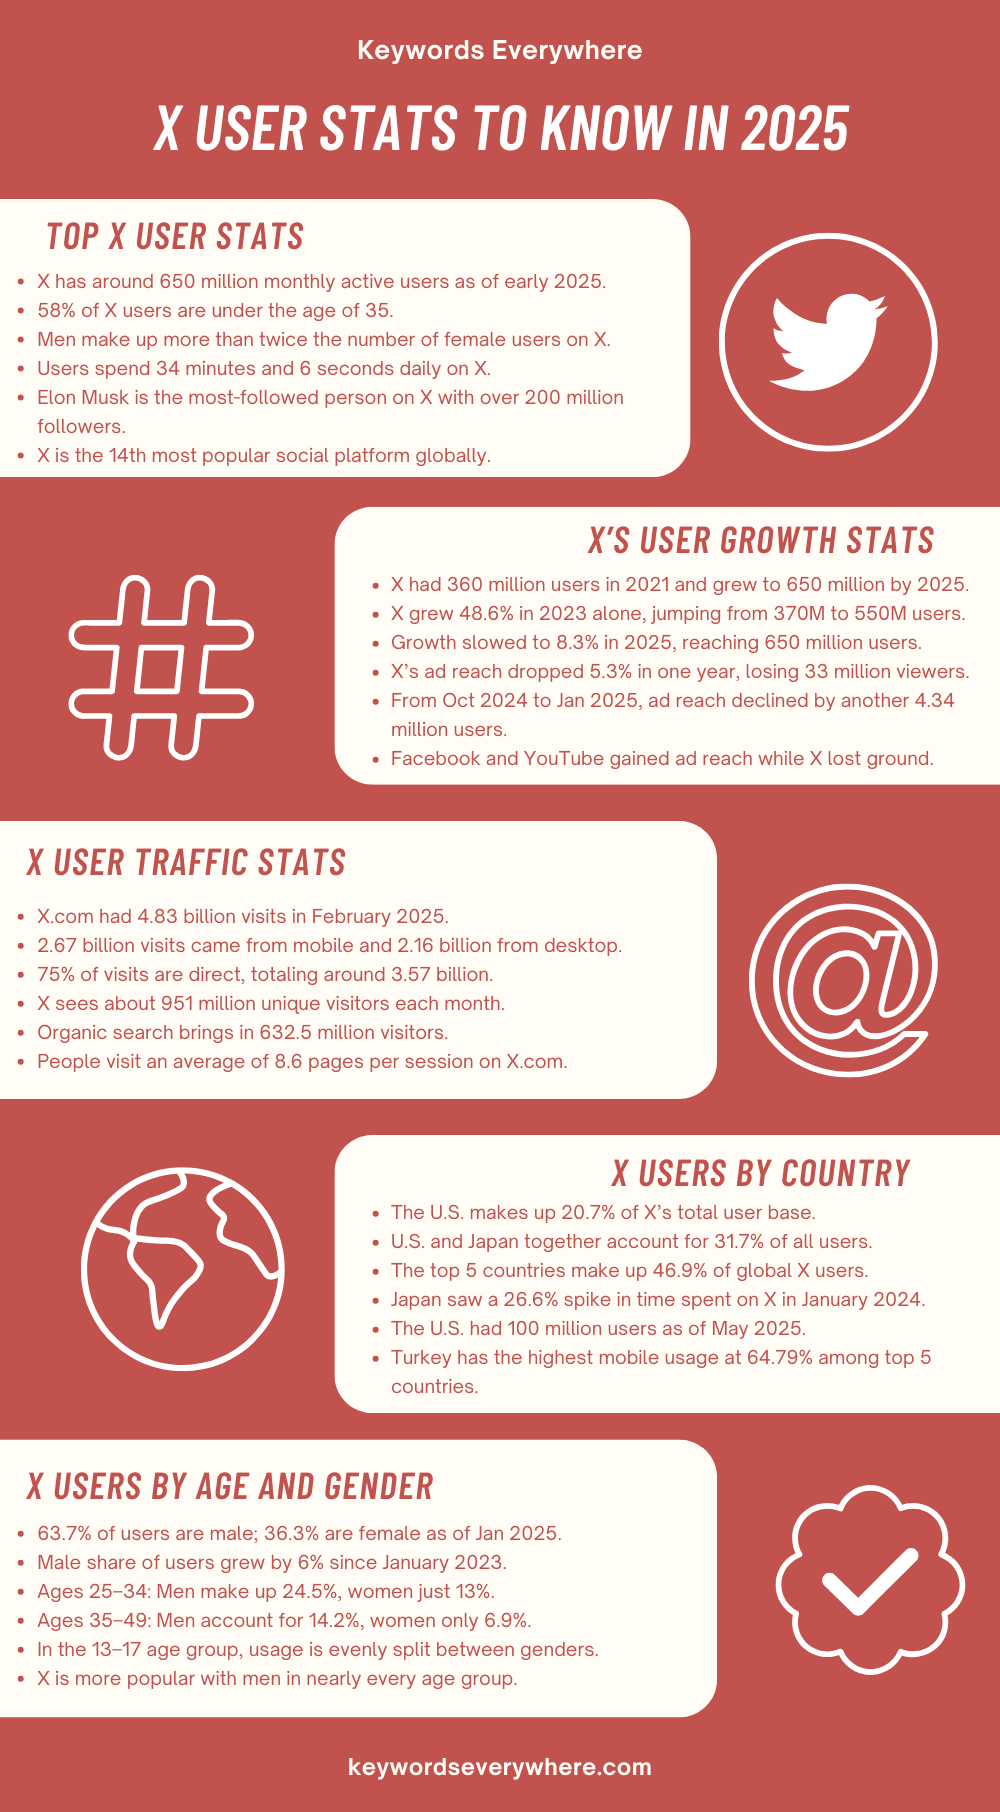
1. As of early 2025, X (formerly Twitter) has around 650 million monthly active users worldwide.

Elon Musk tweet on X user base
2. Nearly 58% of X users are under 35, showing the platform still appeals most to a younger crowd.
3. The platform has a noticeable gender gap, with just over twice as many men as women using X.
4. On average, users spend 34 minutes and 6 seconds on X every day, browsing, posting, or keeping up with trends.
5. Elon Musk has become the most-followed person on X, with more than 200 million followers. Barack Obama comes next in the list, with 131.6 million followers.
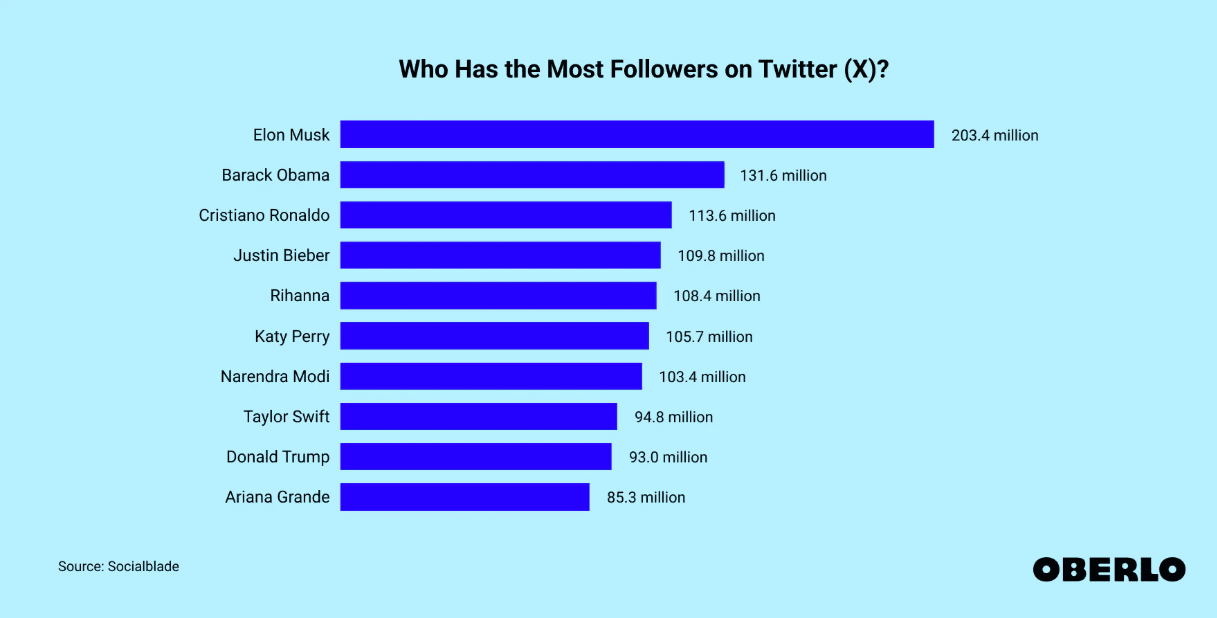
Most followed accounts on X
6. The United States leads with around 70–80 million users, but India and Indonesia are quickly catching up thanks to widespread mobile use.
7. Globally, X ranks as the 14th most popular social media site based on total users.
8. One of the biggest reasons people use X is the speed of information, especially for news and entertainment.
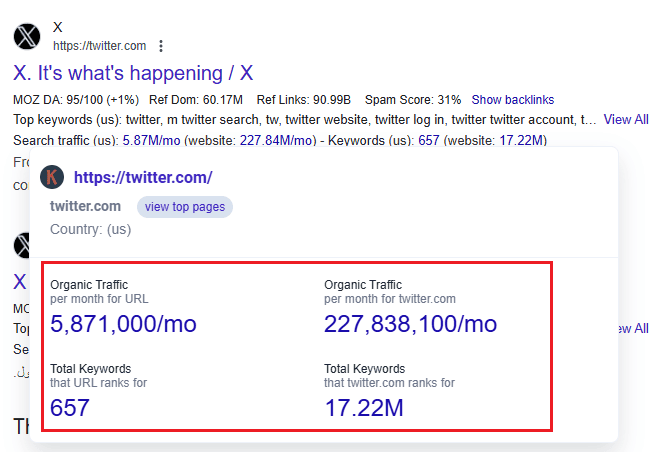
9. According to Keywords Everywhere, twitter.com receives over 227 million visits per month and shows up in searches for over 17 million keywords.
X’s User Growth Stats
It’s one thing to know how many people are on X now, but it’s even more telling to see how fast that number has been growing over time, especially as trends shift and more people turn to the platform for news, opinions, and conversations.
These X user stats look at how X has expanded year by year, revealing whether it’s still gaining ground or starting to slow down.
10. X had 360 million monthly active users in 2021, growing slowly at first.
11. In 2022, the user count increased slightly to 370 million, up 2.8% from the previous year.
12. 2023 saw a major jump, with users reaching 550 million, marking a huge 48.6% growth.
13. Growth continued in 2024, hitting 600 million users, a 9.1% increase year-over-year.
14. By early 2025, X reached 650 million monthly active users, growing by another 8.3%.
15. Despite rising user numbers, X’s global ad reach dropped by 5.3% over the past year. That’s a loss of about 33 million potential ad viewers between January 2024 and January 2025.
16. In just three months, from October 2024 to January 2025, X’s ad reach fell by another 4.34 million users, a 0.7% dip.
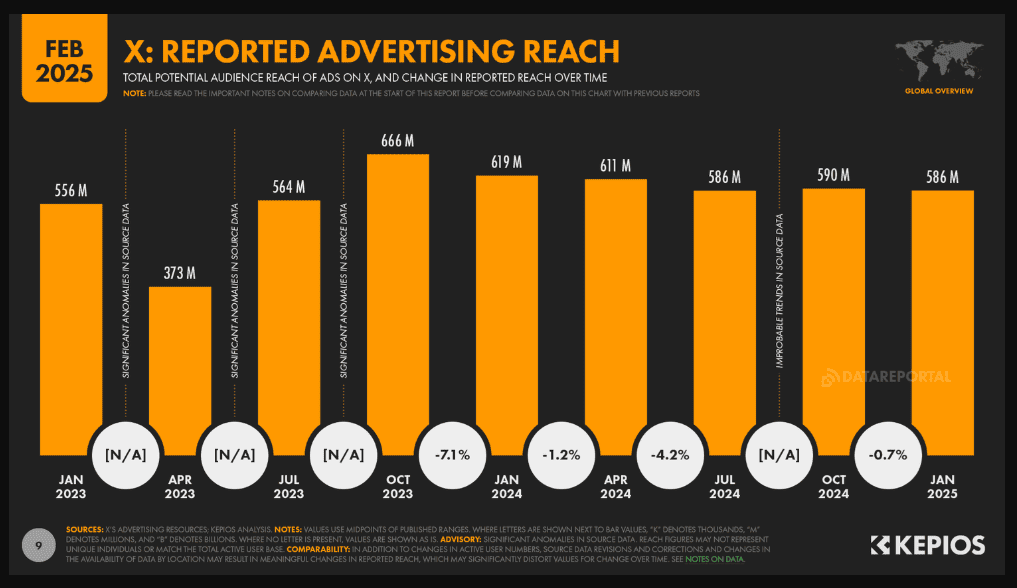
X advertising reach 2025
17. While X’s ad reach declined, Facebook gained 93.3 million in ad reach, and YouTube added 39.7 million, showing that other platforms grew while X shrank in this area.
X User Traffic Stats
Behind every post and reply is a wave of traffic flowing through X every single day, and these traffic stats show just how often people are logging in, scrolling, and interacting with the platform.
Whether it’s daily visits, monthly active users, or time spent on the app, these X user stats break down what user activity really looks like across the platform.
18. Back in May 2024, Elon Musk said that X (formerly Twitter) had around 600 million people using the platform every month across the globe.
19. Not long before that, CEO Linda Yaccarino shared that the platform had over 500 million monthly active users, showing steady growth.
20. The most recent data indicate that approximately 245 million people use X daily; however, not everyone agrees with this number.
X daily active users worldwide
21. An independent analysis from Apptopia estimates daily users to be closer to 121 million, which is much lower than what the company reports.
22. Website traffic is going up—X.com had about 500 million visits in April 2024, and by February 2025, that number had jumped to 4.83 billion visits in a single month.
23. Most people are using their phones to access the site—around 2.67 billion visits came from mobile, while 2.16 billion came from desktop.
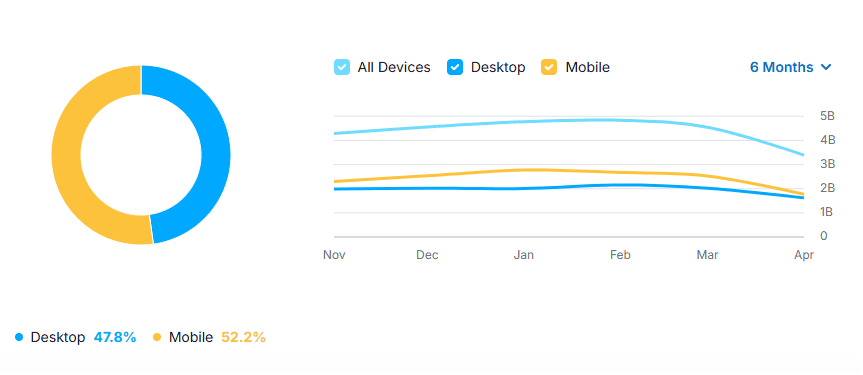
X traffic share by device
24. A large share of users come directly to the site without searching—75% of all visits are direct, which adds up to about 3.57 billion visits.
25. In total, X sees around 951 million unique visitors each month, although that number dropped slightly—down 2.1% from January 2025.
26. X also gets a huge chunk of traffic through search—organic search brings in about 632.5 million visitors, while paid search traffic is minimal at just 2,290 visits.
27. However, organic search traffic is down 10.2% month-over-month, suggesting that fewer people are landing on X through search engines than before.
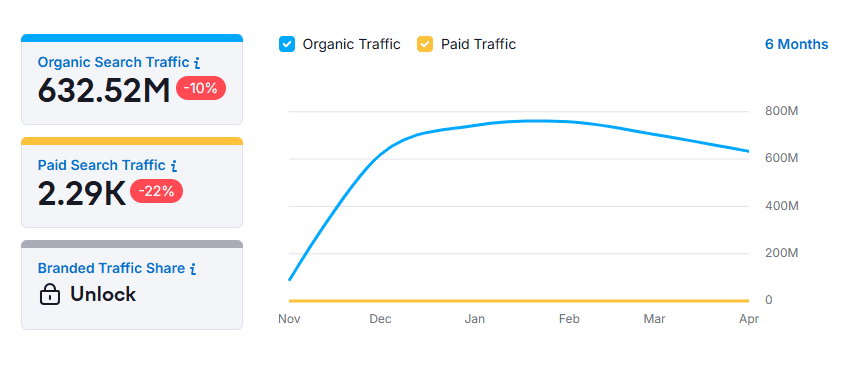
X organic and paid website traffic
28. In April 2024, X.com received 3.39 billion total visits, and the average time people spent on the site was 16 minutes and 56 seconds.
29. On average, people visit 8.6 pages per session, and the bounce rate stands at 47.2%, meaning nearly half leave after viewing just one page.
X Users By Country
X might seem ubiquitous, but not every country uses it in the same way or to the same extent, which is why it’s helpful to examine where its users are located around the world.
The following X user stats explore the countries where X is most popular and highlight the regions that drive the most activity, giving you a sense of its true global reach.
30. As of May 2025, the United States has the largest share of X users, making up about 20.7% of the entire platform’s audience—that’s roughly 100 million users.
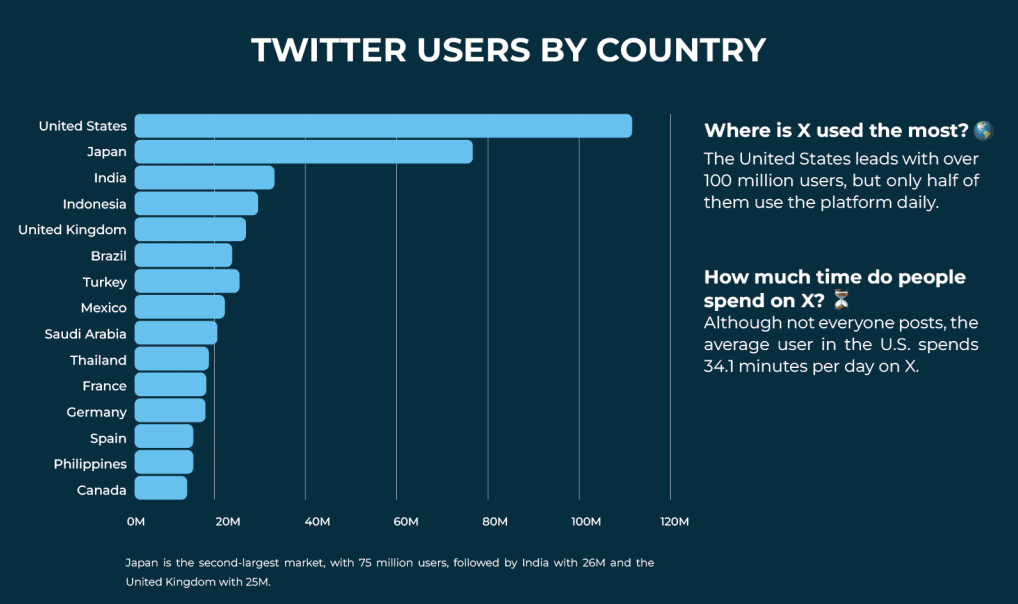
X users by country
31. Together, the U.S. and Japan account for nearly a third (31.7%) of all X users, showing that these two countries have a major influence on what trends and conversations take off.
32. When you combine the top five—U.S., Japan, India, Turkey, and Brazil—you get almost half of the global X user base (46.9%), which means just five countries drive much of what happens on the platform.
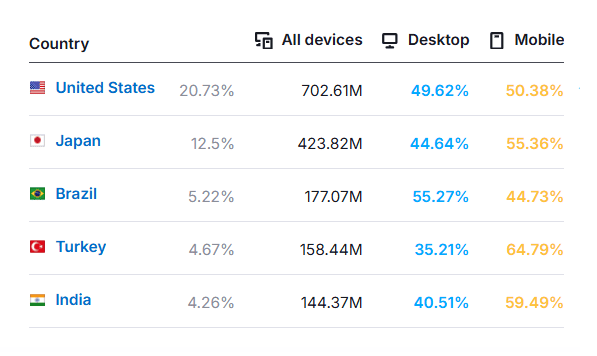
33. Here’s how the top 5 countries break down:
- United States: 20.7% of users, with 50.38% on mobile and 49.6% on desktop
- Japan: 12.5% of users, 55.36% mobile, 44.64% desktop
- Brazil: 5.2% of users, with 44.73% using mobile, and 55.27% on desktop
- Turkey: 4.67% of users, and a massive 64.79% on mobile, only 35.21% on desktop
- India: 4.26% of users, with 40.51% on desktop and 59.49% on mobile.
X website traffic by country
34. X has also seen surges in user engagement, especially early in 2024. Total time spent on the platform rose by 9.5% in just one week in January, according to Elon Musk.
35. That same week, user activity grew in the U.S. (up 7.4%), Canada (up 8.6%), and the UK (up 9%), showing that more people were spending more time on X across multiple regions.
36. But the biggest spike came from Japan, where time spent on X jumped by 26.6%, highlighting how deeply the platform is woven into daily digital life there.
X Users By Age
Different age groups use X for various reasons, and seeing how the platform’s user base is spread across generations tells us a lot about who’s shaping the conversations online.
The following X user stats will reveal which age groups are most active on X and whether younger or older users are leading the way.
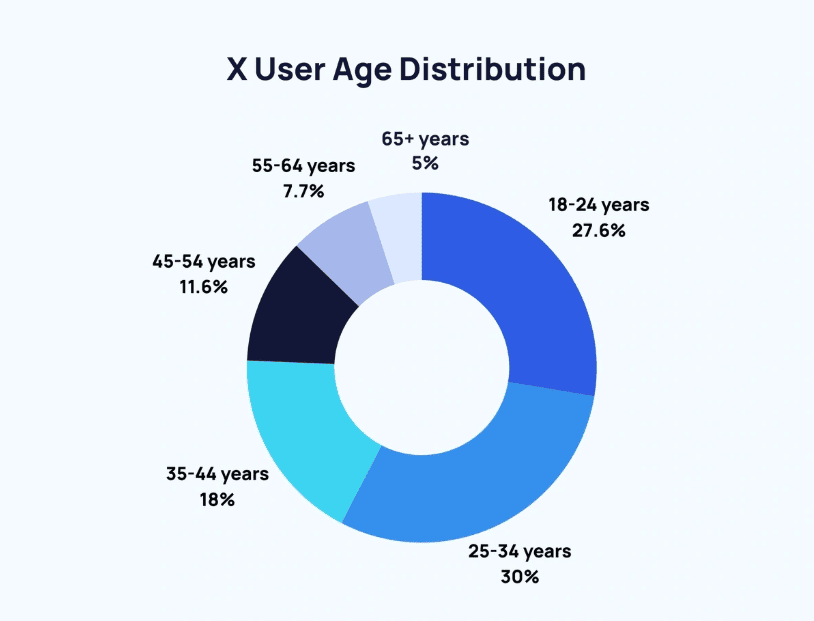
37. Most of X’s users are young—around 58% are under the age of 35, meaning younger people are still driving the conversations and trends on the platform.
38. When you look at the breakdown, it becomes even clearer who’s driving activity on X:
- 18–24 years: 27.6%
- 25–34 years: 30%
- 35–44 years: 18%
- 45–54 years: 11.6%
- 55–64 years: 7.8%
- 65+ years: 5.1%
X users by age
39. People in their late teens and early 30s tend to view X more positively—41% of users aged 18 to 34 have a favorable opinion of the platform, which drops off significantly in older age groups.
40. Among those aged 65 and older, only 24% view X favorably, showing a clear generational divide in how the platform is perceived.
41. Interestingly, the most negative opinions come from people aged 45 to 64, with 42% of them saying they have an unfavorable view of X.
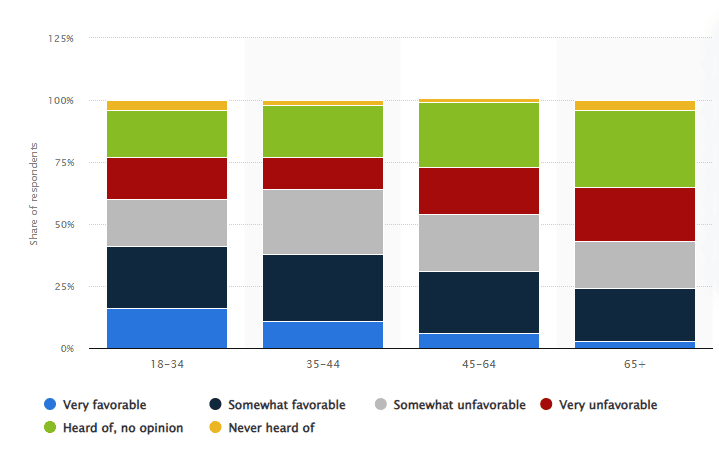
Adults in the US who have a favorable impression of X
42. Almost everyone seems to know what X is—only 2% of people aged 35 to 64 said they had never heard of it, which suggests strong brand recognition even among older users.
43. As for teens, 23% of 13 to 17-year-olds use X, making it the sixth most-used social media app among teenagers, though that’s a drop from the 33% usage rate seen back in 2014–15.
X Users By Gender
Gender can influence how people use social platforms, and when it comes to X, the split between male and female users (and others) gives insight into who’s showing up, speaking out, and shaping trends.
This section of X user stats dives into the gender breakdown of X’s user base and what that means for the platform’s culture and content.
44. As of January 2025, X continues to have a noticeable gender gap—63.7% of users are male, while just 36.3% are female.
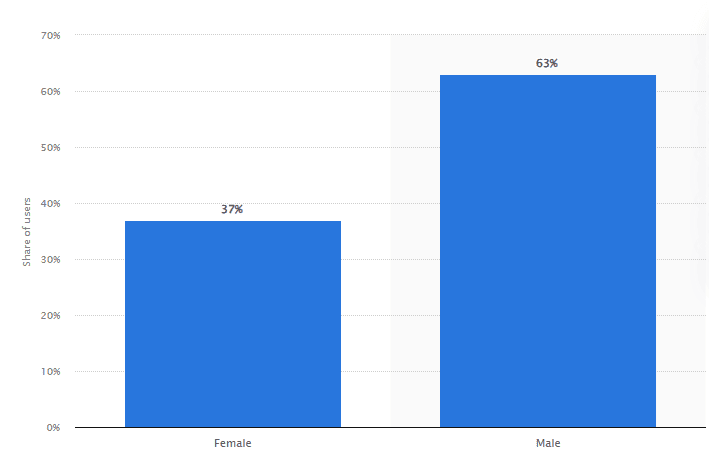
X users by gender
45. This gap has been growing over time—the male share has increased by about 6% since January 2023.
46. Looking at gender across age groups reveals even more detail:
- Ages 13–17: Male and female users are split evenly at 1% each of X’s total ad audience, suggesting fairly balanced teen interest at the youngest level.
- Ages 18–24: Young men make up 18.9% of the audience, compared to 13.2% for young women, showing that males in this age group are significantly more active.
- Ages 25–34: The gender gap widens here—men account for 24.5%, while women represent 13%, making this one of the most male-heavy groups.
- Ages 35–49: Men make up 14.2%, while women account for 6.9% of users, keeping the pattern going into middle age.
- Ages 50 and up: Here too, men lead with 4.8%, while women in this age group make up only 2.5% of the total audience.
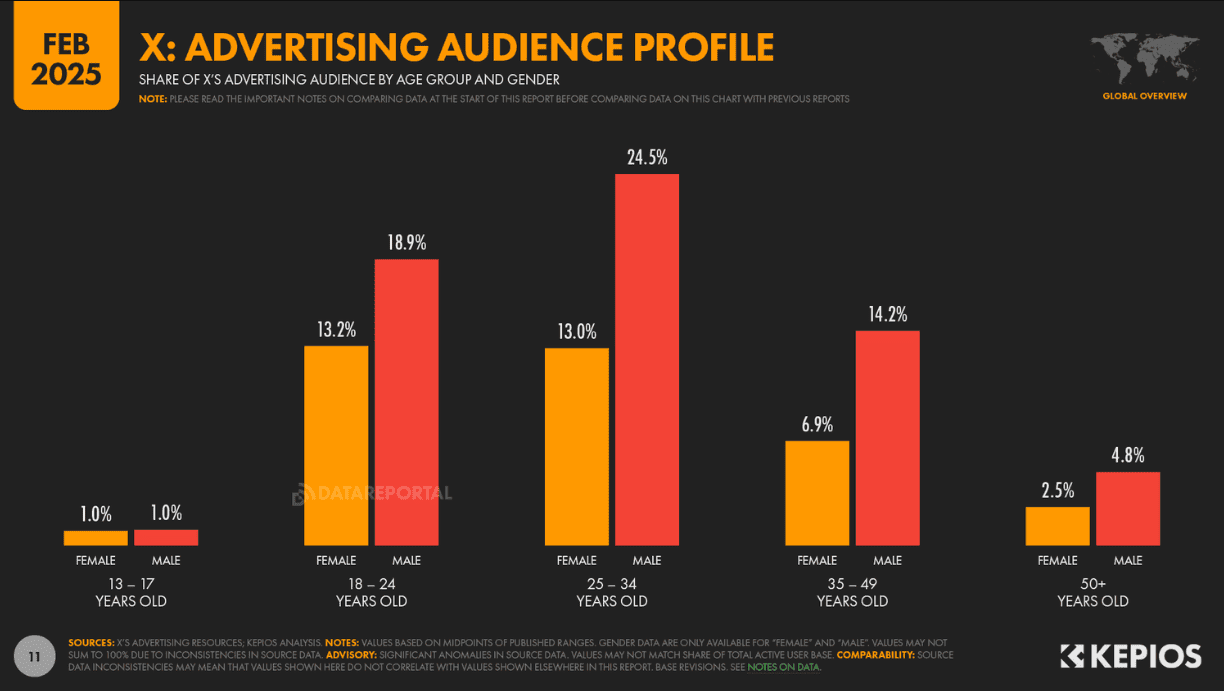
X audience by age group and gender combined
47. Overall, the numbers indicate that X appeals more to men at nearly every age, particularly from their early 20s through their late 40s, and this male dominance has only increased in recent years.
X User Habits
It’s not just about how many people use X—it’s about how they use it, how often they log in, what they like to do there, and how they interact with others while they’re on the app.
This final section looks at real user behavior, from posting patterns to scrolling habits, helping you understand how X fits into people’s daily routines.
48. On average, people spend about 34 minutes a day on X, even though each individual visit lasts around 14 minutes and 39 seconds, according to Semrush. That means users often check in multiple times a day, making it a regular part of their routine.
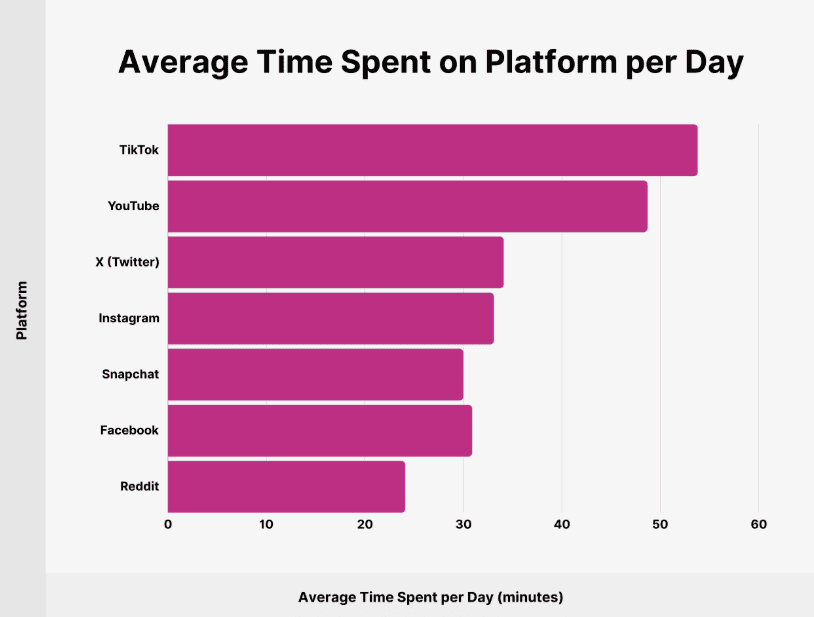
Average time spent on X per day
49. While daily usage might sound high, DataReportal reports that users spend only around 3.7 hours per month on X in total.
50. X claims to be the top platform for discoverability, and its data shows that 36% of users are more likely to be early adopters, meaning they’re often the first to buy new products.
51. These users are also 2x more likely to make in-app purchases as compared to users on other platforms, showing how X can drive not just attention but also action.
52. A study by DataReportal found that over 37% of users actively research brands and products on X, making it the fifth most popular social platform for brand research.
53. When it comes to content, it’s a small group that’s doing most of the talking—just 10% of users create 92% of all posts, and these highly active users post an average of 157 times per month. By contrast, the average adult user in the U.S. posts only once per month.
54. As for why people use X, the top two reasons are clear: 48% come for news and 48% for entertainment. Beyond that:
- 34% use it to keep in touch with friends or family
- 33% follow brands and companies
- 14% use it for professional networking
- 12% have other reasons
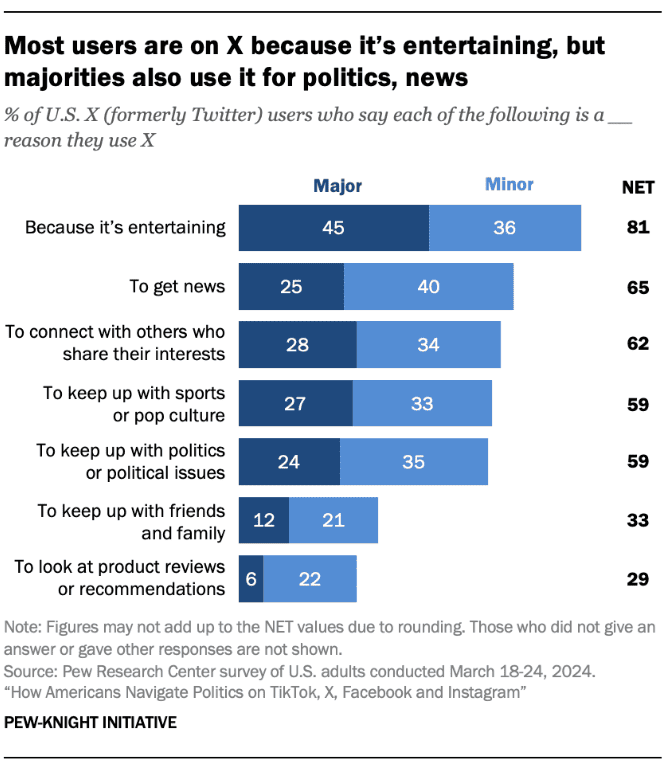
Top reasons why users are on X
55. Interestingly, almost every X user (99.9%) also uses other social media platforms. The biggest overlaps are with Instagram (88.1%), Facebook (81.2%), and YouTube (80.8%), showing that people are often active across multiple apps.
56. When it comes to engagement, video posts perform the best, getting an average engagement rate of 0.42%, while text-only posts do slightly better than photo posts, with 0.1% for text and 0.08% for photo posts. So, if you’re posting on X, videos are the most likely to get noticed.
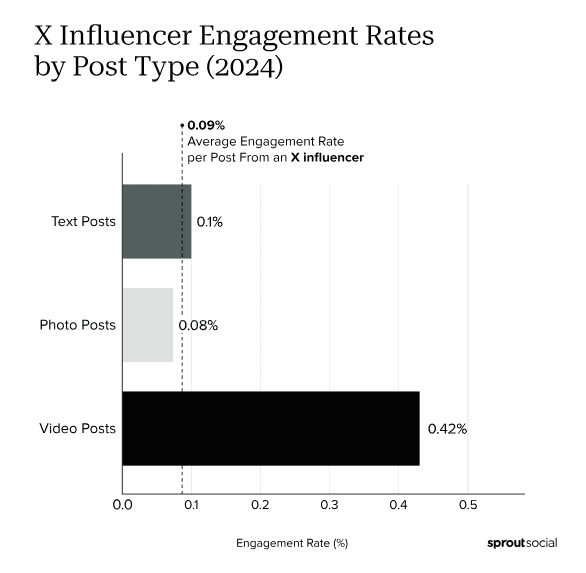
X influencer engagement rates by post types
57. When it comes to who’s posting the most, media companies lead the way, tweeting nearly 50 times a week on average. Sports teams are right behind, tweeting about 44 times per week.
Conclusion
That wraps up our deep dive into X user stats.
Despite all the changes and rebranding, one thing is clear—X still has a strong, loyal user base and continues to attract millions each year.
From rising global traffic to steady growth among younger age groups, the platform is evolving to stay relevant in a fast-moving digital world.
Whether you remember it as Twitter or now call it X, the platform remains a major force in how people share, discover, and talk about what’s happening—and by the looks of it, X isn’t going anywhere anytime soon.