Knowing the latest advertising trends is key for digital marketers like you to hit your goals effectively. It’s like having a roadmap that clears away the guesswork and helps you tweak your strategies to match consumer behavior, new platforms, and their evolving preferences.
That’s why we’ve gathered the most crucial advertising stats for you. This guide will be your go-to for figuring out where and how to invest your digital ad budget in 2025 and beyond.
Ready to dive in? Let’s get started!
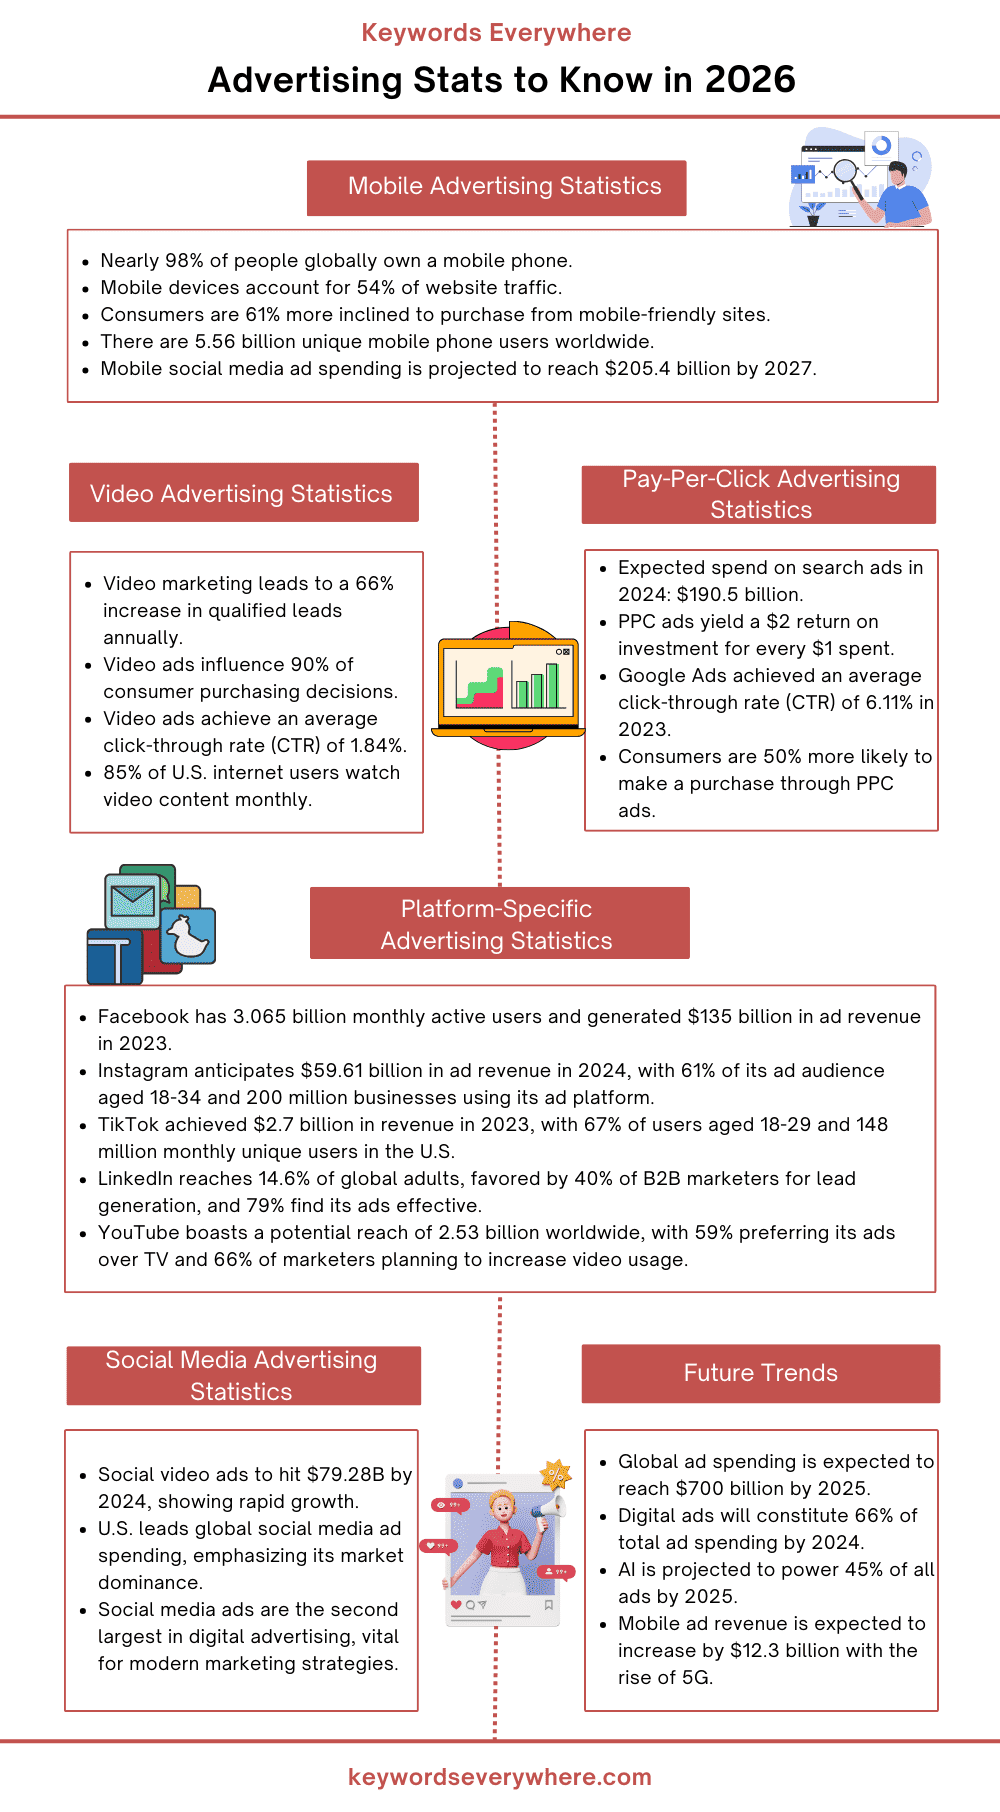


Mobile Advertising Statistics
Mobile advertising is all about reaching people directly on their smartphones or tablets. These days, more and more people are using their mobile devices to decide what to buy and to check out different products and services.
You can use mobile ads on websites that work well on phones, in search results, on social media, and even in apps and games. This approach helps you connect with a larger group of potential customers, get your brand seen more online, and boost your sales.
If you haven’t started using mobile ads yet—you could be missing out on a lot of potential business. Let’s look at some key stats that show why mobile marketing is so important for your business:
1. Nearly all people worldwide (97.8%) own a mobile phone of some kind.
2. Mobile phones generate 54% of all website traffic, surpassing desktop users. If your website isn’t mobile-friendly, you could miss out on many leads.
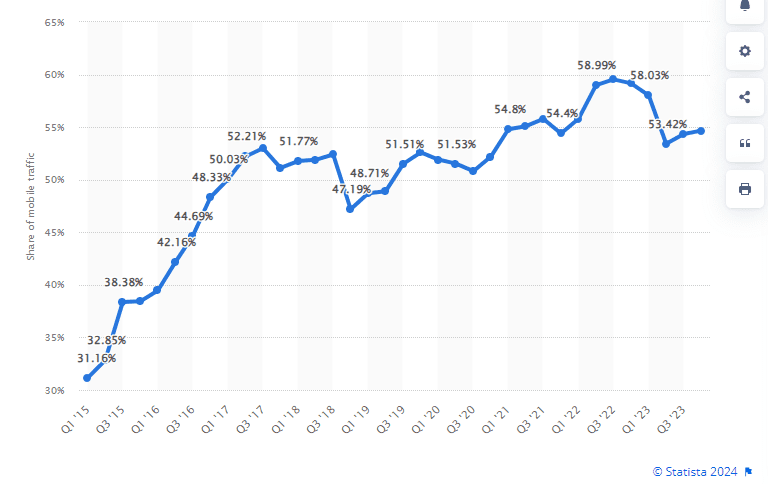
Source
3. Americans spend an average of 4.5 hours daily on their phones.
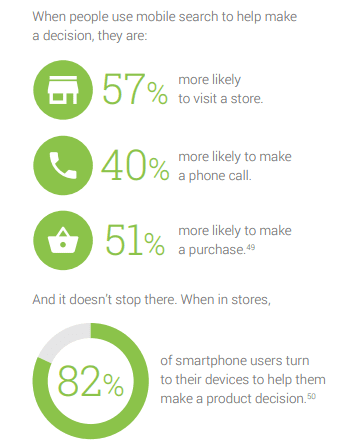
4. 61% of consumers are more likely to buy from mobile-friendly websites.
5. Mobile devices make up about 57% of people’s online time and 53% of global web traffic.
6. There are 5.56 billion unique mobile phone users worldwide, which is 69.1% of the population.
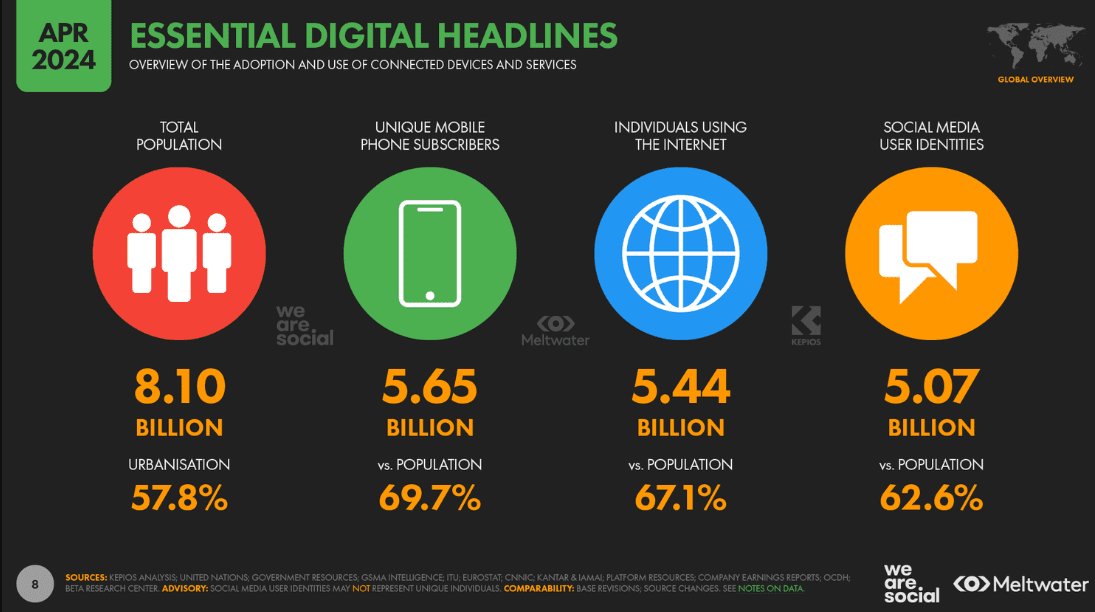
Source
7. By 2027, mobile social media ad spending will hit $205.4 billion, up from $170.3 billion in 2023.
8. U.S. marketers allocate 19% of their marketing budget to mobile advertising.
9. 52% of PPC clicks come from mobile devices. So optimize your landing pages for mobile users if you use PPC to reach leads.
10. When mobile users search on their phones, 96% use Google. Investing in methods that target these users on Google can help you reach leads.
Source
11. 41% of email views, and 75% of Gmail users’ views, occur on mobile devices.
12. Almost 90% of YouTube views are from mobile devices.
13. 98.5% of Facebook users access this platform via mobile devices.
14. Users spend 40% less time exploring a website on a mobile device than on a desktop.
Video Advertising Statistics
Video marketing is all about using videos to promote your business and products. When you create and share videos, they can grab people’s attention and keep them engaged longer on your website.
This is very important because it can make your content more valuable to potential customers and even make your website rank better in search results.
Think about it: when you’re online, do you often find yourself clicking on videos rather than reading long paragraphs? Many people do!
That’s why adding videos to your emails, social media posts, and website can really attract more visitors.
Here are some interesting stats that show how powerful videos can be for boosting sales and revenue in your business.
15. Many marketers use video content for different purposes. After presentations, which are used by 65% of marketers, advertising comes next at 57%, just ahead of explainers at 47%.
16. According to surveys, most marketers find that adding music (81%), using voice overs (66%), and minimizing text (78%) in their videos significantly boosts their effectiveness.
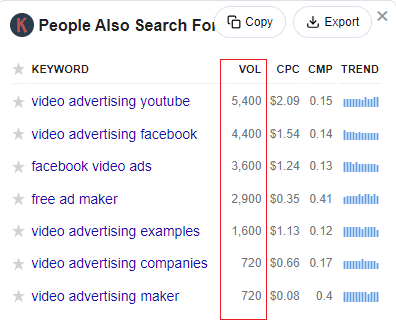
17. According to Keywords Everywhere, many people are searching for terms related to video advertising. This shows that lots of businesses want to use videos as ads—especially on popular platforms like YouTube and Facebook.
18. Businesses that embraced video marketing in 2020 and 2021 saw a remarkable 66% increase in qualified leads per year.
19. About 85% of internet users in the United States watch video content every month on their devices.
20. Video ads are really effective—with an average click-through rate (CTR) of 1.84% and influencing 90% of consumer purchasing decisions. On social media, video ads engage audiences 2-3 times more effectively than non-video content.
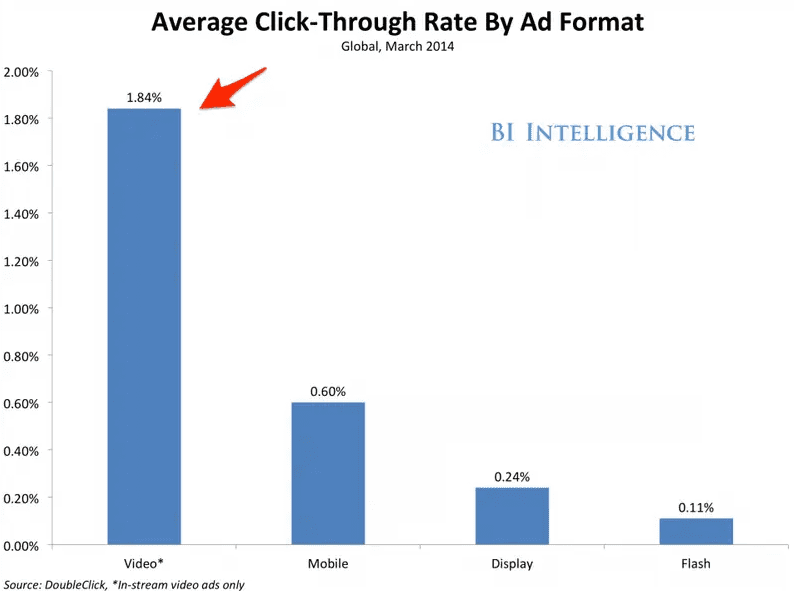
Source
21. When making purchasing decisions, about 90% of users say that watching videos helps them decide.
22. Over 40% of global shoppers have purchased products they discovered through YouTube.
Pay-Per-Click Advertising Statistics
Pay-per-click advertising, or PPC, is a powerful way to promote your business online. With PPC, you can easily place ads on search engine results pages (SERPs), social media, and various websites.
The best part? You only pay when someone clicks on your ad, making it a cost-effective strategy.
PPC lets you zero in on your target audience. You can control who sees your ads, ensuring they reach your most valuable customers, which boosts your chances of getting more leads and sales.
Plus since PPC ads appear before regular search results—you’re more likely to catch the eye of potential visitors to your website.
Let’s dive into some eye-opening PPC advertising stats that show how impactful paid search can be for your business!
23. In 2024, companies worldwide are expected to spend around $190.5 billion on search advertising.
24. For small to mid-sized companies, the average PPC campaign costs between $100 and $10,000 per month.
25. With effective optimization, PPC advertising can deliver an average return of $2 for every $1 spent. That’s a 200% return on investment (ROI)!
Source
26. Users who click on PPC ads are 50% more likely to make a purchase than those who click on organic search results.
27. Interestingly, more than half of the users can’t tell the difference between PPC ads and organic search results.
28. Google leads the way—with four times as many people more likely to click on a paid search ad on Google than on any other search engine.
29. In 2023, Google Ads had an average click-through rate (CTR) of 6.11% and the average cost per click was $4.22.
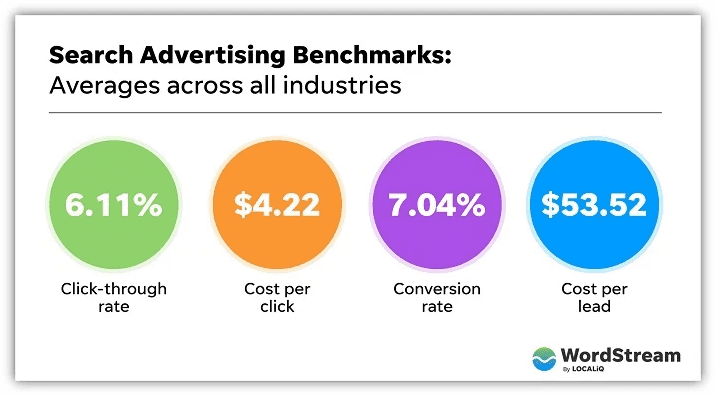
Source
30. A huge 96% of advertisers spend money on search ads.
31. Search ads can boost brand awareness by around 80%.
32. Ads that appear in search results earn 45% of page clicks, and the top three PPC ads capture 46% of all clicks.
Display Advertising Statistics
Display ads are like digital billboards online—they’re everywhere! They can be banners, images, videos, or buttons that pop up on websites to grab your attention. These ads are crafted to make you curious and click on them. When you click, it not only boosts the chances others will click too but also helps in making more sales.
Check out these stats about digital ads to see just how effective display ads can be:
33. Google has the biggest network for display ads, reaching 90% of internet users worldwide. They cover over 35 million websites, apps, and Google-owned spots.
34. Digital display ads usually get clicked on about 0.35% of the time on average, across all formats.
35. In 2023, more than 90% of display ad spending went into programmatic ads, which are ads bought and sold automatically.
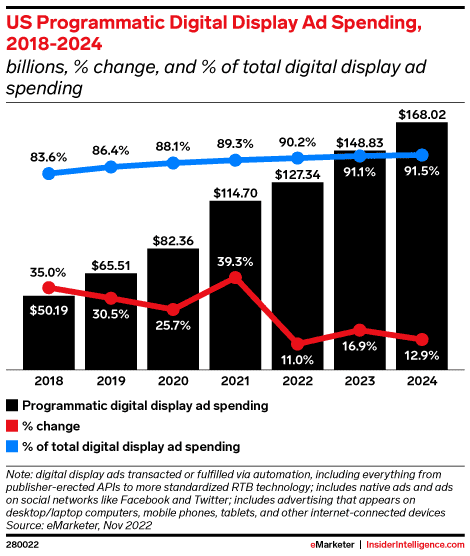
Source
36. The most popular banner size is 728 x 90, also called the leaderboard. It’s used by 57% of advertisers.
37. When it comes to making these ads work better, it’s all about where they go and who sees them. That’s what advertisers are focusing on.
38. Making sure ads work on all devices is key for display ad success. People shop online everywhere so ads need to reach them on phones, tablets, and computers.
39. Even though some marketers (43%) think display ads aren’t the best, about 84% of them keep putting money into them anyway.
Influencer Advertising Statistics
Influencer advertising is all about using people who others trust to talk about your products and services. It’s like getting a recommendation from a friend.
With social media being so popular, influencers have become really important because they can share their thoughts on brands and products easily.
Using influencers is a smart way to promote what you offer online. It helps more people see your brand and can bring in new customers.
If you’re still not sure, here are some influencer advertising stats that prove how effective it can be for boosting your business:
40. Around 25% of marketers team up with influencers to advertise products and services, making it more popular than virtual events, webinars, and social commerce.
41. About 69% of consumers trust what influencers recommend, which is a big deal for brands trying to get noticed!
42. The global influencer marketing market has more than doubled since 2019, reaching $21.1 billion in 2023.
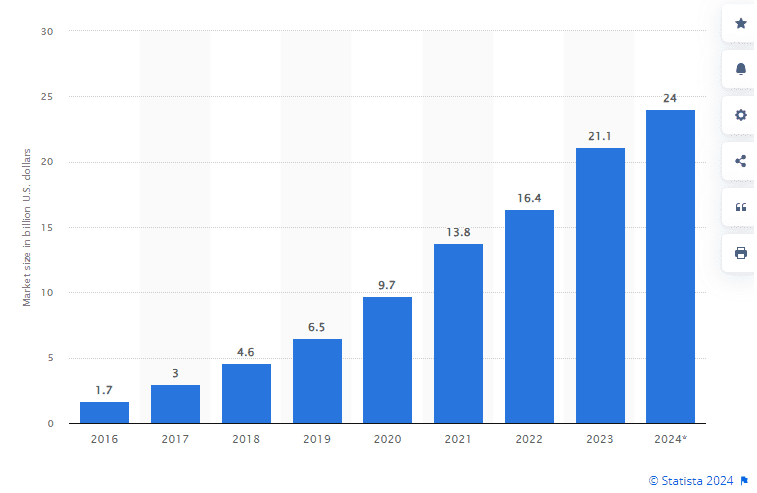
Source
43. According to a survey, a solid 89% of marketers think influencer marketing gives them a good return on investment, comparable to or even better than other channels.
44. When it comes to working with brands—Instagram is the go-to platform for 87% of influencers.
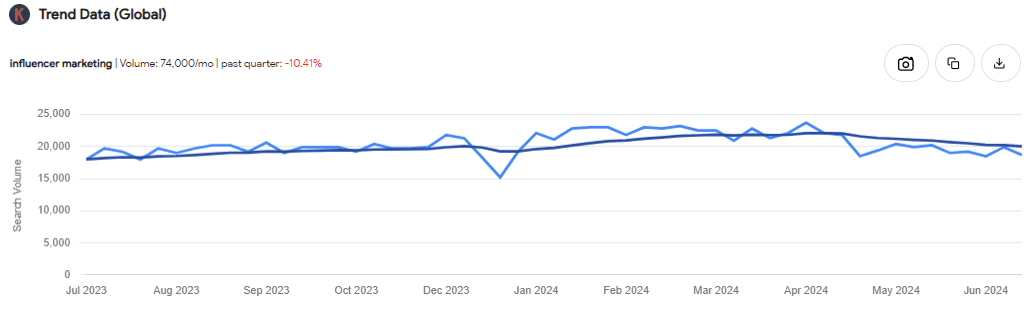
45. Keywords Everywhere reports a consistent upward trend in influencer marketing, showing how more and more marketers are getting into it.
Native Advertising Statistics
Native advertising is all about ads that blend in with the content you’re already interested in. They’re designed to look like they belong there, unlike those flashy banner ads that can feel a bit intrusive.
You’ll find these ads popping up as recommendations on websites, mixed into your social media feed, or even at the top of your search results. They’re meant to be seamless and keep your web browsing experience smooth.
Here are some stats that show just how important native advertising has become for businesses:
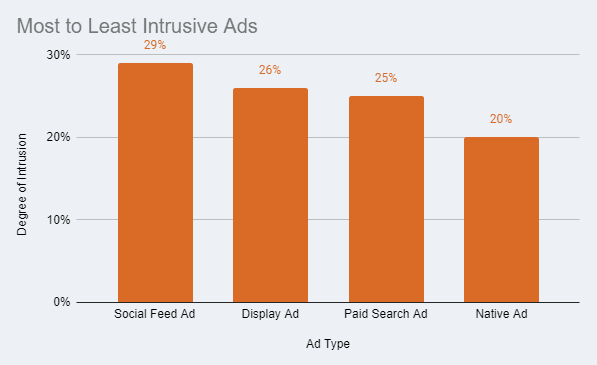
46. Native advertising is seen as the least intrusive type of ads out there.
47. Since native ads are less disruptive, they do a great job getting the brand message across. Back in 2015, a study found they boosted customer interest in buying stuff by 18% and made people like the brand 9% more compared to banner ads.
Source
48. In a survey, about 32% of people said they would share native ad with friends or family, compared to just 19% for display advertisements.
49. Customers also check out native ads about 53% more often than boring old display ads, according to a study.
50. When it comes to clicking, native ads on desktop get about 0.16% clicks, and on mobile, they’re even better at 0.38%. That’s way higher than the 0.11% click rate for old-school banners.
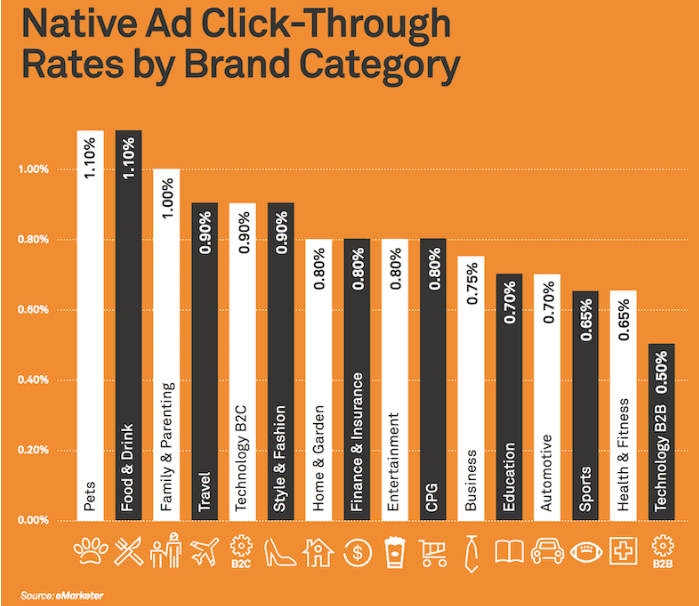
Source
Social Media Advertising Statistics
Social media advertising is a way to run paid ads on platforms like Instagram, Facebook, Twitter, and more. It’s a must for expanding your audience and reaching people you normally wouldn’t. With various targeting options, you can ensure your ads reach those most likely to buy.
Here are some stats that show just how effective social media advertising can be:
51. Social video advertising is set to reach about $79.28 billion by 2024.
52. Social media ads are the second biggest player in the digital ad game.
53. The U.S. is the biggest market for social media ads in the world.
54. Social media is super popular for marketing, with about 87% of marketers using it to advertise.
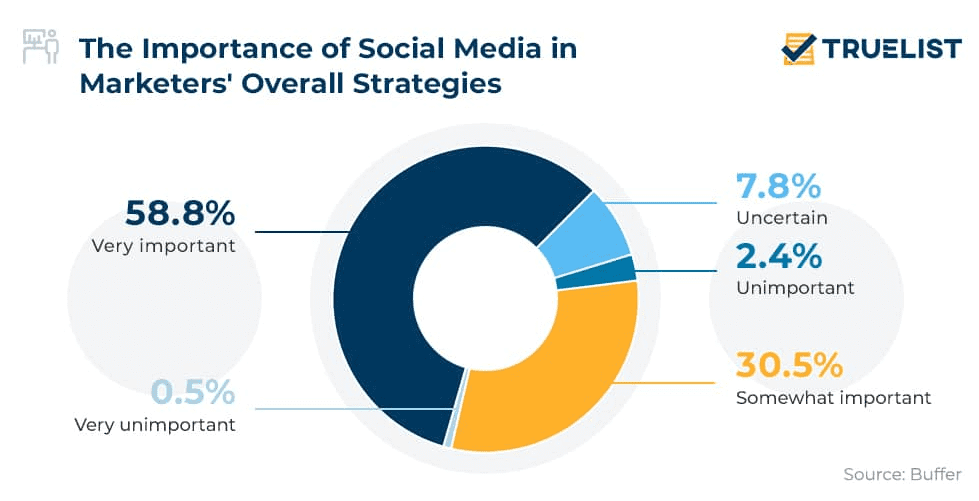
Source
55. Around 74% of people turn to social media when deciding what to buy.
56. The average click-through rate (CTR) for a social media ad is 1.36%.
57. In the U.S., the average person is expected to spend $779 on social networks in 2024, and $937 in 2025.
58. On average, people spend 2 hours and 24 minutes on social media every day.
59. There are 4.88 billion social media user accounts—which is about 60.6% of the world’s population.
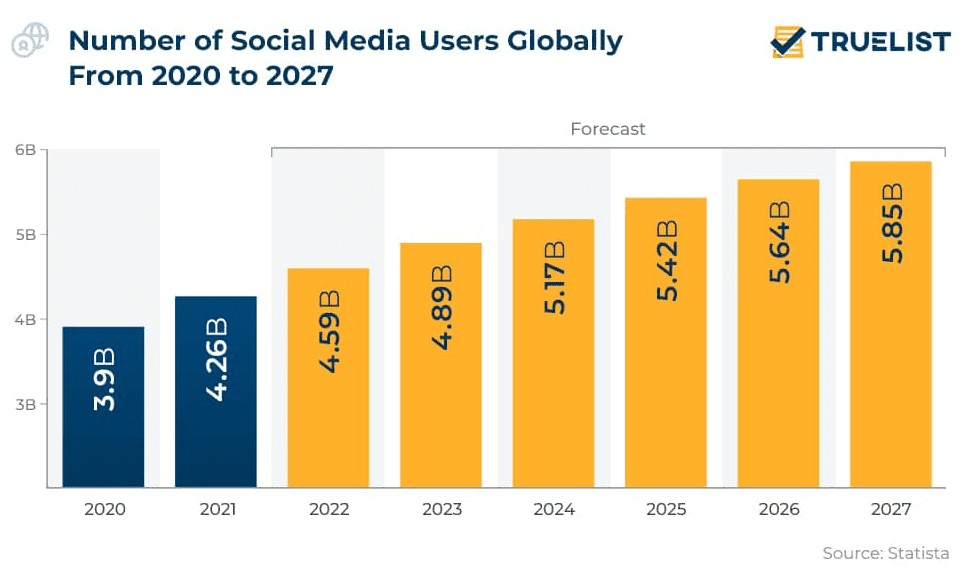
Source
Facebook Advertising Statistics
Facebook is the go-to social media platform for a reason—it’s where nearly everyone hangs out online! Whether you’re targeting young adults, parents, or even seniors, Facebook ads can reach them all. Here’s a look at why Facebook is such a powerhouse in the advertising world:
60. Facebook is the third most visited website, right after Google and YouTube, putting it ahead of Twitter and Instagram.
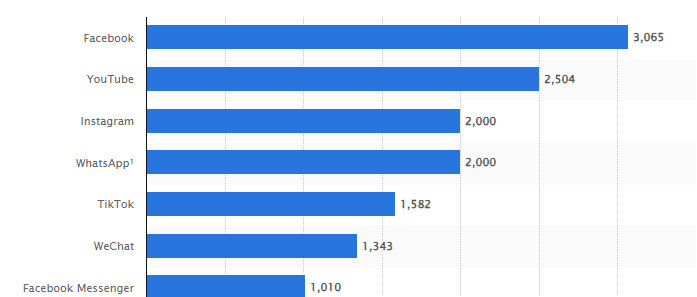
61. It has 3.065 billion active users every month, making it the most popular social media platform in the world.
62. Facebook Marketplace has a potential audience of 495.7 million users for your ads.
Source
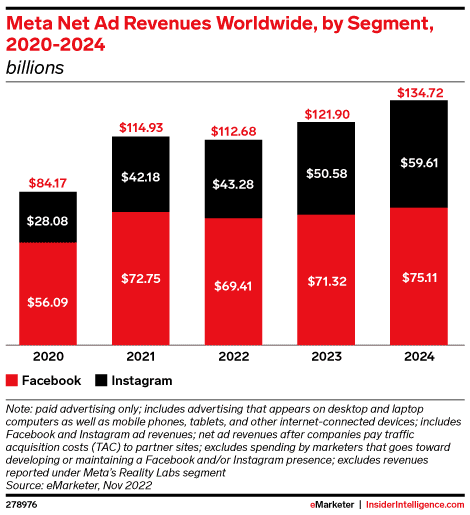
63. In 2023, Facebook’s ad revenue hit $135 billion, up from $116 billion the year before. It is expected to grow to $75.11 billion in 2024.
64. 40% of Facebook advertisers use the Click-to-Messaging format, a smart way to keep customer chats right on the platform.
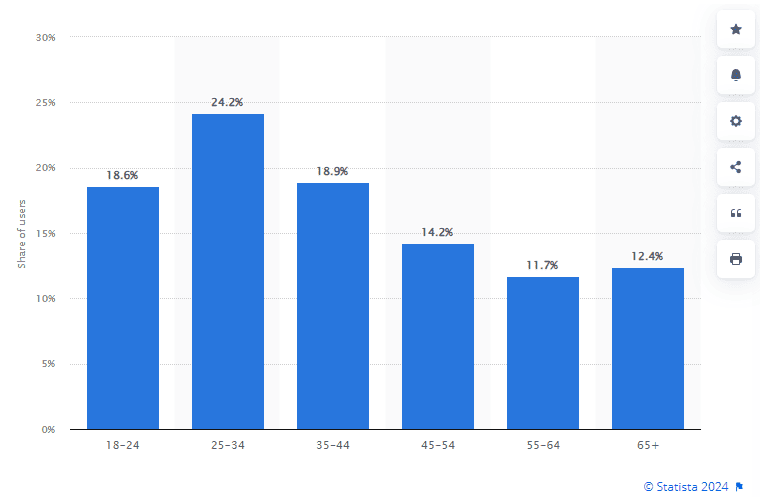
65. The biggest group of Facebook users is aged 25 to 44—making up a whopping 48.8% of its users.
Source
Instagram Advertising Statistics
Instagram’s advertising options make it a marketer’s dream. You can use sponsored content, boost your posts, create Stories and Reels, and even add shopping links. These tools help you reach and engage your ideal customers in so many ways.
Here are some key Instagram advertising stats you should know about:
66. Instagram has the second biggest reach among social media ad platforms in the U.S., with a massive 161.7 million users.
67. Over 200 million businesses are using Instagram’s ad platform to connect with their audiences.
68. Instagram’s ad revenue is set to hit a huge $59.61 billion in 2024. For comparison, Facebook’s ad revenue is projected at $75.11 billion.
Source
69. Around 61% of Instagram’s ad audience is aged 18 to 34, making it a top spot for advertisers aiming at Gen Z and Millennials.
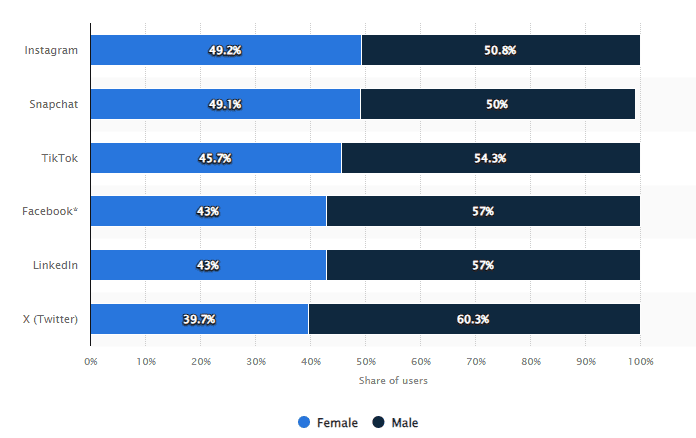
70. Instagram’s ad audience leans slightly male—with 52.4% of users identifying as male.
X Advertising Statistics
X, which used to be Twitter, has gone through some big changes since Elon Musk took over.
Wondering if it’s still a good bet for your ads? Let’s check out the latest stats about X to see where it stands now.
71. X ranks as the 9th most popular social platform in the U.S. According to Pew Research Center, 22% Americans use it, compared to 68% for Facebook and 47% for Instagram.
72. Among American X users, 42% are aged 18-29, followed by 27% in the 30-49 age group.
73. Globally, 60.9% of X users are male, with females making up 39.1%—no other gender options were reported. X has the highest proportion of male users among all social networks.
Source
74. On average, users spend 30.9 minutes daily on X, totaling about 3.6 hours per week or over 15 hours per month.
75. About 66% of brands have a presence on X. While it’s not the largest ad platform, if your audience is here, it’s worth considering for your marketing efforts.

Source
TikTok Advertising Statistics
TikTok is blowing up among advertisers because it’s super popular and has tons of ways to advertise. You’ve got all sorts of ad formats and ways to target your audience. Let’s break down why TikTok is such a big deal for online ads with some facts and figures:
76. According to data from the App Store and Google Play, TikTok generated around $2.7 billion in revenue in 2023.
77. With over 1.5 billion people using this platform every month, TikTok ranks as the fifth most popular social media channel worldwide.
Source
78. The U.S. leads in TikTok users, hitting 148 million monthly unique users, up almost 31% from last year.
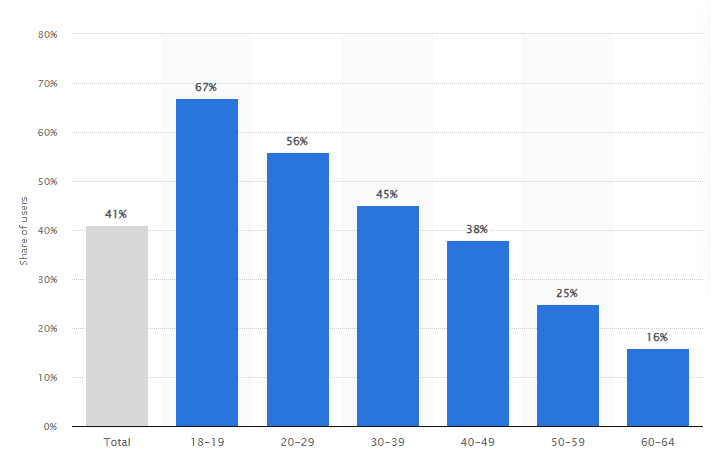
79. In the U.S., 67% of TikTok fans are 18-19 years old, and 56% are in their twenties—a big chunk of the user base.
Source
80. Surprisingly, only 26% of marketers are using TikTok. With such a huge opportunity for brands, more should jump on board.
81. TikTok is where impulse buying happens—55% of users have made snap purchases directly through the app.
LinkedIn Advertising Statistics
Even though Facebook and Instagram are huge for everyone, LinkedIn is where B2B marketers really shine. It’s the place they go to connect with the people making big decisions in business.
Let’s dive into some important LinkedIn advertising stats that every marketer should know:
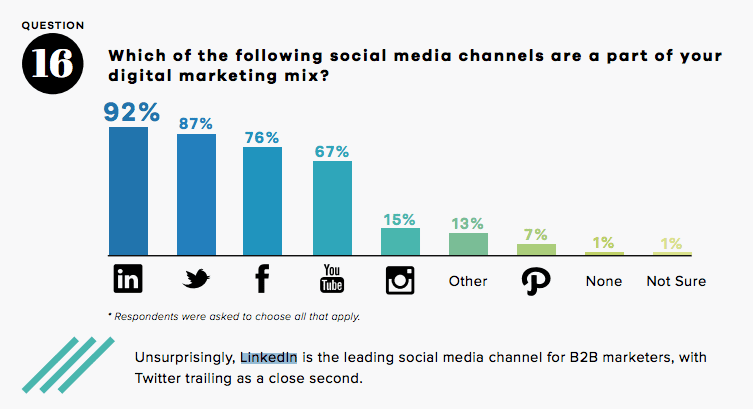
82. LinkedIn is the top platform for B2B. About three-quarters of marketers use it to reach business decision-makers with paid ads, and nearly 80% say those ads give them the best results.
Source
83. It’s not just about posting stuff for free on LinkedIn—ads can potentially reach 14.6% of all adults worldwide.
84. Marketers love using LinkedIn’s search and filters to find quality buyers. That’s why around 40% of B2B marketers think it’s the best for generating leads.
85. Over half of U.S. marketers are now on LinkedIn, especially B2B marketers who are really getting into it for their strategies.
YouTube Advertising Statistics
YouTube is still the go-to for videos, and it’s a powerhouse for advertisers too. If you’re thinking about running YouTube ads, you need to know how they perform.
Whether you’re curious about ad revenue or which ad formats work best, these YouTube advertising stats are key to understanding it all:
86. YouTube can potentially reach about 2.53 billion users worldwide, which is almost like a third of everyone on the planet.
87. 59% of people watching YouTube think the ads there are way more relevant to what they’re into compared to TV or streaming services.
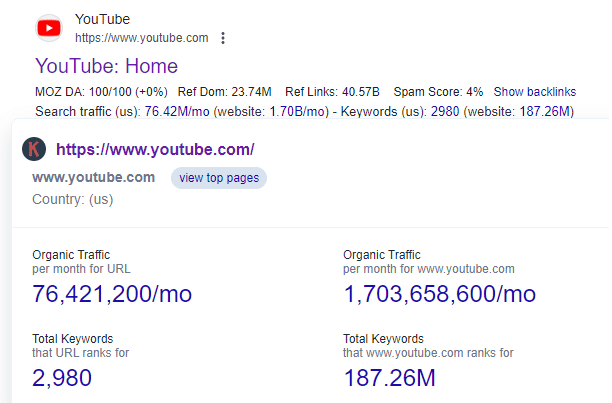
88. According to Keywords Everywhere, YouTube’s website pulls in about 1.70 billion visitors organically each month and ranks for a massive 187.26 million different search terms.
89. About 66% of marketers are looking to use more YouTube videos in their strategies, and 59% want to amp up their natural presence on the platform.
90. YouTube’s the top platform for watching live content online.
91. YouTube rocks as the second-best social platform for content marketing—right after LinkedIn. 86% of content creators say it’s effective in some way.

Source
The Future Of Advertising
As advertising keeps evolving, it’s worth wondering what’s coming next. Will technology keep shaking up how companies advertise, or might we see a comeback of more old-school methods? Let’s dig into what the future of advertising could look like.
92. By 2025, global ad spending is expected to hit about $700 billion.
93. Digital ads will likely make up about 66% of all ad spending by 2025.
94. Artificial intelligence is set to power nearly half—around 45%, of all ads by 2025.
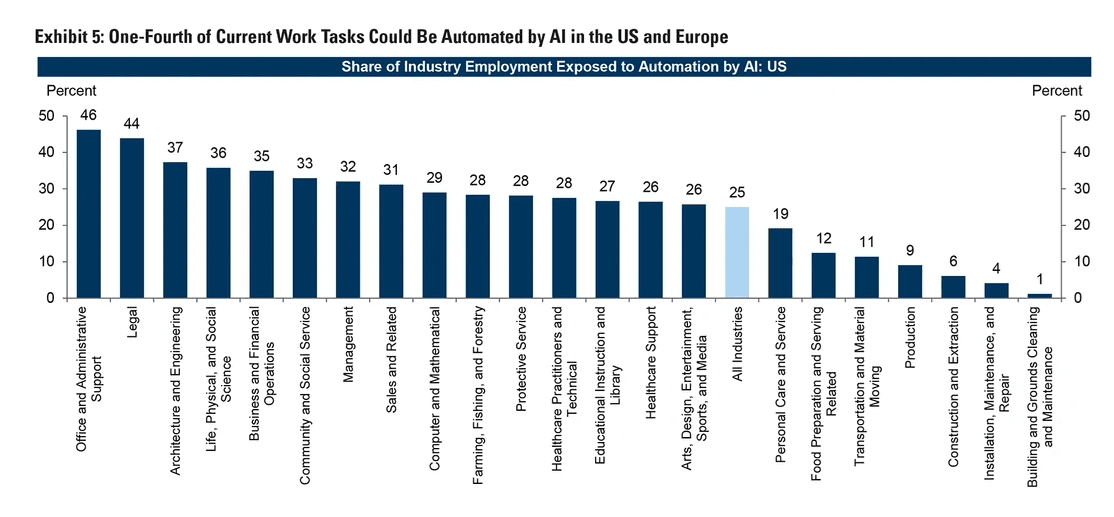
Source
95. With 5G on the rise, mobile ad revenue might jump up by $12.3 billion.
96. Social media ads are going to get even bigger as more than 4 billion people are expected to be on social media by 2025.
Conclusion
The digital advertising world moves fast, bringing challenges and chances for marketers. Staying updated is super important for creating effective strategies that work in a competitive environment. The stats we’ve covered above give insights into how well different platforms like YouTube, LinkedIn, and TikTok perform.
By using their strengths—like YouTube’s wide audience, LinkedIn’s success in B2B marketing, and TikTok’s popularity with younger users—marketers can target their campaigns better to match what people want and how they act online.