After the takeover of Twitter by Elon Musk, many people thought the platform would decline in popularity. However, in 2023, Twitter (now X) had 556 million active monthly users.
A year later, the platform receives about 6.1 billion visits every month.
X now has a business website where you can explore the platform’s new marketing products. You can also advertise on X and use it to grow your business.
An integral part of business growth and marketing is competitor analysis. You want to know how your competitors’ profiles are doing and if their engagement rate is higher or lower than yours.
In this guide, we will show you how to use Keywords Everywhere to check Twitter engagement metrics and improve your marketing strategy.
How to Use Keywords Everywhere to Check Twitter Engagement Metrics
The good news about Keywords Everywhere is that you do not have to do much. If the extension is on, the tool’s widget will automatically analyze the X pages you land on.
Let’s learn how this works.
Step 1: Go to the X Page You Want to Analyze
Let’s say you want to analyze your competitor’s X page. You need to see how much engagement they get and whether their posts get any traction or not.
If yes, you want to check which of their posts seem to be doing numbers on the platform. Since they’re in the same industry as you, your audiences will overlap.
So, you can take inspiration from their more successful posts and tailor your content accordingly.
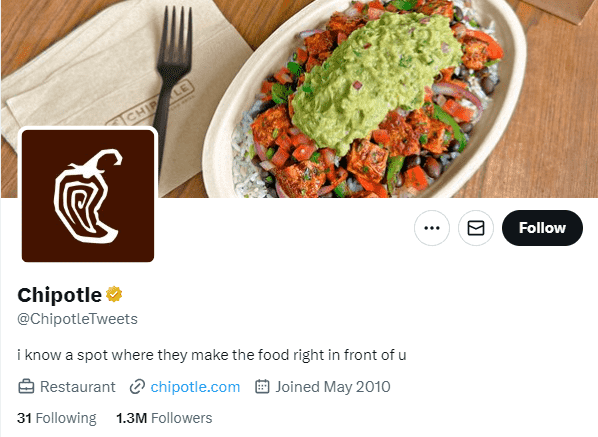
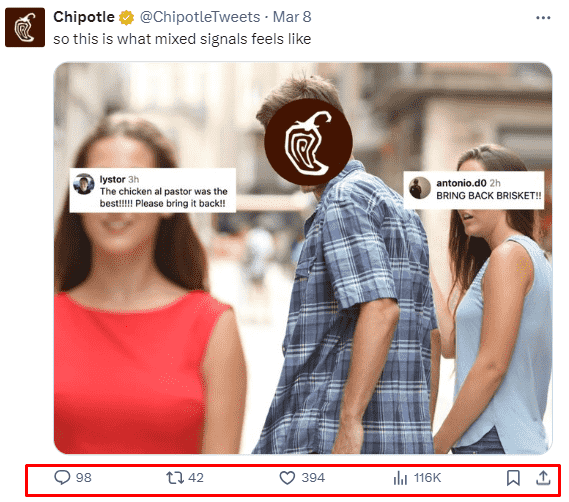
For this example, we will use Chipotle’s X page. The brand has 1.3 million followers on the platform.


Since the Keywords Everywhere extension is on, we can see the widget on the right-hand side of the page.
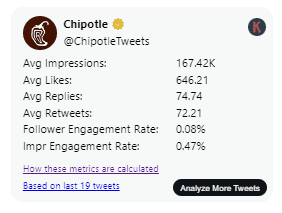
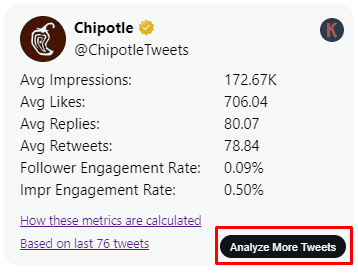
The widget shows us that on average, Chipotle gets 646 likes and 74 replies per post. Besides the replies and likes, the widget also shows the follower engagement rate, impression engagement rate, average retweets, and average impressions.
Sometimes, you might come to a page, and Keywords Everywhere would not have analyzed its metrics. You’ll see something like this.
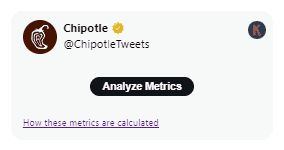
Simply click the ”Analyze Metrics” button, and the tool will begin analyzing the loaded tweets.
Step 2: Analyze More Tweets
As you can see above, the widget says that the results are based on the last 19 tweets. That’s because Keywords Everywhere bases these results on the top tweets that load when you land on an X page.
As you scroll down, the results will change.
So, to get a better idea of the overall engagement metrics for Chipotle’s Twitter page, we can scroll down their X page.
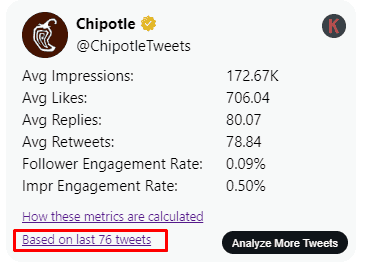
Now, when you look at the widget again, the results have changed because the tool has accounted for the newly loaded tweets, too. The results are based on 76 tweets now.
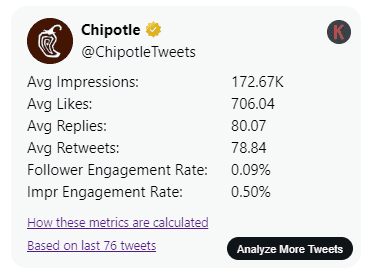
The average likes have increased to 706 per post, while the per post comments have increased to 80.
The increase in engagement metrics shows that the brand is consistently posting high-performing content and engaging its audience effectively.
This is a great example for small businesses to follow and learn from.
You don’t necessarily have to load new tweets to get a better sense of the engagement metrics. Instead, you can simply click the ”Analyze more tweets” option on the widget, and it will load more tweets for a wider analysis.
Step 3: Review the Tweets
Keywords Everywhere doesn’t take all tweets into consideration. It ignores the pinned tweets and tweets without impression metrics.
In some cases, the tool also ignores some outlier tweets, such as viral tweets with unusually high engagement rates.
It’s always a good idea to review the tweets being analyzed to get a better sense of the overall engagement metrics. To do that, click the ”Based on last ”x” tweets” to open a new page with a list of all the tweets the tool has analyzed.
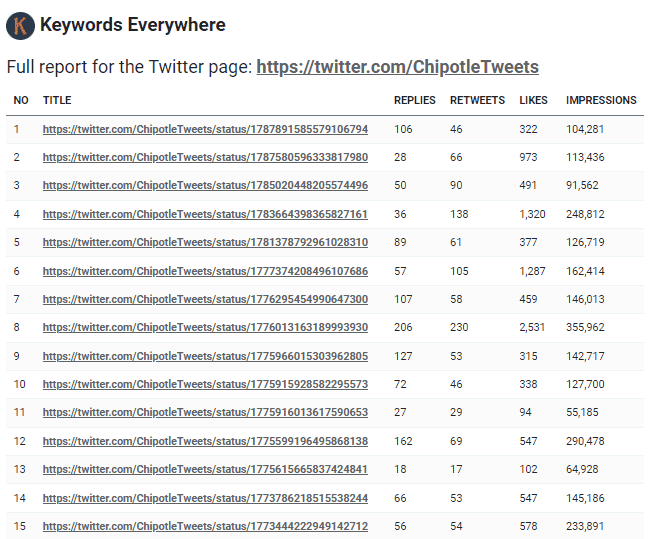
Step 4: Analyze the Table
The table will show you the following columns:
- Title: The title provides the link to the analyzed tweet.
- Replies: It shows the number of replies.
- Retweets: This column displays the number of retweets.
- Likes: The number of likes for each tweet is shown in this column.
- Impressions: The last column shows the total impression metric for each tweet. An ”impression” refers to the number of times a tweet is seen by users.
If you want to see which tweets the tool has ignored, simply scroll down the table. The ignored tweets will be highlighted.
Also, they will have ”ignored” written in front of them.
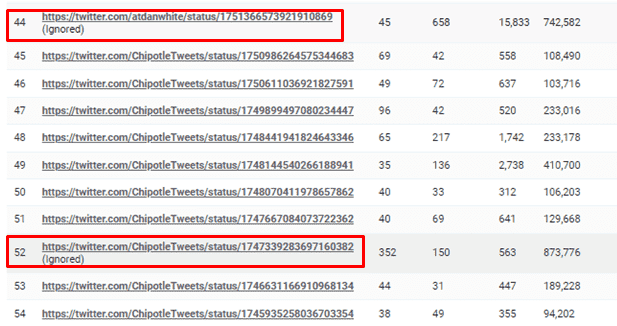
In our example, Keywords Everywhere has ignored two tweets. One of them has 45 replies and 15,833 likes.
If you want to view each tweet individually, you can click on the link in the title column.
Step 5: Export the Data
You can copy the whole table to an Excel sheet or Google Sheets for further analysis.
How Does Keywords Everywhere Measure Twitter Engagement Metrics?
When you come across a tweet on X, it will have the following data points.
- Impressions
- Likes
- Replies
- Retweets
You can see all these icons under this tweet on Chipotle’s X page.
Keywords Everywhere calculates the average for all these data points and displays them in the widget.
The other two metrics are calculated as follows:
- Impression Engagement Rate: Keywords Everywhere measures the impression engagement rate as the average number of engagements on an X page divided by the average impressions. The value is shown as a percentage, and it tells you what percentage of people who look at a page’s tweets actually interact with them.
- Follower Engagement Rate: The follower engagement rate is calculated as the average number of engagements on an X page divided by the number of followers that page has. Again, it’s a percentage. It tells you the percentage of a page’s followers that are engaging with its tweets.
But what about the ignored tweets?
Keywords Everywhere ignores the following tweets:
- Pinned Tweets: Since these tweets are on the top of the page, they receive more impressions and engagements, which can skew the overall average.
- Retweets: Reposts or retweets by other users are not included in the calculations as they do not directly reflect the engagement of a particular tweet.
- Tweets Without Impressions: X launched the impressions metric in December 2022. Tweets older than this date will not have an impression count and, therefore, will be excluded from the calculations.
- Outlier Tweets: Sometimes, an account that doesn’t normally have a lot of engagement may have one tweet that goes viral and receives an unusually high number of engagements. These outlier tweets are also excluded from the calculations to provide a more accurate representation of a page’s engagement rate.
Why Measure Twitter Engagement Metrics?
X has always been the platform where all the discourse happens. It’s where rumors are spread, where news is shared, and where opinions are voiced.
So, it makes sense to measure the engagement rates on this platform. It helps you understand how much your tweets are resonating with your audience and can also give you insights into what type of content performs well.
Let’s look at some reasons why measuring Twitter engagement metrics is important.
Self Performance Analysis
Every once in a while, it’s imperative to look back and evaluate your own performance, especially on a platform like X, where trends come and go quickly.
With Keywords Everywhere’s X engagement metrics widget, you can see how well your account is performing. It also gives you an insight into which of your particular tweets are doing exceptionally well.
Let’s say you notice that your tweets are getting hundreds of impressions, but only four or five comments and around 40 likes. It means your posts lack something that would encourage the viewers to engage.
You can tackle this by running polls or sharing relatable content.
Similarly, if your posts are not getting enough reposts, maybe they’re just not shareable. You can improve their shareability by making them informative, entertaining, relatable, or funny.
Competitor Analysis
Of course, the primary use case for measuring X engagement metrics is to gauge your own performance. But it’s also a great way to keep an eye on your competitors.
If one or more of your competitors are doing better than you on X, you should take a leaf out of their book and see what strategies are working for them.
Use the Keywords Everywhere widget to see how many comments and likes their tweets are averaging.
Content Improvement
Since X has a limited character count (unless you have a Premium account), you have a limited scope to get your message across.
But with the right content, you can still pack a punch.
A look at your X engagement metrics can show you which of your content tends to do well. For example, your audience may be engaging more with your tweets that include visuals or hashtags.
These insights help you curate your content in a way that your audience likes best.
You can also apply the same to your competitors if you want to learn from their content strategy. For example, if you look at Chipotle’s X account, most of their tweets are relatable, humorous, and based on viral challenges, trends, memes, and promotions.

On the other hand, the Royal Academy posts mostly about its exhibitions and educational programs. Both brands have a strong presence on X, but they cater to different audiences and use different content strategies.

You can study your competitors’ X engagement metrics to identify patterns and then apply them to your content strategy.
Conclusion
Keywords Everywhere Twitter (X) engagement metrics widget lets you analyze X pages on the go. You no longer have to export the data to a third-party tool to see how your X accounts are performing.
Simply turn the extension on and view the metrics for every X page you visit. You can analyze as many or as little posts you want.
Use the tool to optimize your X strategy, be it getting content-related insights or identifying the verticals where your competitors are taking the lead.