New Twitter Metrics Widget
You've mostly reached this page after seeing a new widget popup on your Twitter profile page.
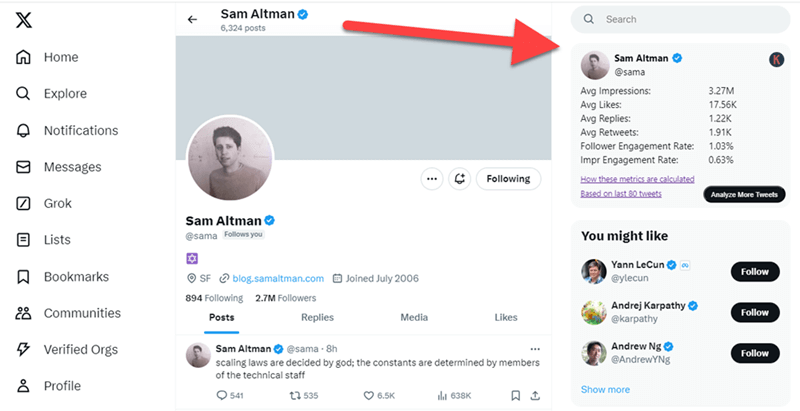
A new widget shows up on the right hand top of every twitter profile
This article will try and explain what this feature is, how we calculate these metrics, and how you can use them.
How does it work?
When you visit any profile on Twitter this widget will automatically show up at the top right-hand corner. It analyzes the tweets shown on the page, gathers data on them, and calculates engagement metrics.
This widget shows engagement metrics for Twitter profiles.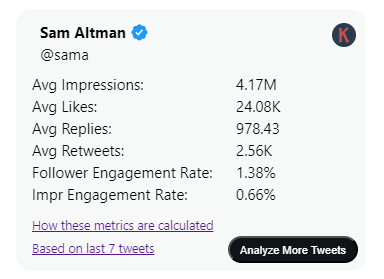
If there are not enough tweets to analyze, then no metrics are shown. Instead, you will see a button to Analyze metrics as shown in the screenshot below.
A new "Analyze Metrics" button is shown for profiles where data could not be automaticlly gathered.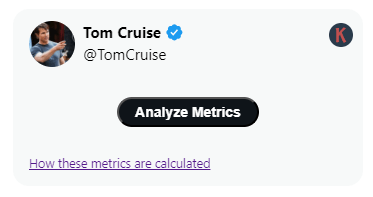
Clicking this button will cause your page to scroll down, load more tweets, and then will scroll back up to the widget. The widget will now show metrics if it can get more tweets.
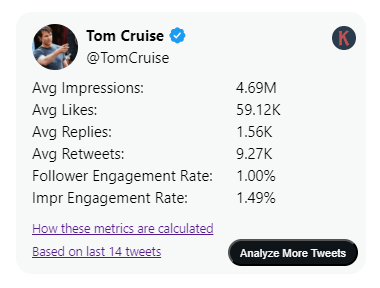
Metrics are now shown with an option to analyze more tweets
The metrics are based on the tweets shown to you. You can click the "Analyze More Tweets" anytime to analyze more tweets. The more tweets you analyze the more accurate the metrics
What is the source of the data?
The extension reads the following data directly from the tweets shown on the page.
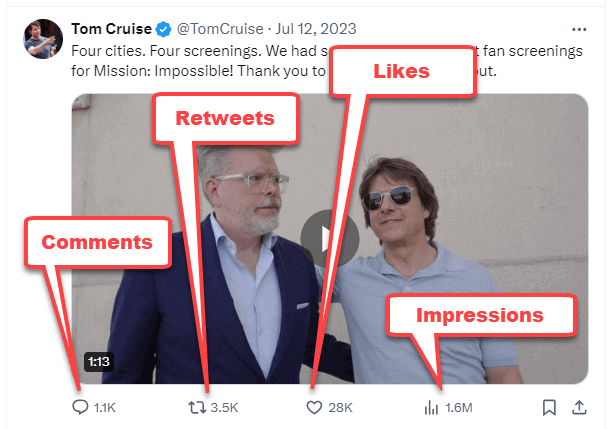
Location of the datapoints collected from the tweets
How are the metrics calculated?
Once the extension gets all the data points from the tweets, it calculates the average numbers for each of the above data points.
Average Impressions
Average Likes
Average Replies
Average Retweets
The Follower Engagement Rate is calculated as the average number of engagements divided by the total number of followers and is shown as a percentage. This basically tells you what percentage of their followers actually engage with their tweets
The Impression Engagement Rate is calculated as the average number of engagements divided by the average number of impressions and is shown as a percentage. This basically tells you what percentage of people who view their tweets engage with them
How accurate is this data?
The data comes directly from Twitter, so is as accurate as possible. The quality of data significantly improves as you analyze more tweets.
We also ignore some tweets to ensure that you are getting metrics from the best data possible. Below are the tweets that get ignore from the timeline
| Tweet Type | Reason for ignoring |
|---|---|
| Pinned Tweets | Pinned tweets get a lot more engagement than normal tweets as they stay at the top of the users timeline for long periods |
| Reposted/Retweets | Retweets get their datapoints from the tweet posted by someone else and so this tweet's metrics should not be attributed to account retweeting it |
| Tweets without Impression Metric | Since the impression metric was launched in Dec 2022. So older tweets do not have this metric and are ignored. |
| Outlier Tweet | Sometimes an account ends up with "once in a blue moon" viral tweet. This can skew their metrics considerably, so the tweet with the maximum impressions gets ignored. |
How do I verify your calculations?
Each widget displays a link that says "Based on last x tweets", where x is the number of tweets that were analyzed.
When you click on this link, a new page opens up with a list of all the tweets, along with their individual data points.
Ignored tweets are suffixed by the word "Ignored" so that you can see which tweets were ignored and which ones were used in the calculations.
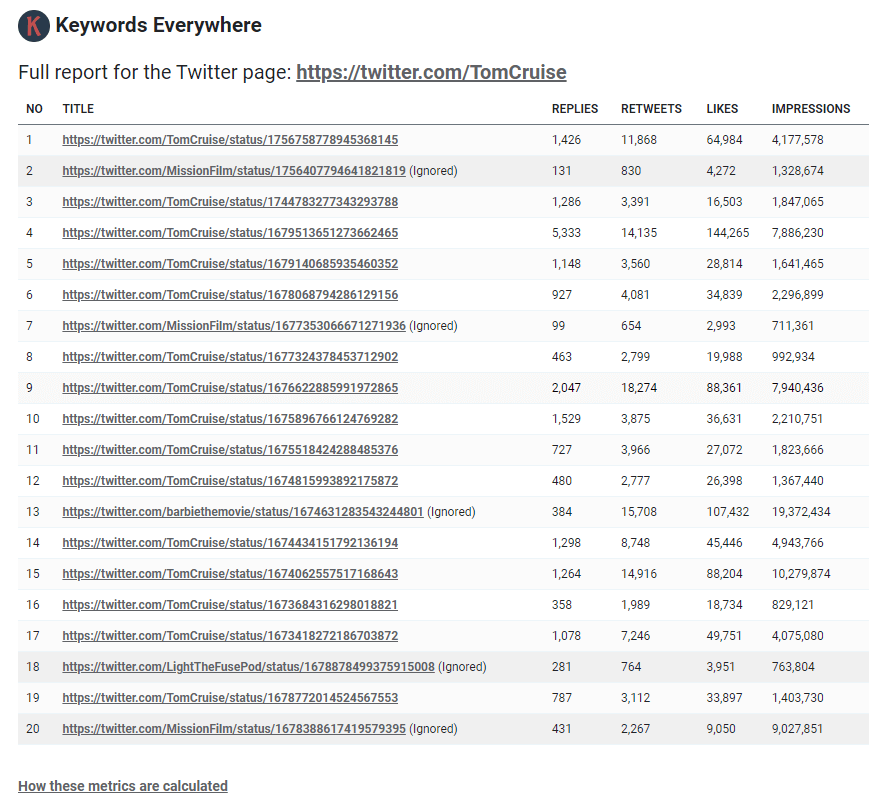
A complete breakdown of all the datapoints and calculations
Frequently Asked Questions
Q: Why do I see slightly different values on different browsers/machines?
A: These metrics are calculated in real time using the tweets that are served to you. Since the data points update in realtime, you will naturally find small deviations. However, if you analyze a large enough number of tweets, the numbers should always be close enough
Q: I have some more questions on this feature. What do I do?
A: Please email us at help@keywordseverywhere.com