The adage ”content is king” has never been more relevant than in today’s digital age. We’ve got AI tools churning out hundreds of words in seconds and a never-ending stream of social media posts.
Amidst all this noise, high-quality content marketing emerges as the best way to grab and hold attention. A slight difference is that content, which was previously predominantly textual, is now more visual and interactive.
However, to make the kind of content that works, you should know about what’s currently hip in the digital marketing landscape. Below, we have a list of content marketing stats you should keep in mind for your strategy in 2025 and beyond.


What Is Content Marketing?
Simply put, content marketing is the process of creating and using content to market your brand or offering. The content can manifest in different formats, including but not limited to:
- Blog posts
- Social media posts
- Videos
- Infographics
- White papers
- E-books
- Webinars
- Interactive content
- Podcasts
Nowadays, marketers create a variety of content to keep their audiences engaged. The content is then published on an array of platforms, ranging from brand websites and social media to other publications, like brochures, newsletters, reports, and press releases.
68 Top Content Marketing Stats Every Marketer Should Know
For your convenience, we’ve taken the time to look through hundreds of reports and articles to get you the most relevant, up-to-date content marketing stats. We have also categorized these figures into different sections so you can pinpoint the information that matters to your strategy.
General Content Marketing Stats
First, let’s look at the overall numbers that will give us a general understanding of the state of content marketing.
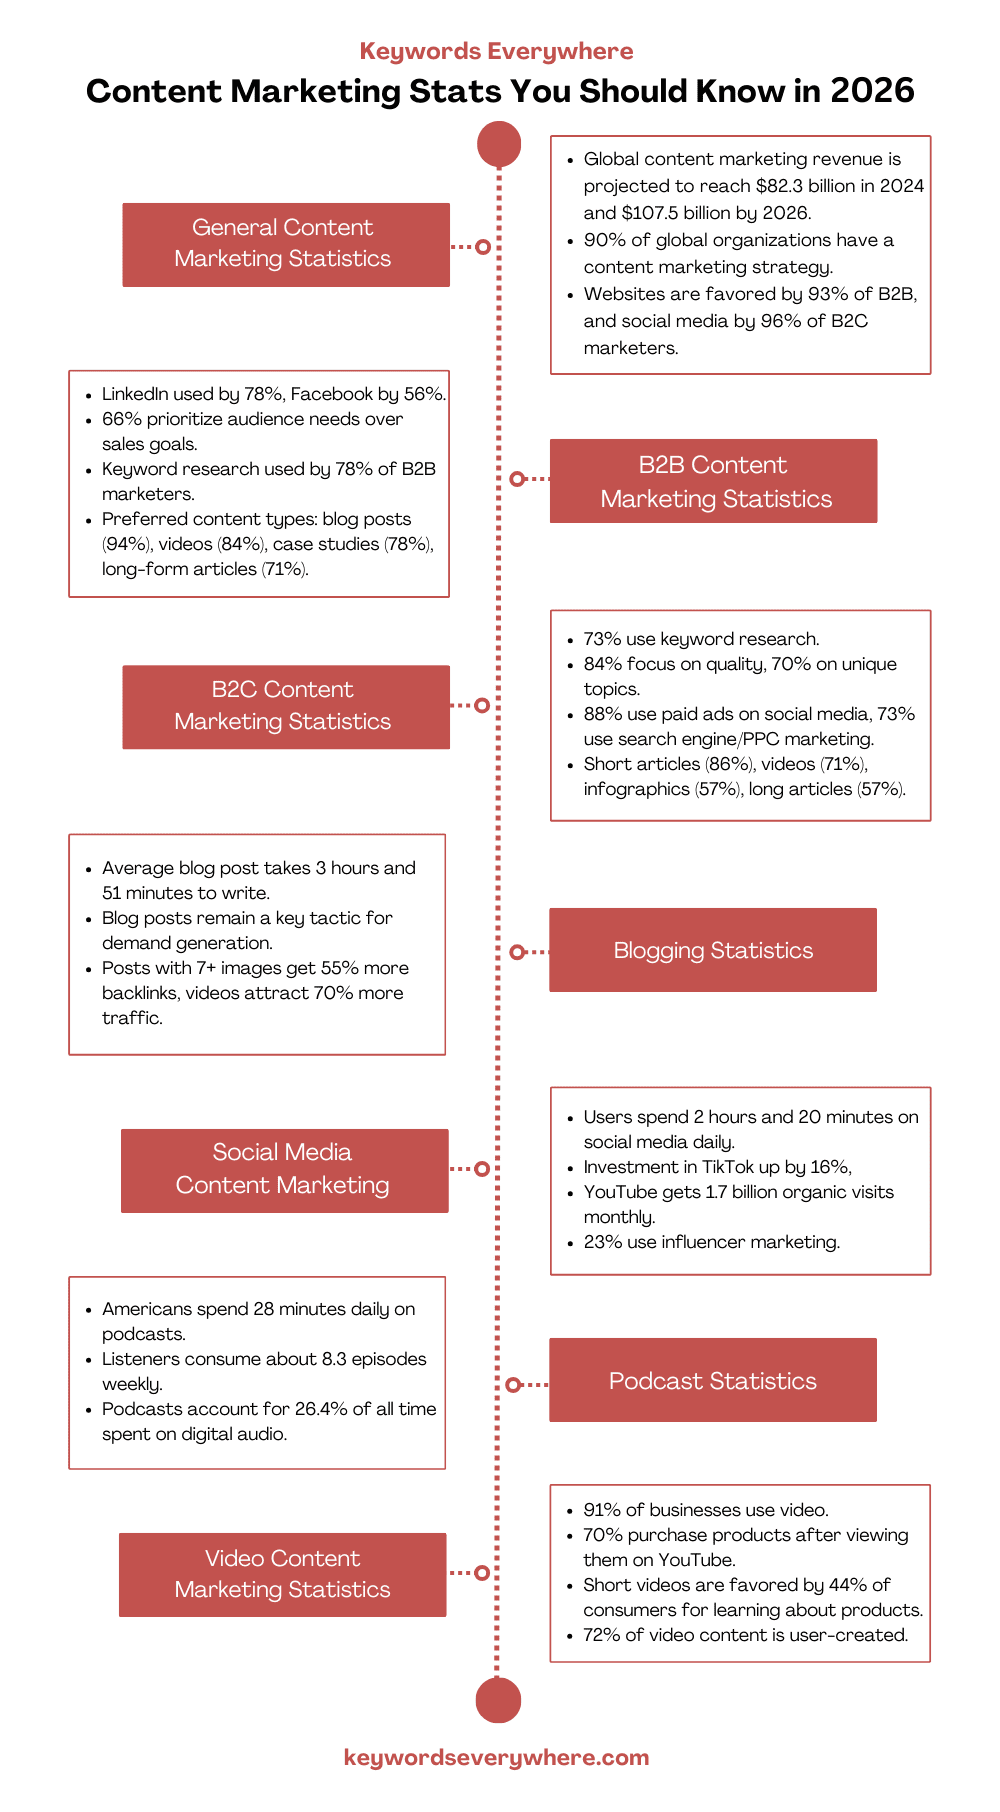
1. The overall content marketing revenue worldwide is expected to reach $82.3 billion in 2024 and $107.5 billion by 2026.
2. 90% of the organizations across the globe have a content marketing strategy.
3. The leading goal of using content marketing is brand awareness.
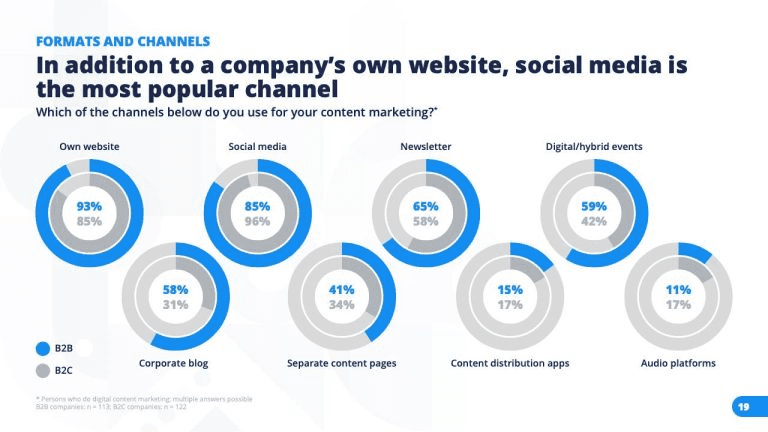
4. While 93% of B2B businesses believe their own website is the most popular channel for content marketing, 85% of B2C businesses agree.
Source
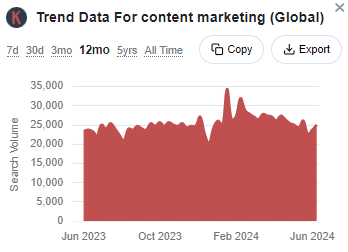
5. Keywords Everywhere data shows that the trend data for ”content marketing” has remained consistently high over the past year, indicating the evergreen demand for content marketing as a strategy.
6. The second most popular channel for content marketing is social media, used by 85% of B2B marketers and 96% of B2C marketers.
7. In 2024, 69% of marketers plan to invest in video content marketing, while 21% plan to invest in digital events, compared to 47% in in-person events.
8. In a survey, 18% of marketers said they sold ad spaces to monetize their content, while 14% reported creating subscription models and content paywalls to do the same.
9. In a 2023 survey, 43% of marketers said they would increase their content marketing spending in the next year. Of these, 13% plan to increase the budget by over 9%.
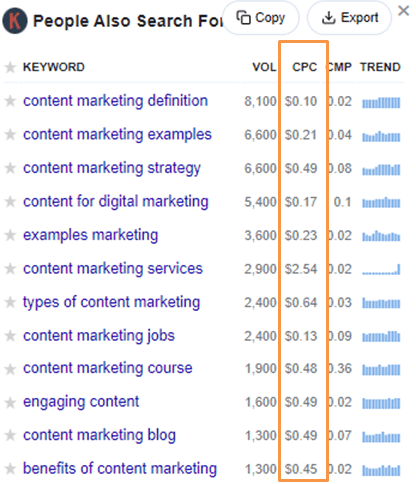
10. The cost-per-click (CPC) for keywords related to content marketing is generally above $0.10, as per the Keywords Everywhere widget, exhibiting a high competition for ad placement.
11. 71% of marketers report that the importance of content marketing has increased for them compared to previous years.
B2B Content Marketing Stats
B2B marketers market to other businesses instead of targeting individual consumers. Their approach is comparatively different since they have to convince multiple stakeholders and create long-term business relationships.
Here are some statistics related to B2B content marketing.
12. The top social media platforms used by B2B marketers for content marketing are LinkedIn and Facebook. While 78% of marketers use LinkedIn, 56% use Facebook.
13. 40% of B2B marketers have a document content marketing strategy, with the percentage increasing to 64% among the most successful marketers.
14. 66% of B2B marketers prioritize their audience’s needs over sales goals when they create content.
15. 78% of B2B marketers use keyword research when creating content.
16. The leading content types used by B2B marketers are blog posts (94%), pre-produced videos (84%), case studies (78%), and long-form articles (71%).
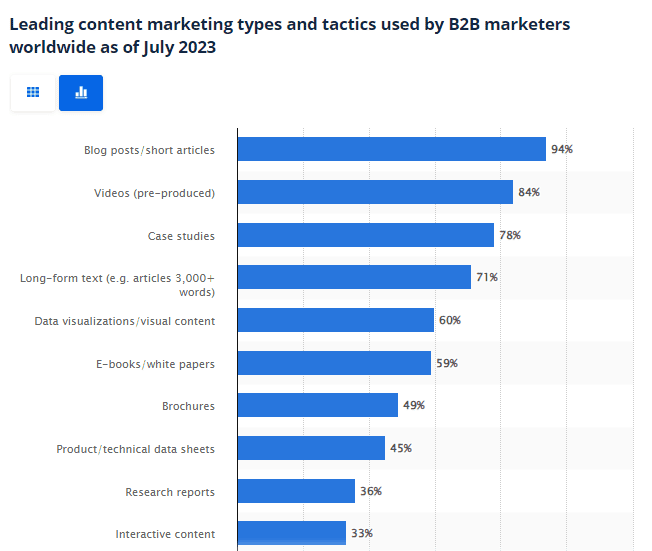
Source
B2C Content Marketing Stats
In B2C content marketing, the content is made keeping the end-user in mind. The goal is to create brand awareness and drive sales directly to consumers. Let’s take a look at some B2C content marketing stats below.
17. 73% of B2C marketers use keyword research for content creation.
18. B2C content results in 9.7 times more shares compared to its B2B counterpart.
19. B2C marketers differentiate their content from their competitors by creating better quality content (84%) and covering topics their competitors haven’t covered (70%).
20. Social media paid ads are used by 88% of B2C marketers as a part of their content marketing strategy, while 73% use search engine or pay-per-click marketing.
21. 45% of B2C marketers report that they will hire contractors for content production, such as writers, photographers, videographers, and designers.
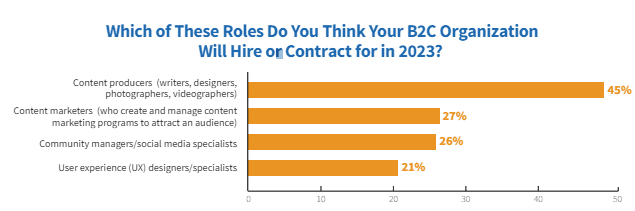
Source
22. In terms of content creation, 86% of B2C marketers have created short articles (under 1,500 words), 71% have created videos, 57% have created infographics and charts, and 57% have created long articles.
Blogging Stats
Blogging is one of the most conventional and effective forms of content marketing. It allows businesses to establish themselves as thought leaders in their industry and exhibit their expertise to potential customers.
Here are some statistics that highlight the importance and impact of blogging in content marketing.
23. 80% of bloggers report driving results even in today’s competitive content market space and shift toward video content. However, 49% of bloggers struggle to get readers to engage with their content, while 46% have a hard time attracting visitors from social media.
24. On average, it takes 3 hours 51 minutes to write a blog post. That’s much higher than the 2 hours and 24 minutes it took in 2014. The higher time is likely due to the increased competition and higher quality expectations from readers.
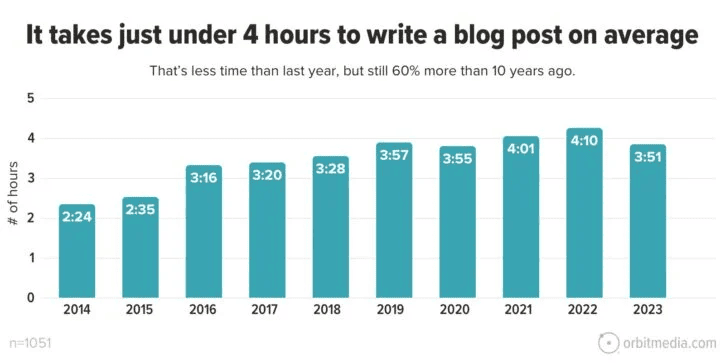
Source
25. Blog posts are the most commonly used content type by content marketers for demand generation.
26. According to Semrush, blog posts with more than 7 images got 55% more backlinks than blog posts without them.
27. 70% more traffic goes to articles that have at least one video in them compared to those with no videos.
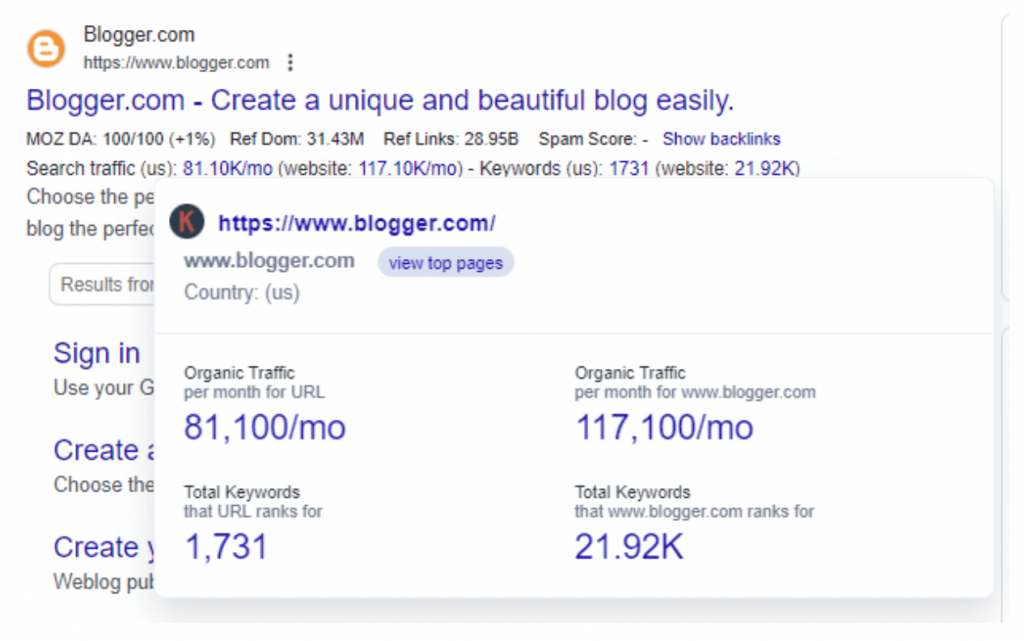
28. Blogger.com, the platform used by the majority of bloggers, gets 117,100 organic visitors per month, according to Keywords Everywhere.
29. While 24% of bloggers post per week, 23% post several posts per month. Only 3% of bloggers post daily.
30. About 80% of marketers and small business owners write content themselves, while 17% hire in-house writers. A mere 14% hire freelancers.
Social Media Content Marketing Stats
Social media acts as a bridge between brands and customers. There was a time when social media was only used for personal interactions, but as of today, many consumers rely on social media to make purchase decisions.
Let’s learn more through these statistics.
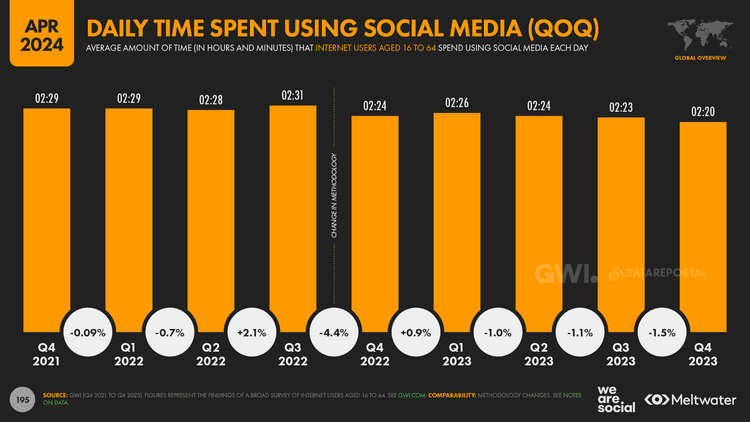
31. Global users spend 2 hours and 20 minutes on social media platforms every day.
Source
32. 52% of businesses say the main hurdle in their social media activities is the time or budget investment requirement to maintain their presence on multiple platforms.
33. The use of Facebook for content marketing has declined, with more focus on short-form video platforms.
34. On average, social media users login to 7 platforms per month.
35. 50% of marketers plan to increase their social media selling investments.
36. Brands have increased their investment in TikTok’s content strategy by 16%, with an increase of 5% on Instagram. On the other hand, investments have decreased by 7% in X and 11% in Pinterest.
37. YouTube was the third-most searched term on Google in 2023.
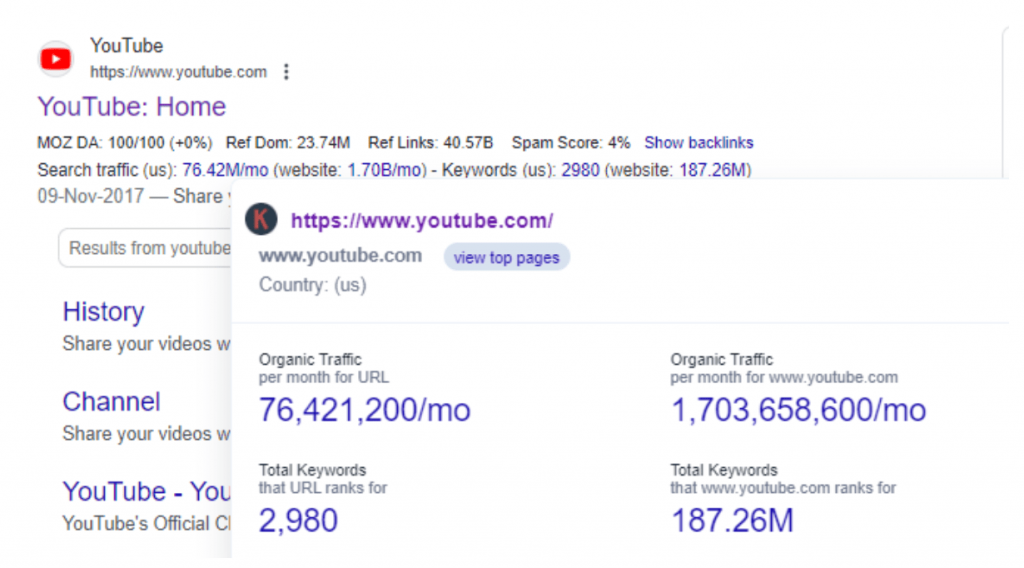
38. Keywords Everywhere data shows that YouTube ranks for 287.2 million keywords. Also, the platform gets over 1,700,000,000 organic visits per month.
39. 23% of marketers leverage influencer marketing to create content for social media.
40. 34% of customers think that too much self-promotion for brands is a turn-off, and 56% of them say that brands should attempt to be more relatable on social media.
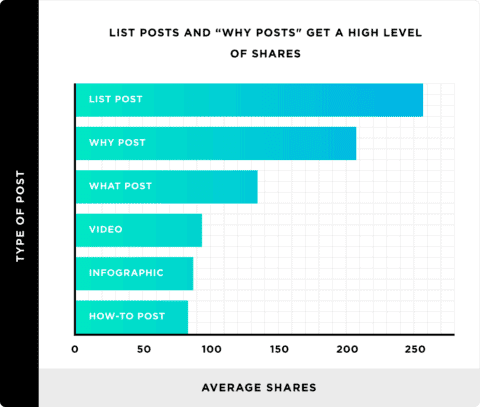
41. List posts get the most shares on social media, with Why and What posts in second and third places.
Source
42. The ideal content length for maximizing shares on social media is between 1,000 and 2,000 words.
Podcast Stats
Although relatively new, podcasts have become an increasingly popular form of content marketing. Marketers can use podcasts to reach a targeted audience and establish industry expertise. Here are some statistics related to the growing popularity of podcasts in content marketing.
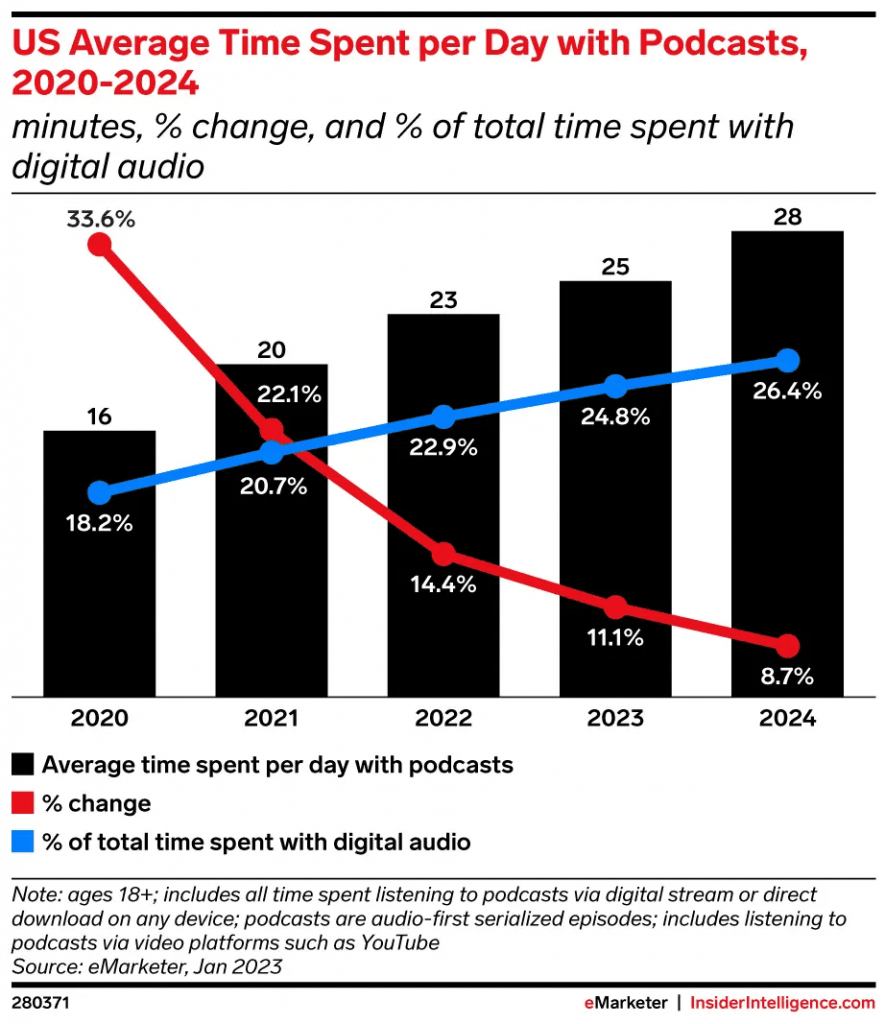
43. US users spend 28 minutes per day, on average, listening to podcasts.
Source
44. Nearly 55% of US individuals aged over 12 listen to podcasts. That translates to 135 million listeners in the country.
45. On average, podcast listeners listen to 8.3 episodes per week.
46. 26.4% of all time spent with digital audio goes to podcasts.
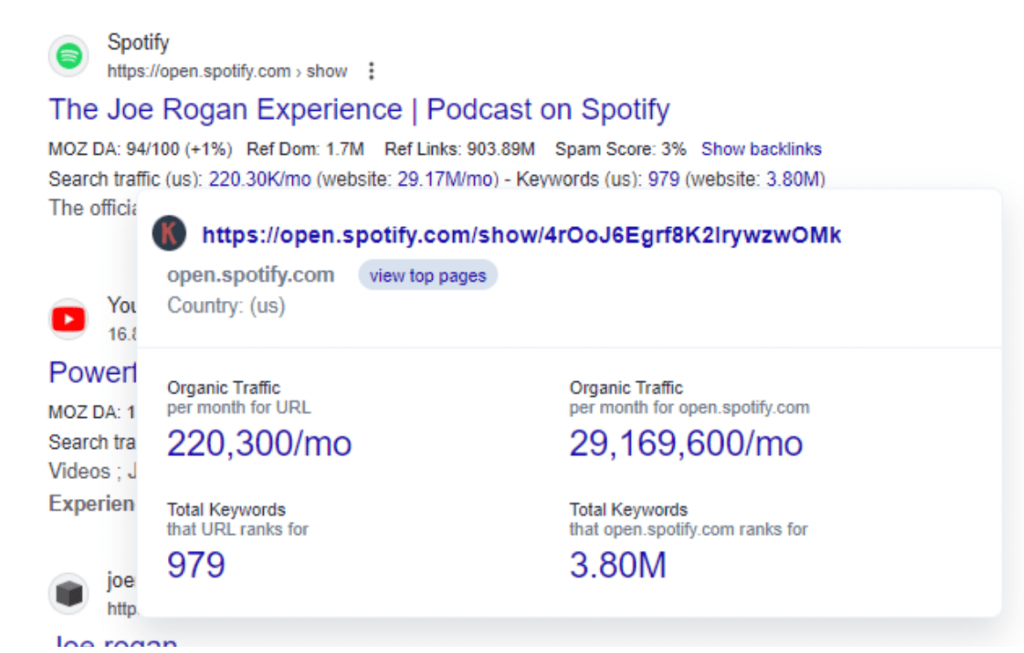
47. The Joe Rogan Experience is the most popular podcast on Spotify, getting 220,300 organic visits every month through Google.
48. iHeartPodcasts is the leading podcast publisher in the whole world.
49. By October 2023, 178 million podcast episodes had been created.
50. Podcast listening has tripled in the US in the past decade, reaching 42% in 2023.
Video Content Marketing Stats
Video content is everywhere these days. From Reels to TikTok to YouTube, it’s clear that video is a highly popular form of content. The following statistics will tell you more about the use and importance of video content marketing.
51. Video has been the most created type of content four years in a row, per HubSpot’s report.
52. 70% of people buy a product after they see it on YouTube.
53. 91% of businesses use video in their content marketing strategy, showing the high importance and effectiveness of video content.
54. 47% of companies invest in product demo videos, 35% create explainer videos, and 33% record webinar videos.
55. Over 50% of marketers use social media videos, while 59% use how-to videos to promote their brands and products.
56. The highest number of videos are created by finance brands. These companies make 934 videos on average, compared to high-tech brands that make 917 videos per year. Other big video-creating industries are manufacturing, professional services, real estate, and healthcare.
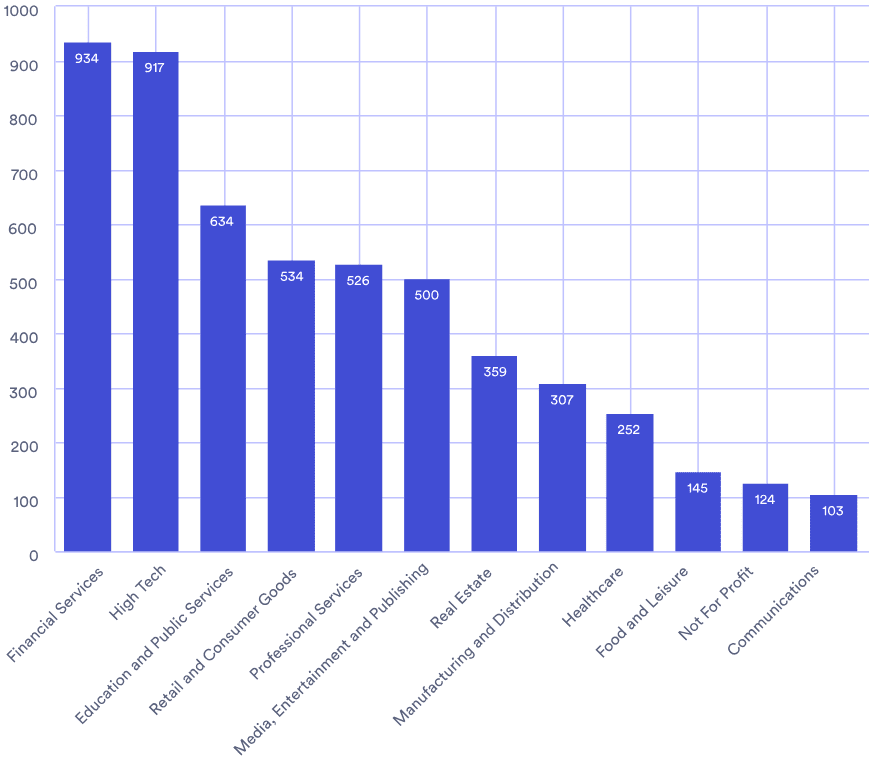
Source
57. According to 44% of consumers, short videos are their favorite way to learn about a brand’s product or service. So, it is not surprising that short-form video platforms like Instagram Reels and TikTok are gaining immense popularity among brands for promoting their content.
58. 87% of marketers report an increase in web traffic by using video content in their marketing strategies. Such a high percentage is a testament to the power of video in driving user engagement and website traffic.
59. 72% of videos are created by users, which means that user-generated content (UGC) should be a part of your video marketing strategy.
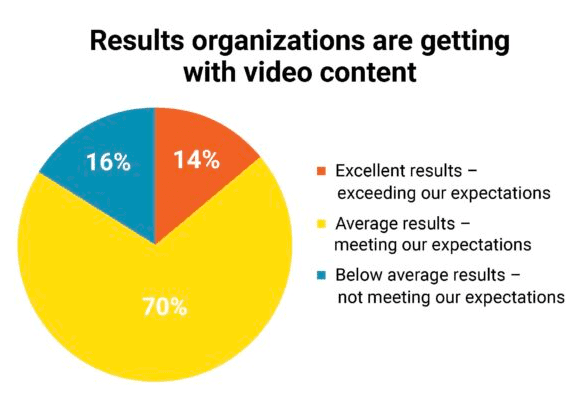
60. 70% of marketers say that video content meets their expectations, while 14% say that it exceeds their expectations.
Source
61. 24% of bloggers put videos in their articles since they help increase engagement and time spent on the page. In fact, 34% of bloggers say that adding video to their content gives them strong results.
AI Use in Content Marketing
With AI being as big as it is, we have to mention some statistics related to its role in content marketing. Many businesses have already jumped on the AI bandwagon and are using it to optimize their content strategies.
The ones who are skeptical also plan to incorporate AI soon. Some common use cases of AI in content marketing include content creation, editing, brainstorming, and distribution. Here are some content marketing stats related to AI use in the field.
62. Marketers use AI for various purposes in terms of blogging. The majority of bloggers (43%) use it to generate ideas, 29% use it for writing headlines, and 28% create outlines with AI.
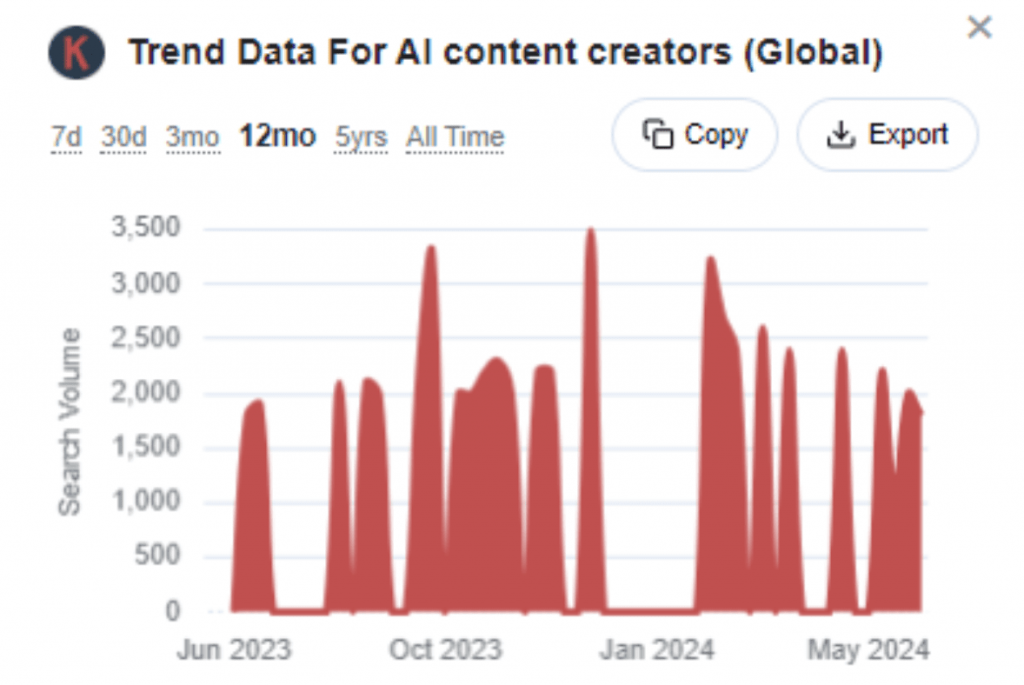
63. Keywords Everywhere shows that the trend for organic searches around AI content creators has spiked in the past 12 months.
64. Almost half of marketers believe that the inadequate use of AI is keeping them from meeting their marketing goals.
65. 58% of the marketers in the US report that their content marketing performance has improved because of generative AI.
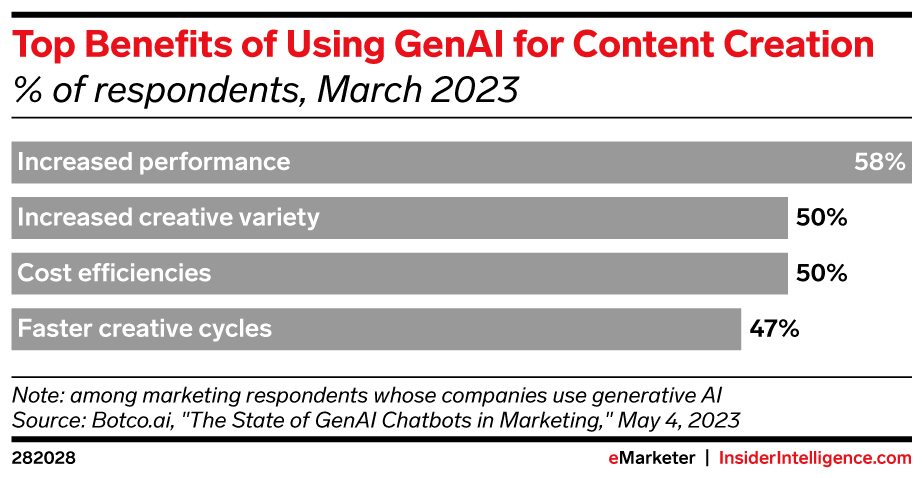
Source
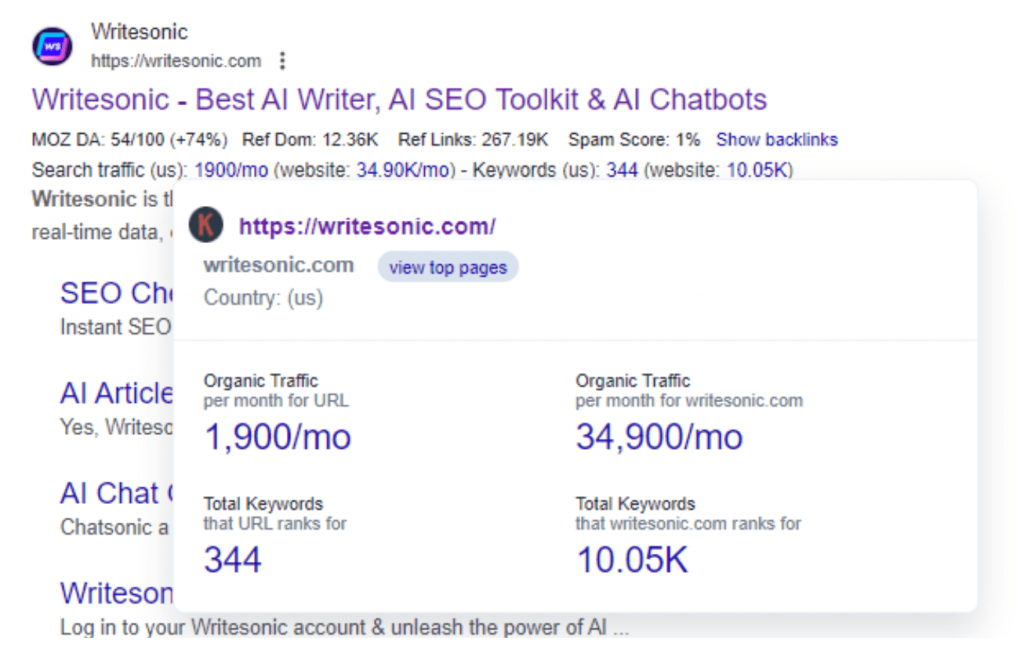
66. Keywords Everywhere data reveals that one of the top AI content writers, Writesonic, gets 34,900 organic searches per month.
67. 77% of marketers say that generative AI helps them create more personalized content.
68. In a HubSpot report, 45% of marketers said that they use AI for ideas and inspiration, while 6% use it to write content.
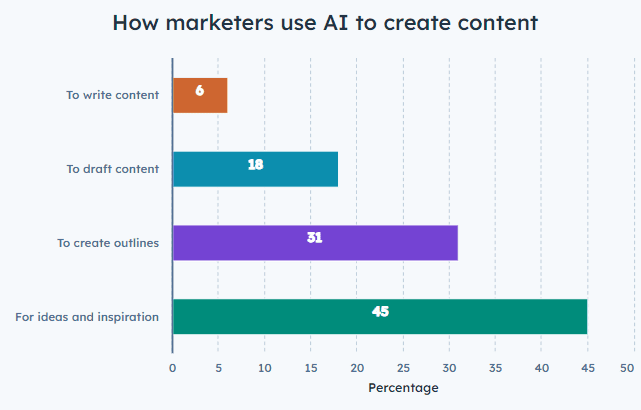
Source
Conclusion
There’s a lot content marketers can learn from this list of content marketing statistics. It’s obvious that AI is making its way into the content marketing world, and companies are starting to see its benefits.
While most users are not leveraging AI for full-fledged content creation, likely due to its current limitations, AI tools are helping with various tasks such as topic and keyword research, content optimization, brainstorming, and creating outlines.
Other trends that seem to be evident are the use of video and the focus on multiple formats of content. Brands can no longer thrive by just creating one type of content; they need to diversify their formats to reach a wider audience and keep up with the changing preferences of users.
Together, these content marketing stats point toward a content-led future for digital marketing. With this exhaustive list of stats, you can prepare yourself to create an effective content marketing strategy for your business.