The holiday season is prime time for businesses since everyone’s in a spending mood, ready to celebrate with enthusiasm. Whether it’s decking the halls or hunting for the perfect gift, people are ready to splurge, making it a golden chance for your brand to stand out.
As the holiday buzz kicks in, understanding key holiday marketing stats becomes crucial. These stats can guide your strategy—helping you tap into consumer behavior and maximize your results.
By knowing what works and what doesn’t, you can create campaigns that truly resonate and drive impressive sales. So dive into these essential holiday marketing stats to set your brand up for success this season!


Top Holiday Marketing Stats
Customers go all out for Christmas, and the numbers back it up. Check out our top holiday marketing stats to help your business shine during the 2025 holiday season.
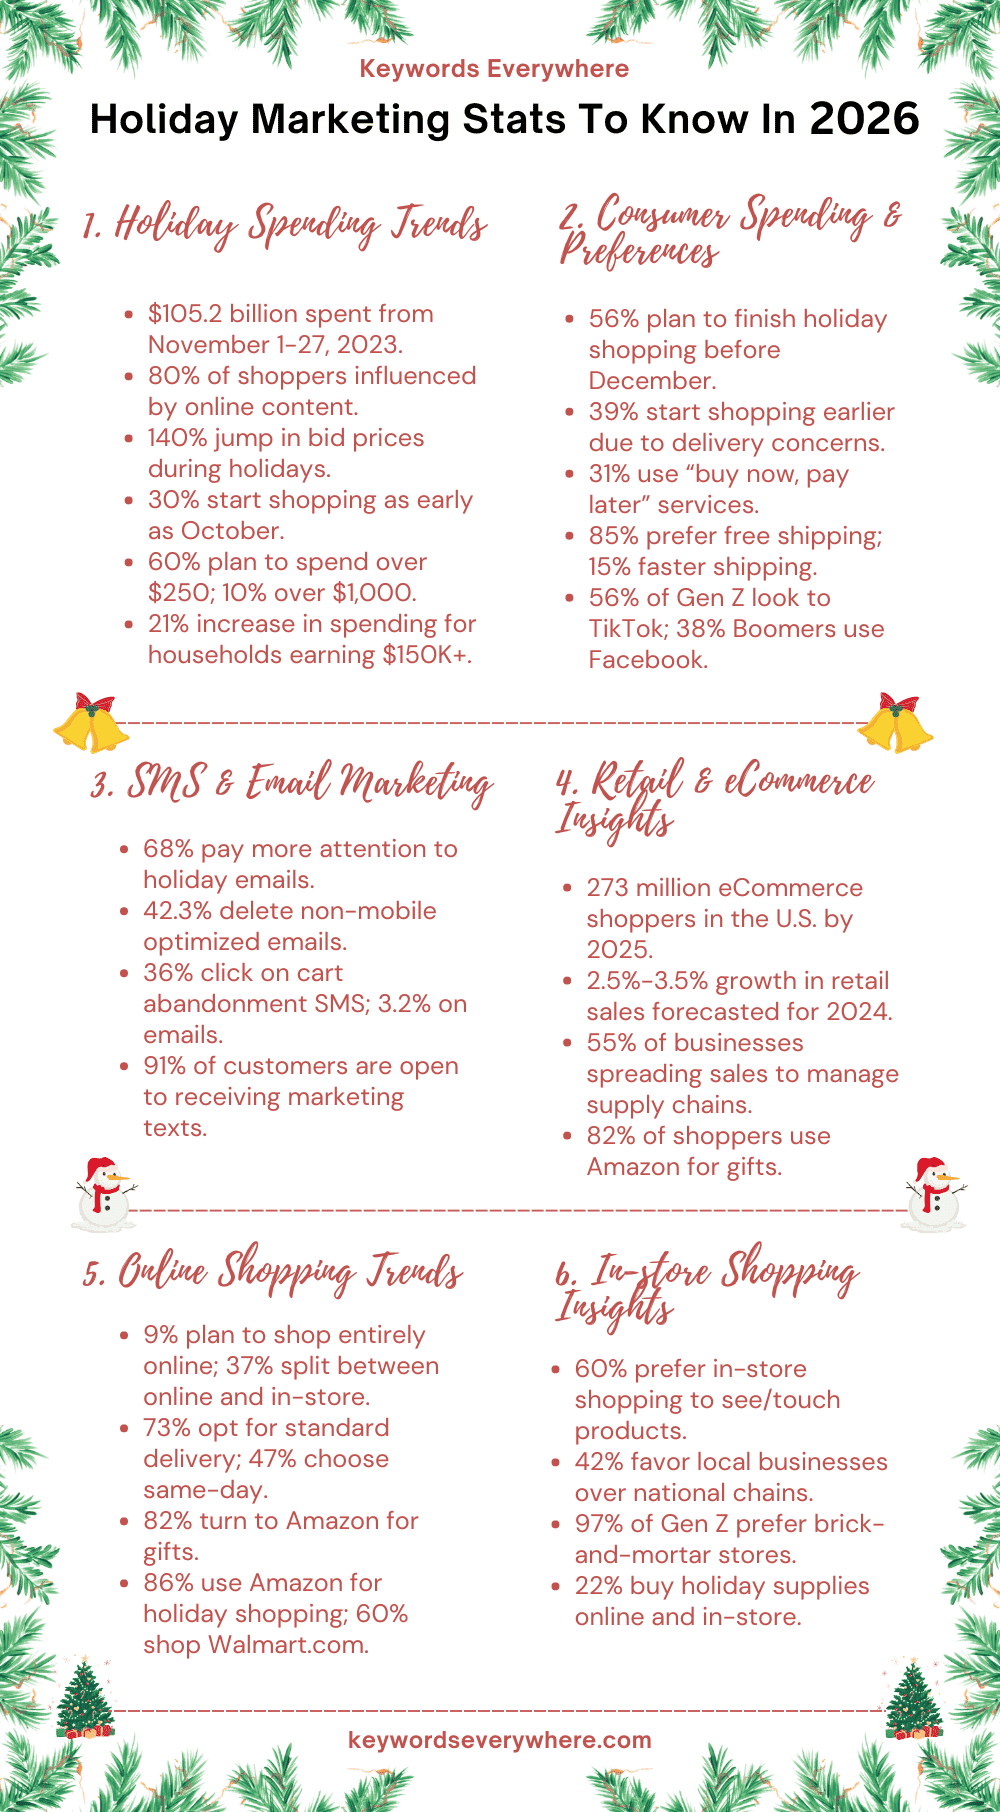
1. Last holiday season, people spent over $105.2 billion between November 1 and 27, 2024.
2. Before buying, 80% of shoppers are influenced by something they see online, usually starting with a keyword search on Google or Bing.
3. During the holidays, bid prices can jump by 140% compared to the rest of the year.
4. About 30% of shoppers begin their holiday shopping as early as October or even earlier.
5. Around 60% of U.S. holiday shoppers plan to spend over $250, with 10% aiming to spend more than $1,000.
6. Households making over $150K are expected to spend 21% more—almost $327 extra—on holiday purchases compared to last year.
Source
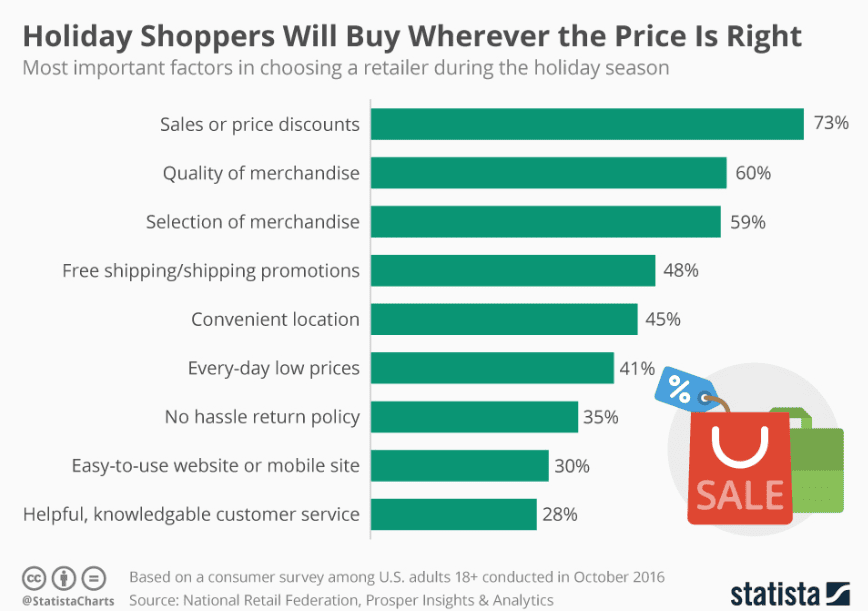
7. The biggest factors in holiday buying decisions are: Price (50%), sales or discounts (22%), free shipping (13%), fast shipping (7%), online pick up in-store (4%), and easy returns (4%).
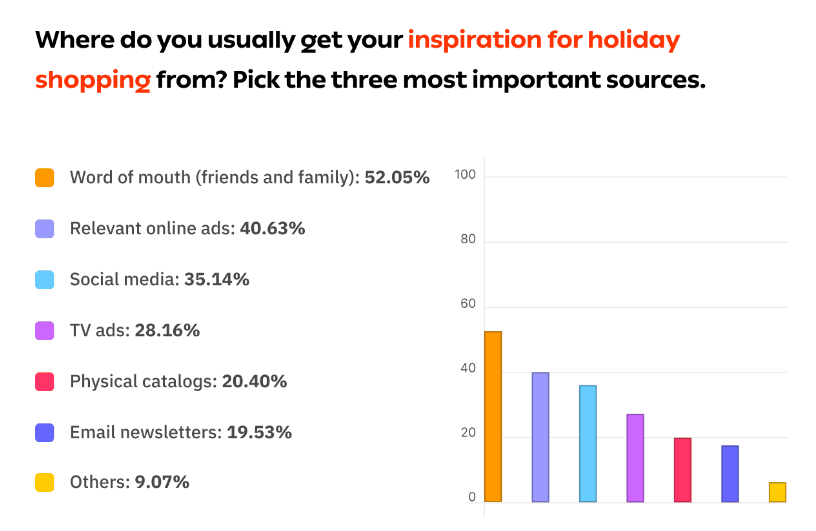
8. Social media also plays an important role in holiday shopping, with 56% of Gen Z looking at TikTok for ideas and 38% of Boomers checking out Facebook.
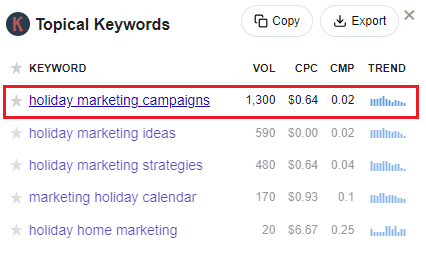
9. According to Keywords Everywhere, the term “Holiday Marketing Campaigns” gets 1,600 searches a month, showing that marketers are focusing more on holiday campaigns to boost sales.
Retail and eCommerce Statistics
eCommerce keeps booming, with millions of people shopping online for the holidays and all year long. By 2025, there will be about 273 million eCommerce shoppers in the U.S.
Retail stores are also thriving, with store numbers rising alongside the industry and economy, despite the growth in eCommerce.
Below we’ve shared some of the key stats on retail and eCommerce:
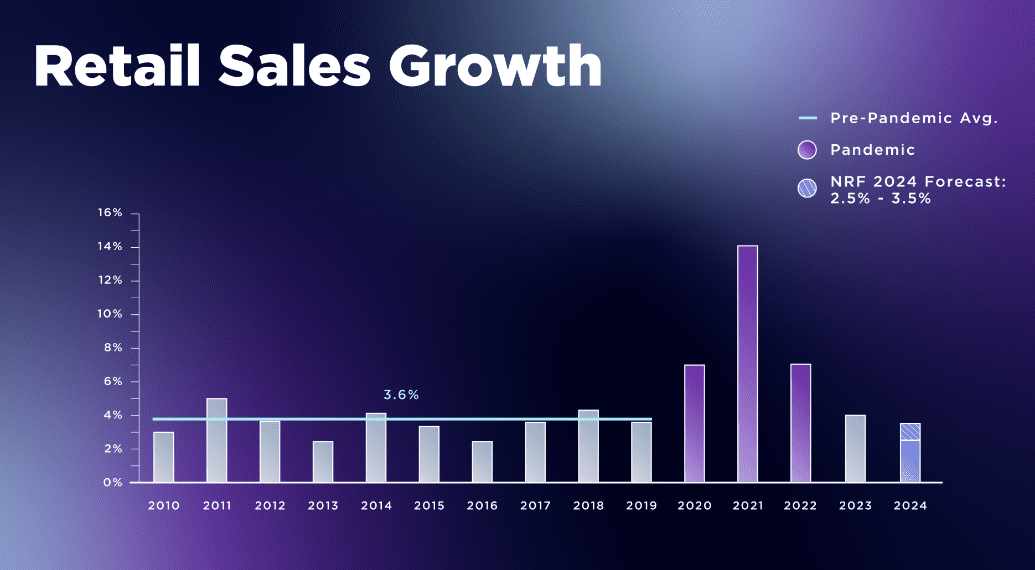
10. NRF predicts that retail sales will grow by 2.5% to 3.5% in 2025, reaching between $5.23 trillion and $5.28 trillion. This is up from last year’s 3.6% growth with sales of $5.1 trillion.
Source
11. Nine out of the top ten e-commerce sites are run by retailers that also have physical stores.
12. The biggest holiday spending will be on gift cards, toys and hobbies, and health and wellness items.
13. To handle supply chain issues, about 55% of businesses are spreading out sales over a longer period, and 53% are starting their marketing campaigns earlier or adding more local and national suppliers.
14. NRF surveys also show that over 50% of retailers now offer or plan to offer ship-from-store services.
15. eCommerce and physical stores work together well. ICSC found that opening a new store can boost web traffic to that retailer’s site by 37% and increase their share of web traffic in the market by 27%.
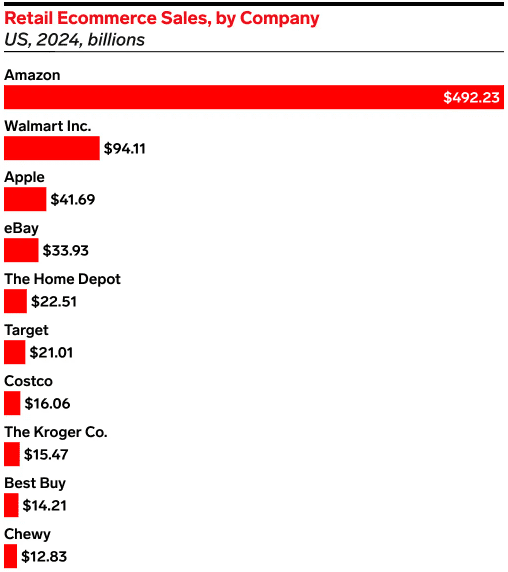
16. Amazon is the biggest eCommerce retailer in the U.S., outpacing the next 15 largest online stores combined. In 2024, Amazon’s U.S. retail eCommerce sales are expected to grow by 10.5%, hitting $491.65 billion, according to eMarketer’s February 2024 forecast.
Source
17. Shoppers are looking for brands with loyalty programs. Research shows that about 46% of shoppers say earning and using loyalty points is the second most important factor in their buying decisions, after price.
18. Salesforce Shopping Index reports that this holiday season—2 out of 5 purchases will be made by loyal repeat customers.
SMS and Email Marketing Statistics
SMS and email marketing are powerful tools for marketers, especially during the holiday season when used correctly. Here are some key holiday marketing stats that show how email and SMS can boost your holiday strategy:
19. A solid 68% of holiday shoppers pay more attention to emails from companies during Christmas.
20. People who buy products through email spend about 138% more than those who just get email offers.
21. About 42.3% of shoppers delete emails that aren’t optimized for mobile devices.
22. Marketing emails give an average return of $36 for every $1 spent.
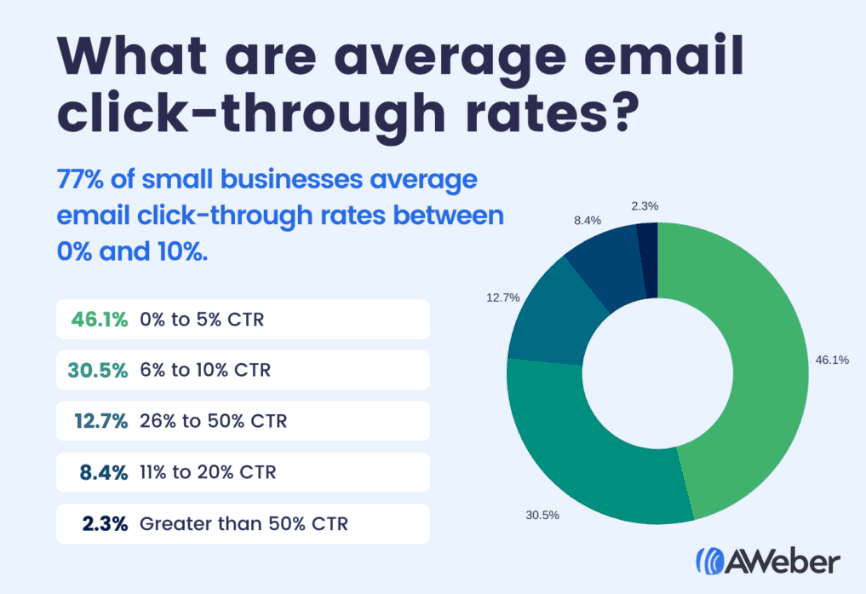
23. 77% of small businesses have email click-through rates ranging from 1% to 10%. However, 61% of small businesses with effective email content see click-through rates of 6% or more.
Source
24. Consumers are more likely to click on cart abandonment SMS messages (36%) than on emails (3.2%).
25. Around 40% of people who click on an automated email end up making a purchase.
26. In the first half of 2023, brands sent 32.8% more scheduled emails, 99.2% more automated emails—and 47.9% more SMS messages compared to the previous year.
27. One in 10 people who received a marketing SMS in early 2023 clicked on it.
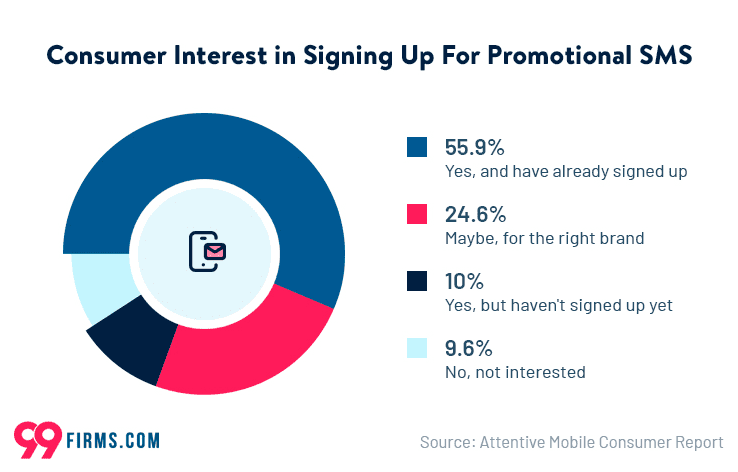
28. A strong 91% of customers are interested in receiving text messages. With such high interest, more companies are likely to put money into text message marketing tools and services.
Source
Consumer Spending and Preferences Statistics
From gift cards and coupons to holiday promotions, there’s a lot for businesses to look forward to this season. Knowing how holiday shoppers spend can help you plan your marketing strategy.
Check out these holiday spending stats that apply to any industry:
29. 56% of shoppers plan to finish their holiday buying before December.
30. 91% admit to making last-minute holiday purchases—with 30% of those happening a week or two before, and 7% doing it on the actual day.
31. Because of worries about long delivery times and supply chain issues, 39% of consumers plan to start their holiday shopping earlier this year.
Source
32. 16% of U.S. consumers have already started buying holiday gifts, according to June 2024 data from CivicScience. 31% of those early shoppers are using “buy now, pay later” services like Affirm, Afterpay, and Splitit.
33. Using “buy now, pay later” can increase average order values by 85%, and 45% of people make purchases with this option that they wouldn’t otherwise buy.
34. Nearly a third (31%) of U.S. adults appreciate “wish list” features, such as saving for later or sharing options, as part of a personalized shopping experience, according to March 2024 data from Bizrate Insights.
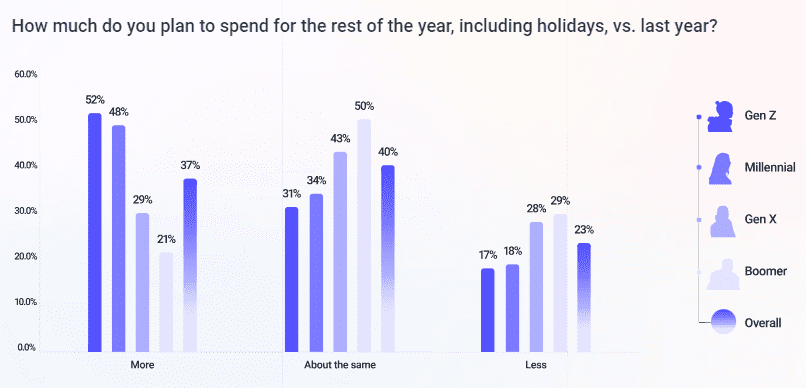
35. Gen Z and millennials are expected to spend the most on holiday shopping this year.
Source
36. 87% of holiday buyers plan to use at least one money-saving strategy so offering competitive prices can give you a big edge.
37. 54% of shoppers enjoy buying online for direct home delivery, and 62% expect their orders to arrive in less than 3 business days.
38. About half of Christmas shoppers prefer brands that practice sustainability.
39. A solid 85% of buyers like free shipping, while only 15% prefer faster shipping.
Source
Online Holiday Shopping Statistics
Online shopping has pretty much become a holiday tradition all on its own. With everyone glued to their screens these days, finding the perfect gifts online has become a huge part of the holiday season.
Here are some of the top holiday marketing stats about online shopping:
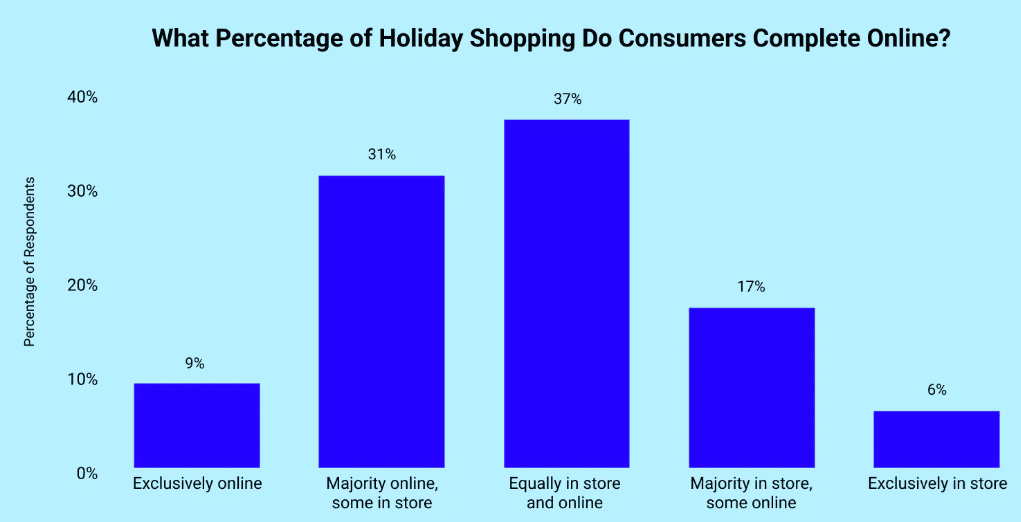
40. Recent survey results reveal that nearly 1 in 10 shoppers (9%) plan to do all their winter shopping online.
41. Another 31% will mostly shop online but will also hit some physical stores, while 37% plan to split their shopping evenly between online and in-store.
Source
42. Nearly 50% of holiday shoppers will choose to have gifts shipped directly to family and friends.
43. For online orders—73% of shoppers will go with standard delivery, while 47% will pick same-day or next-day delivery.
44. 33% of holiday shoppers like the “buy online, pick up in-store” option, and 21% prefer curbside pickup.
45. A whopping 82% of holiday shoppers turn to Amazon for their gifts.
46. According to Keywords Everywhere, there’s a big search spike for terms like “Christmas gifts,” showing that more people are hunting for gifts online.
47. A September 2022 survey found that over half of Gen Z consumers in the U.S. plan to shop more online and in-store this year compared to last.
48. 86% of shoppers will use Amazon for holiday shopping, 60% will shop on Walmart.com, and 47% will check out Target.
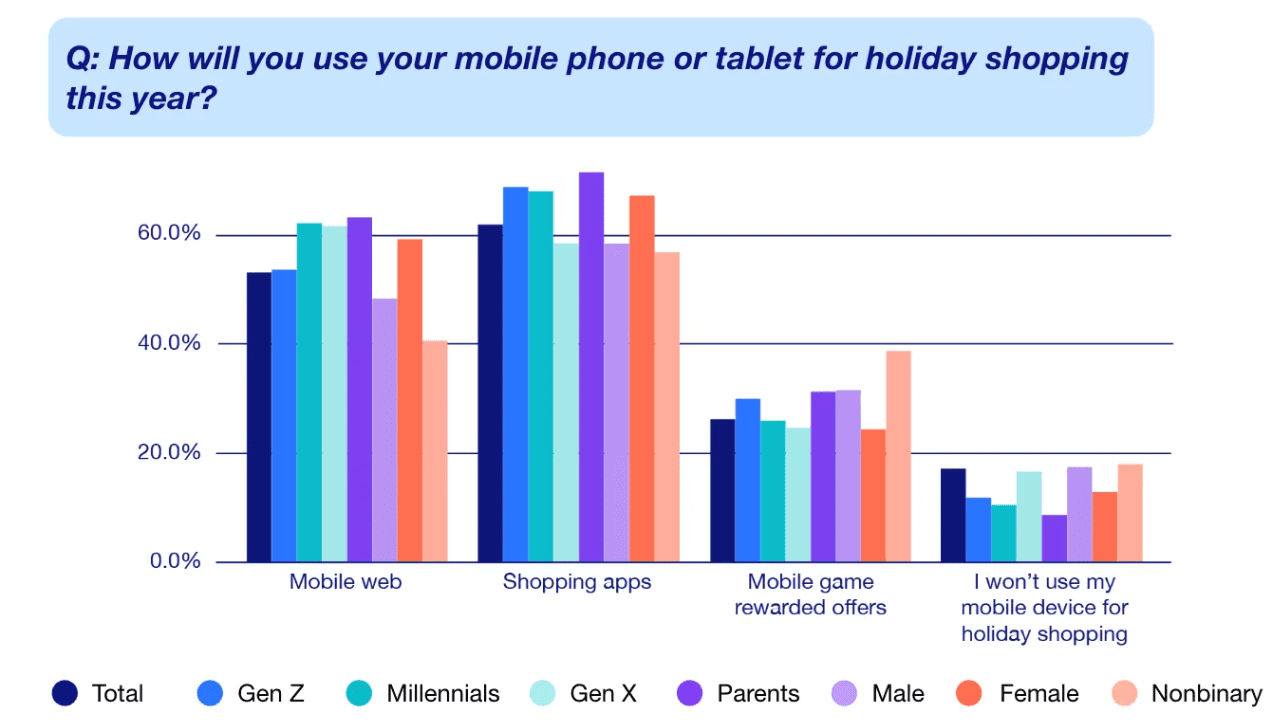
49. According to Tinuiti’s Holiday Survey, 75% of people will do at least some of their gift shopping on their phones.
50. About 85% of Gen Z will use a phone or tablet for holiday shopping, compared to 87% of millennials.
Source
In-store Holiday Shopping Statistics
Even though online shopping is huge, brick-and-mortar stores still have their charm.
Let’s dive into some key holiday marketing stats that show why in-store shopping remains popular during the holiday season.
51. 60% of U.S. holiday shoppers prefer brick-and-mortar stores so they can touch/see products before buying.
52. 42% of holiday shoppers like supporting local businesses over big national chains.
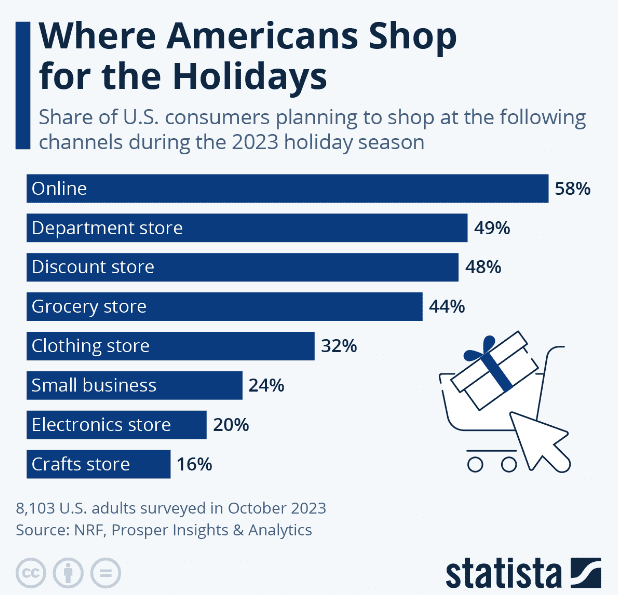
53. According to the National Retail Federation, about 58% of buyers will shop online this holiday season, while 49% plan to visit department stores, 48% will head to discount stores, and 44% will make purchases at grocery stores.
Source
54. On average, holiday shoppers are willing to travel about 11.5 miles to buy a gift from a retailer.
55. About 82% of people use festive in-store displays for information during their holiday shopping.
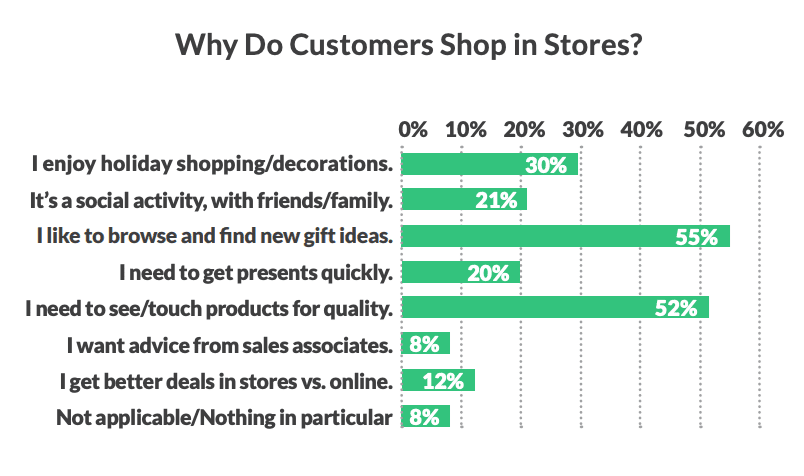
56. 55% shop in stores to browse for new gift ideas, and 52% want to touch or see products to check their quality.
Source
57. 22% plan to buy holiday supplies (decor, recipe ingredients, etc) both online and in-store.
58. 97% of Gen Z shoppers prefer brick-and-mortar stores over other generations.
59. 30% of Gen Z shoppers choose in-store shopping for the immediate availability of products.
Source
Social Media Holiday Statistics
If you’re thinking about apps that really shape how people shop, social media networks top the list. With features like Reels and Stories boosting engagement, social media spending has surged—especially during the holiday season.
Many small businesses now rely on social platforms to boost sales and reach their target audience.
Here are some key holiday marketing stats that show just how essential social media is for businesses during the holidays:
60. 76% of people have bought a product after seeing it in a brand’s social media post.
61. 65% of customers will use social media to find or buy holiday items.
62. 87% of Gen Z shoppers get their holiday shopping ideas from social media.
63. 50% of shoppers are more likely to visit a brand’s website after seeing a social media ad, compared to 39% who respond to promotional emails.
Source
64. 34% of shoppers plan to use social media to look for or buy holiday products.
65. 58% of all consumers will let social media guide their holiday buying decisions, with Facebook, YouTube, and Instagram leading the way.
67. 96% of shoppers check online reviews during the holidays.
68. 8 in 1 holiday buyers are influenced by the internet before making a purchase—with search engines being the most impactful.
Cyber Monday and Black Friday Statistics
Before Christmas rolls around, Black Friday, Cyber Monday, and Cyber Week are huge shopping events that attract a lot of attention with incredible deals and discounts.
Let’s dive into some holiday marketing stats to help you get ready for these major shopping events.
69. Shoppers spend a whopping $12.4 billion on Cyber Monday each year.
70. The average American plans to spend $500 from Black Friday through Cyber Monday.
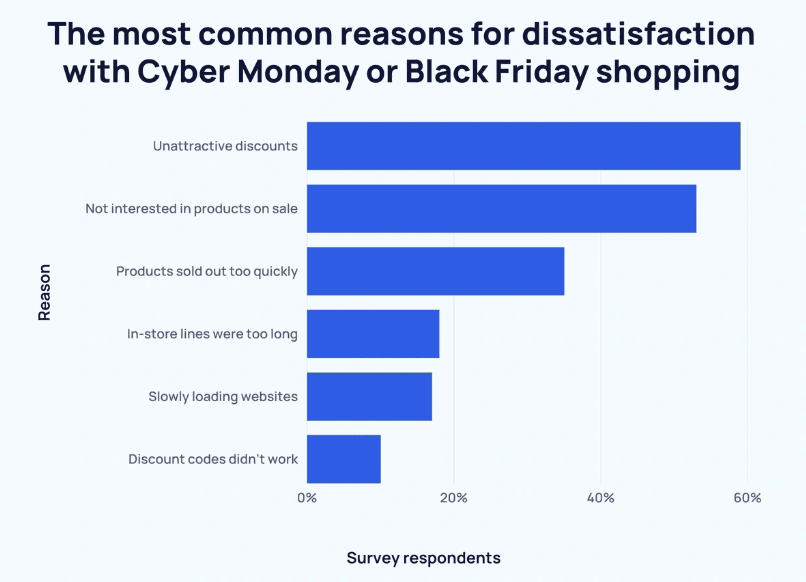
71. 90% of U.S. shoppers are happy with their Black Friday and Cyber Monday shopping, while only 10% are not satisfied.
Source
72. Last year, 196.3 million Americans shopped during Cyber Week.
73. Shopify merchants racked up $9.3 billion in sales between Black Friday and Cyber Monday.
74. Mobile shopping is on the rise, with smartphones making up 59% of Cyber Monday sales in 2023, up from 55% in 2022.
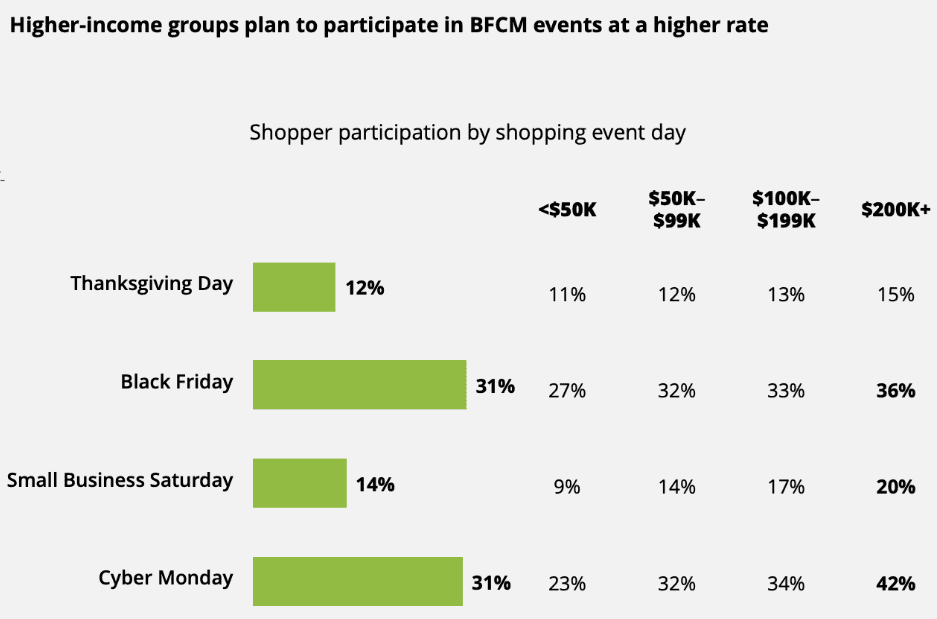
75. Shoppers with annual incomes of $50,000 or less plan to spend an average of $320, while those earning $100,000 or more plan to spend $650.
Source
76. For payment methods, 48% of shoppers will use credit cards, and 37% will opt for buy now, pay later (BNPL).
77. Black Friday sees the most opened emails and clicked links during the holidays, with over 5 million promotional emails sent that day—more than any other day of the year. Cyber Monday and Thanksgiving follow in second and third place.
Conclusion
The holidays are a perfect time to elevate your marketing efforts. Take these stats and let them inspire you to make the most of this festive season for your business.
You can run special promotions, get into the holiday spirit with your customers, and explore many other creative ways to make your marketing pop.
With the powerful holiday marketing stats we’ve shared—you’re ready to make this season your most successful one yet!