Mobile devices have become an important part of our daily routines.
From scrolling through social media and shopping online to working remotely and streaming videos, we rely on our smartphones and tablets for almost everything.
As mobile usage continues to grow, understanding how people access the internet has never been more important.
Businesses that keep up with all these trends can connect better with their target audience and stay ahead in an increasingly mobile-first world.
But how much of today’s internet traffic actually comes from mobile devices? Which gadgets are dominating the web right now? And what are users doing with their mobile phones? Who are these users?
Let’s dive into the latest mobile internet traffic stats to find the answers.


General Mobile Internet Traffic Stats
We now spend more than half of our online time on mobile phones.
The rise of wireless connections on portable devices has transformed the digital world, influencing both hardware and software while also speeding up digital growth in emerging markets.
By mid-2024, it was estimated that over 96% of people globally used a mobile device to access the internet.
Here are some general mobile internet traffic stats that highlight just how powerful mobile phones have become in shaping our online experience:
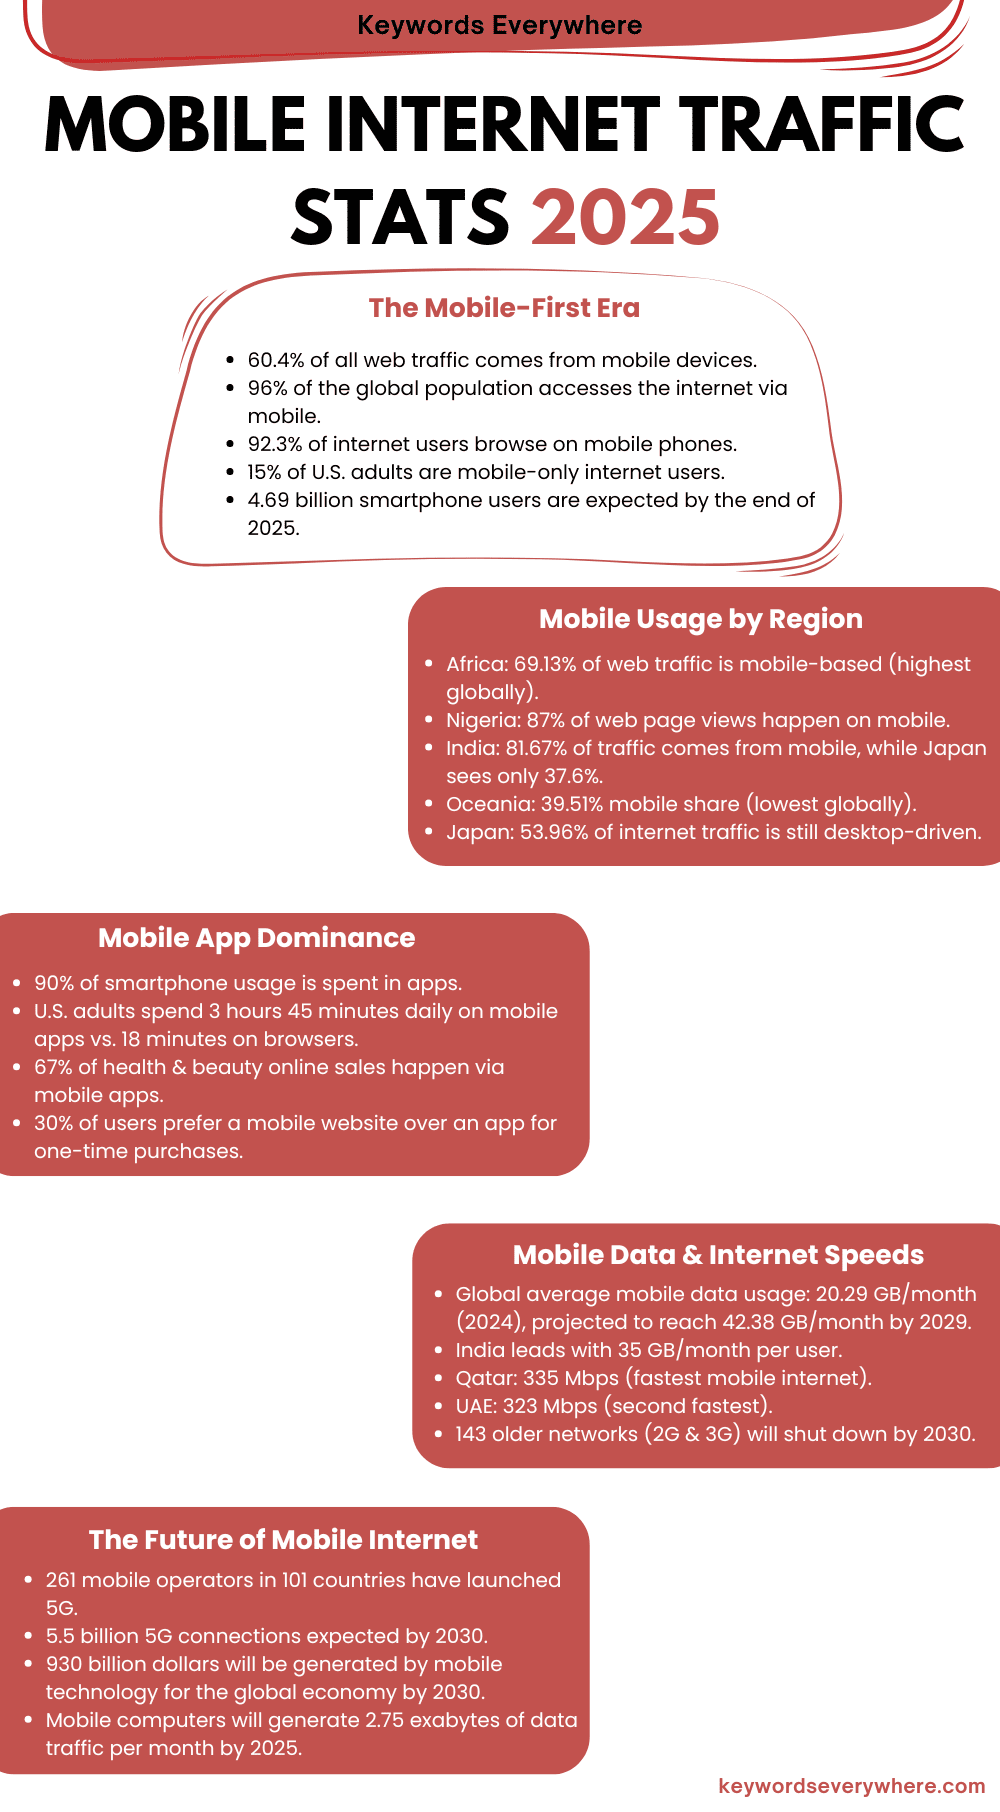
1. The total percentage of global web traffic from mobile phones has risen a lot over the past 12 years. As of October 2024, 60.4% of all web traffic came through mobile phones.
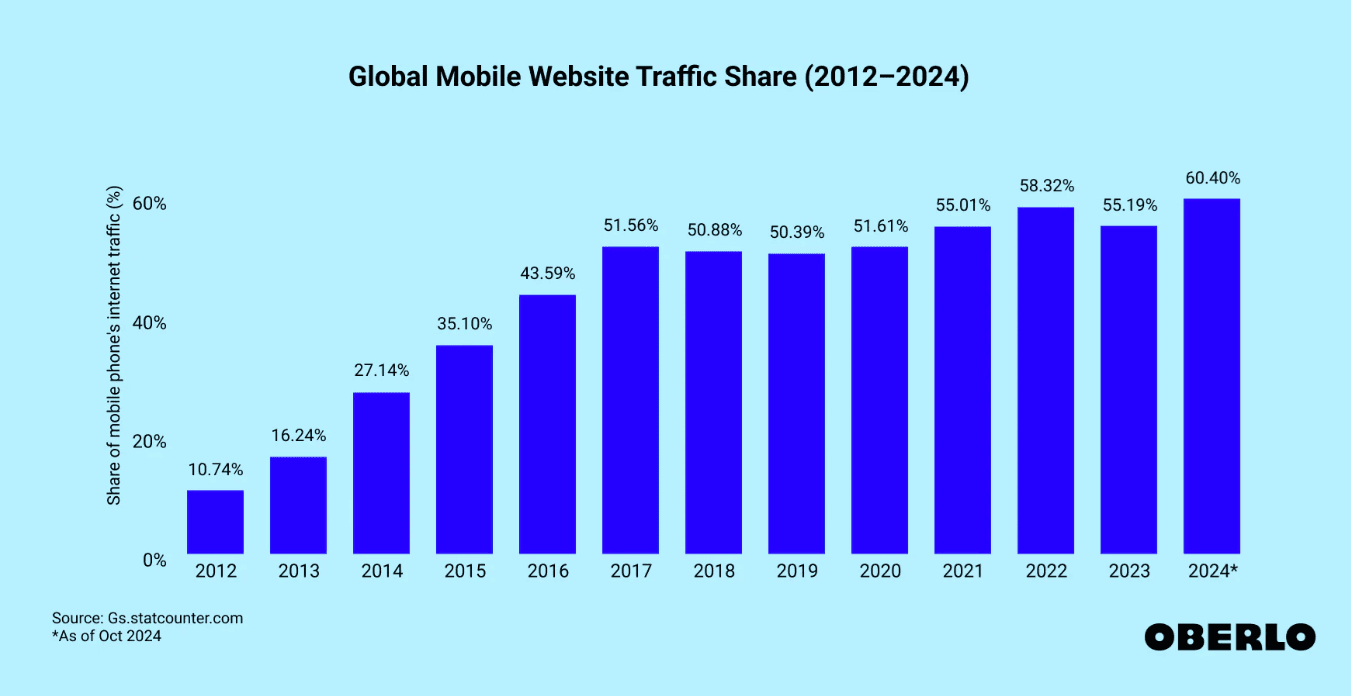
Global mobile web traffic share (2012-2024)
2. By 2025, it’s expected that 4.69 billion people will own a smartphone. That’s an increase of 440 million new smartphone users compared to the previous year, highlighting how fast smartphone adoption is growing worldwide.
3. In the United States, smartphone ownership has also seen a big jump. As of now, 91% of adults in the U.S. own a smartphone, compared to 70% back in May 2016.
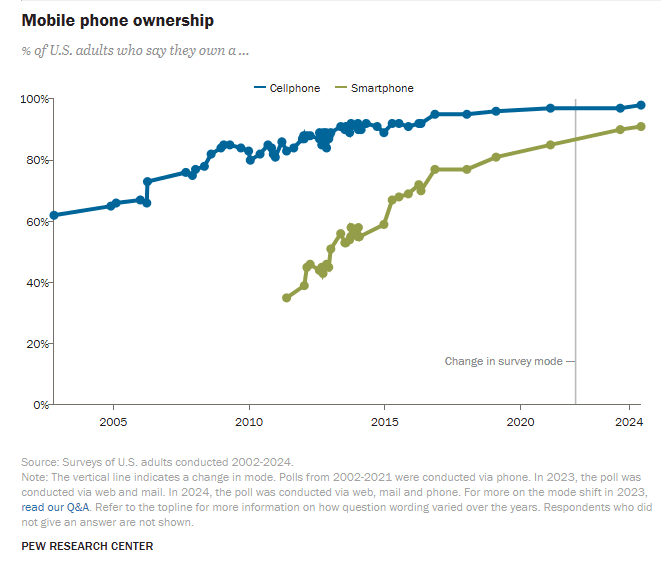
Mobile phone ownership percentage
4. People are also using more mobile data than ever before. In 2024, the average smartphone user around the world used about 20.29 gigabytes of mobile data each month. This was up from 17.27 gigabytes in 2023. Experts predict this number will grow to 23.78 gigabytes in 2025 and reach as high as 42.38 gigabytes by 2029.
5. When it comes to how people use their phones, most of the time is spent inside mobile apps rather than web browsers. In fact, over 90% of smartphone usage happens in apps.
6. By 2025, U.S. adults are expected to spend about 3 hours and 45 minutes per day using mobile apps, while only 18 minutes are spent browsing the internet through mobile browsers.
7. On top of that, the total time people spend on their phones is increasing. American adults (ages 18 and up) are expected to spend an average of 4 hours and 2 minutes per day using the internet on their smartphones in 2025.
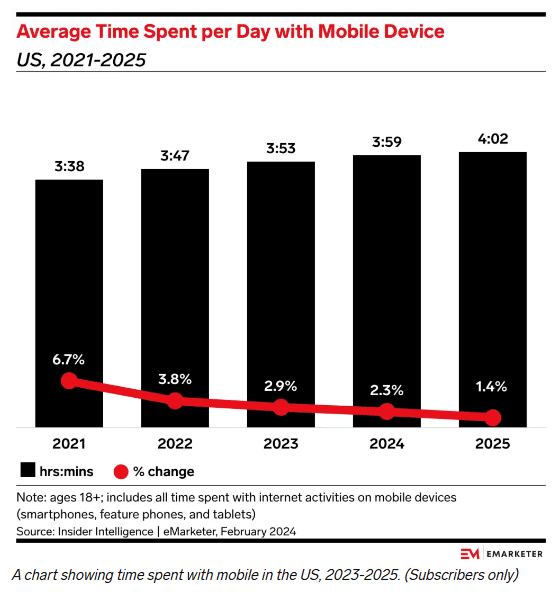
Average time spent per day with mobile device in the US
8. Mobile phones are now the main way people go online. A recent survey found that 92.3% of internet users access the web through a mobile phone, while 65.6% still use laptops or desktop computers.
9. Android dominates global web traffic with a 70.48% share, while Apple’s iOS holds 28.8%. Together, these two platforms account for a massive 99.28% of all mobile web traffic.
10. In terms of mobile internet speed, Qatar had the fastest average mobile internet connection in the world as of June 2024, with speeds reaching nearly 335 megabits per second (Mbps). The United Arab Emirates (UAE) followed closely behind, with average speeds of over 323 Mbps.
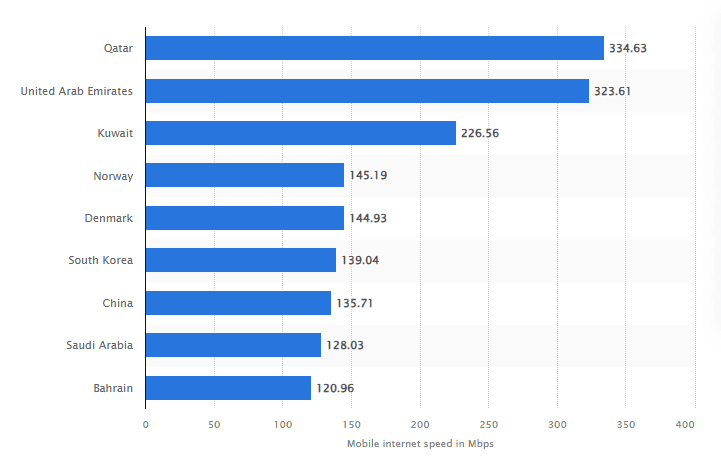
List of countries with the fastest average mobile internet speeds
11. The market for wireless access points is also growing quickly. It’s expected to expand by $7.53 billion between 2023 and 2028, showing strong demand for better wireless connectivity.
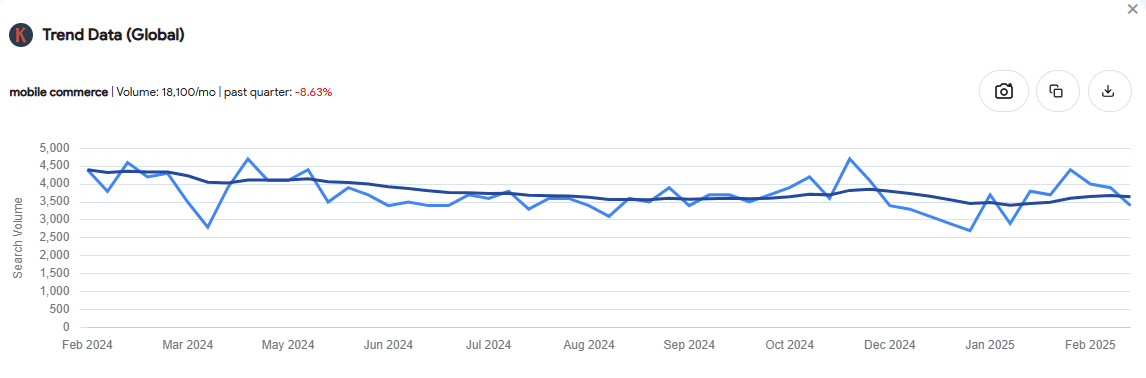
12. With so many people using their phones for shopping, businesses are focusing more on mobile commerce. According to Keywords Everywhere, searches for the term “mobile commerce” have stayed steady over the past 12 months, proving that this trend is strong and isn’t going away anytime soon.
Mobile Internet Traffic Stats By Region
Mobile internet usage isn’t the same everywhere — it changes a lot from one region to another. Let’s take a look at which countries depend the most on mobile devices to go online:
13. Africa leads the world in mobile internet usage, with 69.13% of its web traffic coming from mobile devices. On the flip side, Oceania has the lowest share, with only 39.51% of internet traffic coming from mobiles.
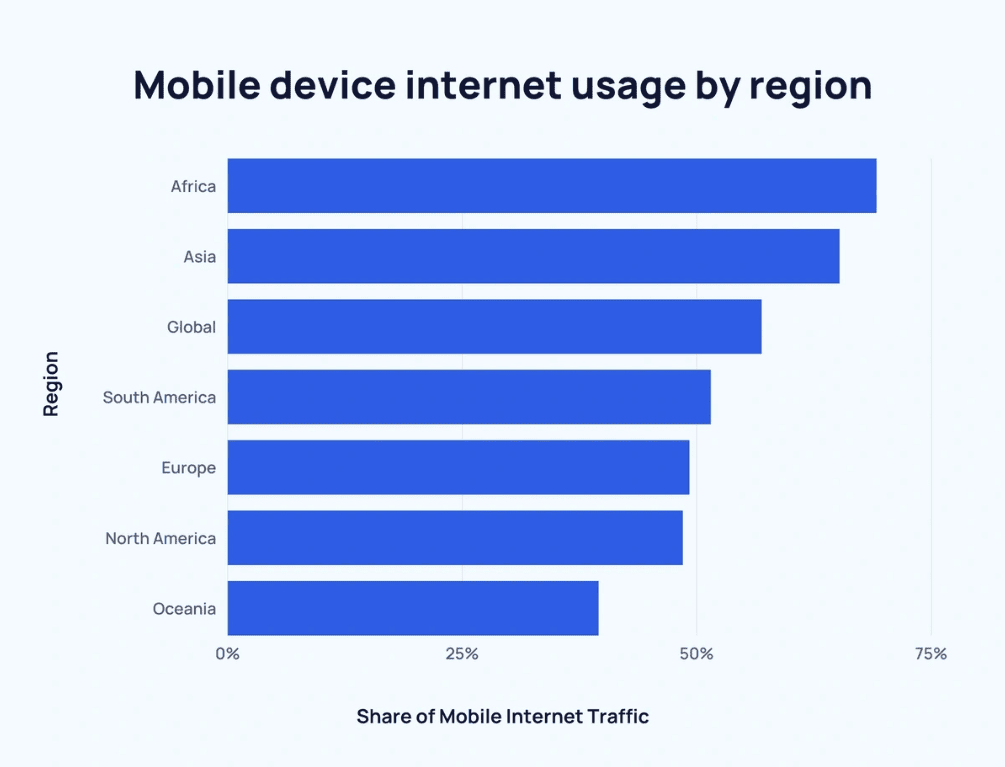
Mobile device internet usage by region
14. In 2024, countries like Malaysia, Singapore, United Arab Emirates (UAE), and Switzerland saw about 95% of their population using mobile internet, showing how deeply integrated mobile devices are in daily life there.
15. New Zealand had an impressive mobile internet penetration rate of 94.6%, while the UAE, Kuwait, and Bahrain stood out for having some of the fastest average mobile internet speeds globally.
16. As of January 2024, mobile phones were responsible for 87% of web page views in Nigeria, making it one of the most mobile-driven countries online. Vietnam followed closely, with 86.5% of its web traffic coming from mobile devices.
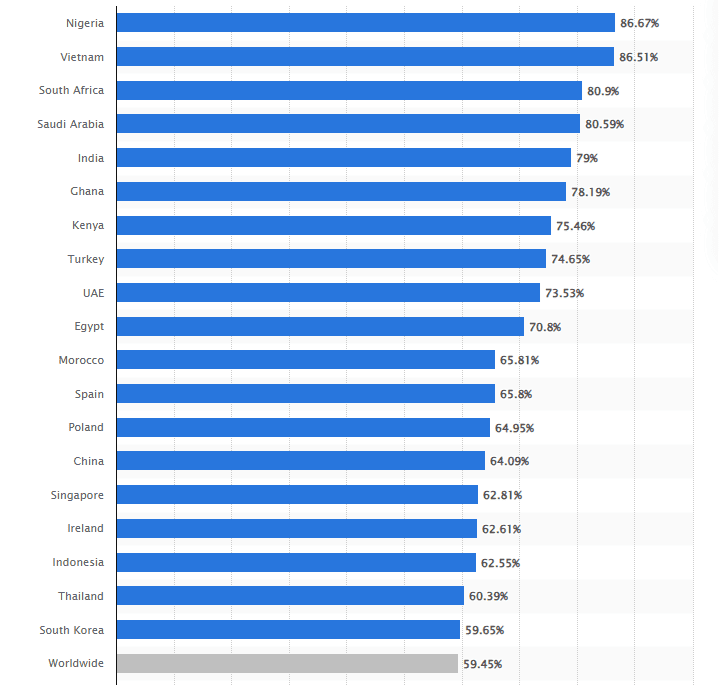
Share of total web page views by country
17. In contrast, countries like Belgium, Portugal, and Canada saw lower mobile usage, with less than 43% of their national internet traffic coming from mobile devices.
18. Japan had the lowest rate of mobile internet traffic among major countries, with only 37.6% of its total internet usage coming from smartphones and other mobile-connected devices at the start of 2024.
19. In Asia, mobile internet usage continued to grow, with mobile phones accounting for 68.8% of total web traffic as of March 2024, slightly up from 68% the previous year.
20. The Asia-Pacific region has some of the largest mobile internet user bases. In 2024, China had almost 1.1 billion mobile internet users, while India wasn’t far behind with about 1.05 billion users.
21. In terms of data consumption, India, Nepal, and Bhutan topped the charts in 2024, with each smartphone using nearly 35 gigabytes (GB) of mobile data per month. Popular activities like 4K video streaming and mobile gaming drive this high usage.
22. In most African countries, mobile phones account for more than half of all web traffic. In contrast, the United States sees lower mobile usage, with mobile devices making up about 45.49% of total online traffic.
Mobile vs. Desktop Traffic Share Stats
With more than 5.44 billion people using the internet and around 1.1 billion websites available, the way we connect with the web is always evolving. One major change is the steady rise in mobile users, who have now surpassed desktop users in many countries.
The following mobile internet traffic stats break down how web traffic is split between mobile and desktop devices, both globally and across different regions.
23. In the U.S., about 15% of adults use mobile devices only to access the internet, skipping desktops altogether.
24. In Japan, people still prefer desktops, with 53.96% of web traffic coming from desktops and 46.04% from mobile devices.
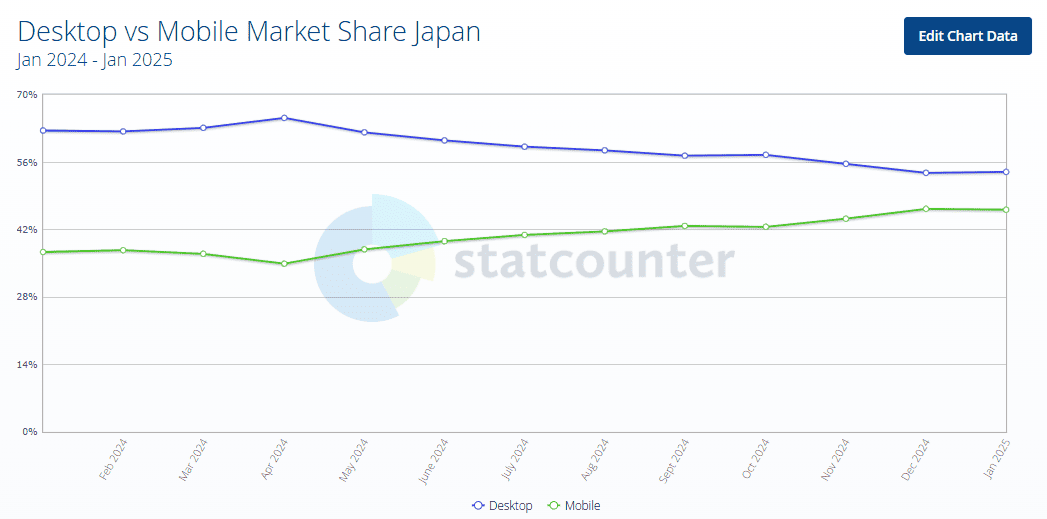
Desktop vs mobile market share Japan
25. Canada shows a similar trend, where 51.74% of internet traffic comes from desktops, while 48.26% comes from mobile devices, showing a nearly even split.
26. In contrast, India heavily relies on mobile devices, with 81.67% of all internet traffic coming from mobiles and only 18.33% from desktops.
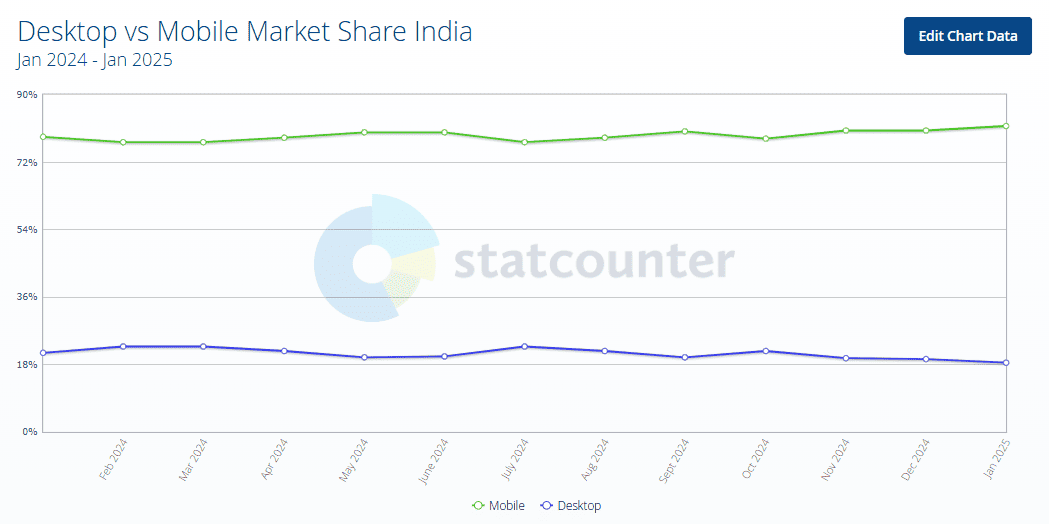
Desktop vs mobile market share India
27. In the U.K., mobile devices account for 56.86% of web traffic, while desktops contribute 43.14%.
28. China also leans towards mobile, with 66.06% of its internet traffic coming from mobile devices and 33.94% from desktops.
29. Sudan tops the list for mobile internet usage, with a massive 90.55% of its traffic coming from mobile devices and only 9.45% from desktops.
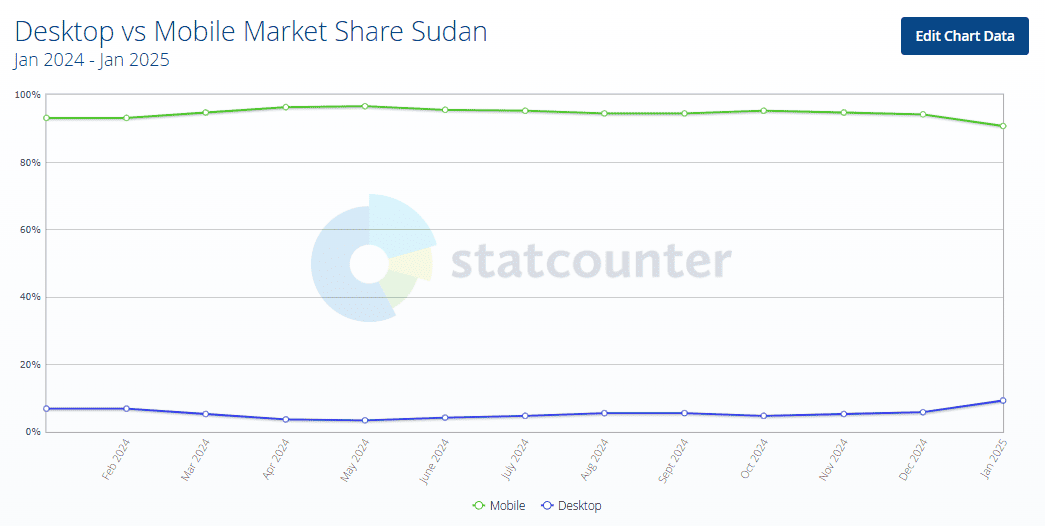
Desktop vs mobile market share Sudan
30. Nigeria follows closely, with 85.57% of its web traffic coming from mobiles and just 14.43% from desktops.
31. In the U.S., 20% of people use smartphones for media and entertainment, while only 8% use laptops or PCs. Television still leads with 33%, followed by smart/connected TVs at 30%.
32. When it comes to shopping, 67% of all health and beauty retail website orders come from mobile devices, while 18% come from desktops and 1% from tablets.
33. Globally, 70.1% of internet users play video games on their smartphones, while 35.8% play on laptops or desktops.
34. A survey of 7,000 Americans found that 54% prefer playing games on their smartphones, while 32% favor PCs or laptops.
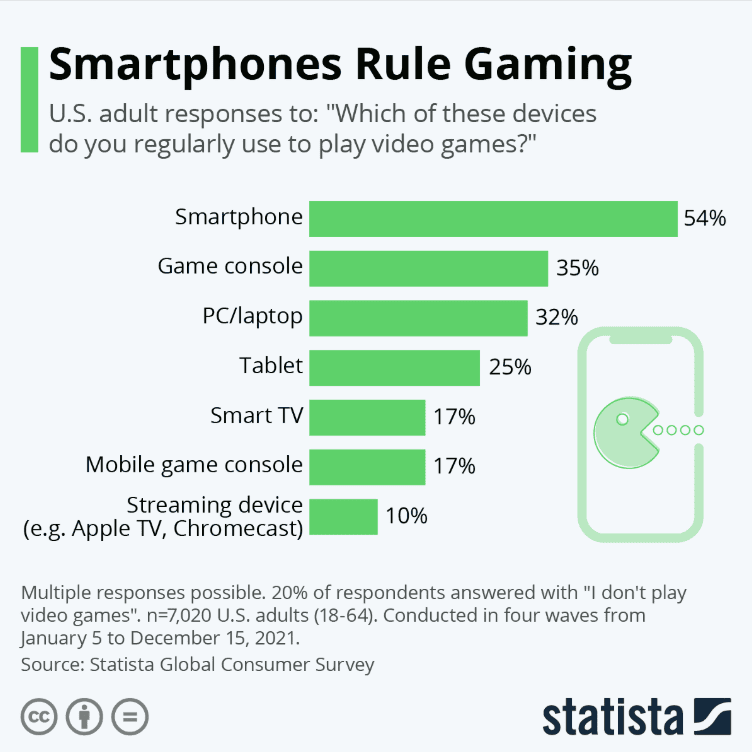
Americans prefer smartphones for playing games
35. Out of 8,845 surveyed consumers, 69% said they use their smartphones to stream digital videos, while only 25% use desktop devices.
36. Among adults aged 18-34, 79% said they watch video content on their smartphones every single week, compared to 37% who watch on a computer or laptop.
37. A 2024 survey in the U.K. showed that 78% of podcast listening time happens on smartphones, with laptops coming in second at 11%.
38. By 2025, mobile computers are expected to generate around 2.75 exabytes of mobile data traffic every month.
Mobile Connection Stats
Thanks to innovations like unlimited data plans and 5G technology, mobile internet has become faster and easier to access than ever before.
The following mobile internet traffic stats shows just how much things have changed:
39. In a 2024 survey of 9,241 U.S. consumers, 17% said their most common mobile data plan falls between 3 to 5 GB of data per month.
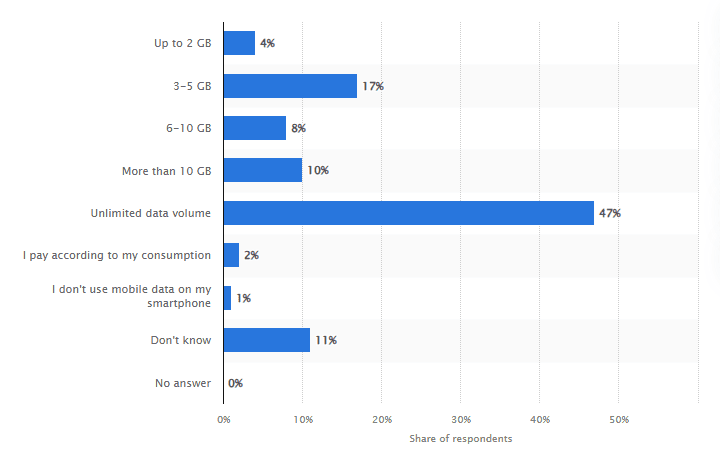
Most common mobile data plans in the US (2024)
40. The total number of mobile subscriptions in the U.S. reached almost 386 million in 2023, growing by 3.6% from the previous year. With 112 mobile subscriptions per 100 people, this means many individuals have multiple mobile lines.
41. When asked about smartphone carriers, U.S. consumers ranked AT&T as the most popular, while Visible was the least preferred. These insights come from a Statista survey on mobile carriers and brands.
42. As of January 2024, 261 mobile operators in 101 countries had already launched commercial 5G services. More markets are catching up, with over 90 operators from 64 markets planning to introduce 5G in the coming years.
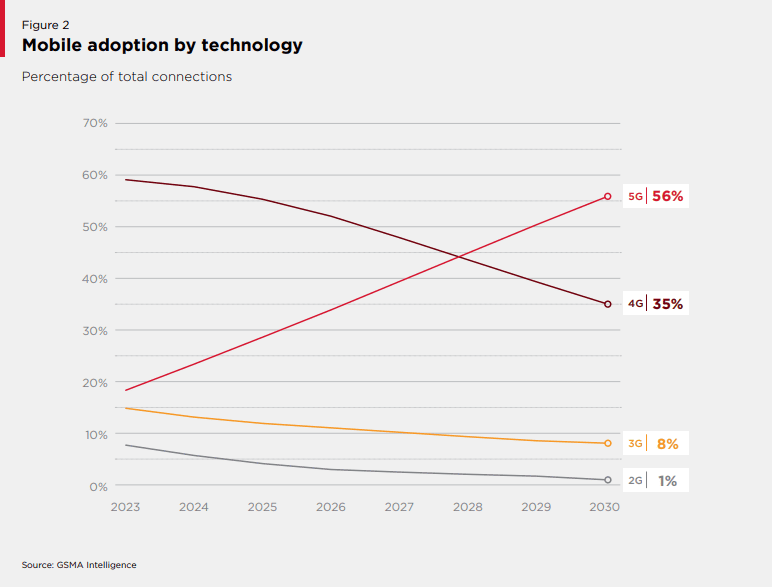
Mobile adoption by technology
43. At the end of 2023, there were 1.6 billion 5G connections worldwide. This number is expected to rise to 5.5 billion by 2030, showing the rapid adoption of this next-generation technology.
44. 143 older mobile networks (2G and 3G) are set to be retired between 2023 and 2030, with nearly half of these shutdowns happening by the end of 2024, according to GSMA Intelligence.
45. Mobile data usage is growing fast. Between 2023 and 2030, global mobile data traffic is expected to increase by 23% annually, reaching over 465 exabytes (EB) per month by the end of the decade.
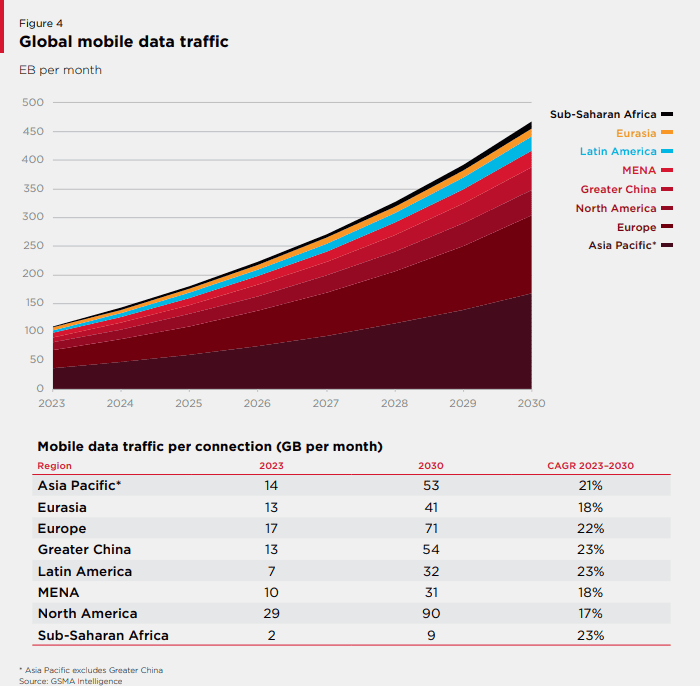
Global mobile data traffic
46. In 2023, mobile technologies nd services contributed 5.4% of the global GDP, adding $5.7 trillion to the economy. The biggest boost came from productivity gains, which accounted for $3.5 billion, followed by $690 billion in indirect economic contributions.
47. 5G technology is expected to generate over $930 billion for the global economy by 2030, making up 15% of mobile’s overall economic impact. The strongest growth is expected in Asia-Pacific, North America, and Europe, where 5G adoption is expanding rapidly.
Mobile Users Behaviour & Demographic Stats
As smartphones become an essential part of daily life, the way people interact with them continues to evolve.
From how often they upgrade their devices to the types of activities they prioritize, mobile user behavior is always shifting.
Here are some important mobile user behavior and demographic stats to look for:
48. Cell phone ownership has grown by 20% since 2015. In 2024, over 98% of Americans owned a cell phone, compared to 81% in 2015. Today, more than 9 out of 10 cell phone owners have a smartphone.
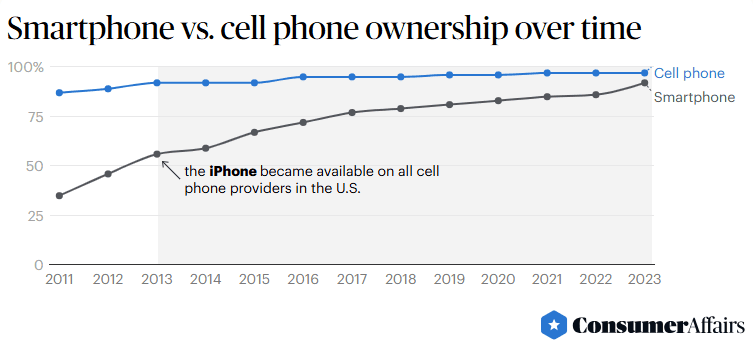
Smartphone vs cell phone ownership over time
49. Among young adults (ages 18-29) in the U.S., 95% rely on smartphones, a percentage that remains the same for those aged 30-49. Smartphone ownership slightly drops among 50-64-year-olds, with 92% owning one.
50. 95% of U.S. teens (ages 13-17) have access to a smartphone—a 22% increase over the past decade.
51. Older teens (ages 15-17) are slightly more likely to own a smartphone, with 97% having one, compared to 94% of younger teens. Additionally, 97% of girls own a smartphone, compared to 94% of boys.
52. Teen smartphone ownership also varies by household income. 92% of teens in middle-income households ($30,000 – $74,999) have a smartphone, compared to 94% in lower-income and 96% in higher-income households.
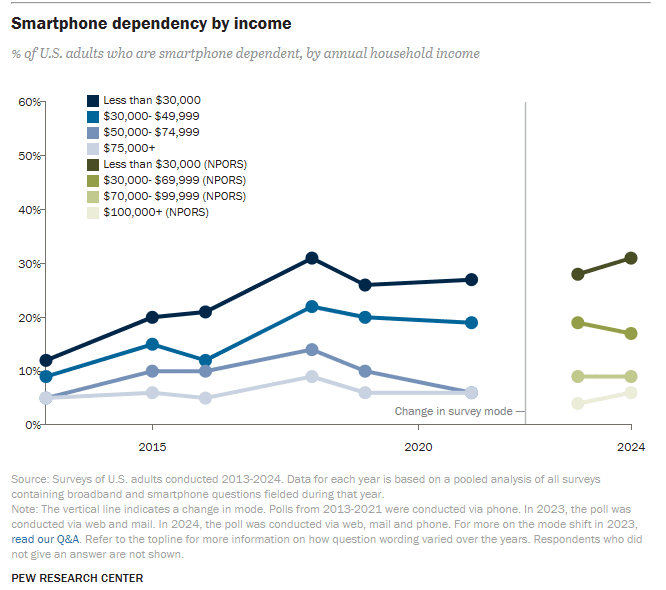
Smartphone dependency by income
53. 15% of smartphone users in the U.S. live in “smartphone-only” households, meaning they do not own a laptop, tablet, or desktop. Meanwhile, only 8% of households own all four key connected devices—smartphone, laptop, tablet, and smartwatch.
54. The most common device combination in U.S. households is a smartphone plus one other connected device (laptop, tablet, or smartwatch), with 42% of homes following this pattern.
55. Many people upgrade their phones frequently—11.89% buy a new one every year, while 4.28% replace their phones every six months.
56. The most common smartphone activities include checking emails, taking photos, and browsing the internet.
57. M-commerce (mobile shopping) is booming. By 2025, mobile phone sales are expected to double, reaching $710 billion, compared to $360 billion in 2021.
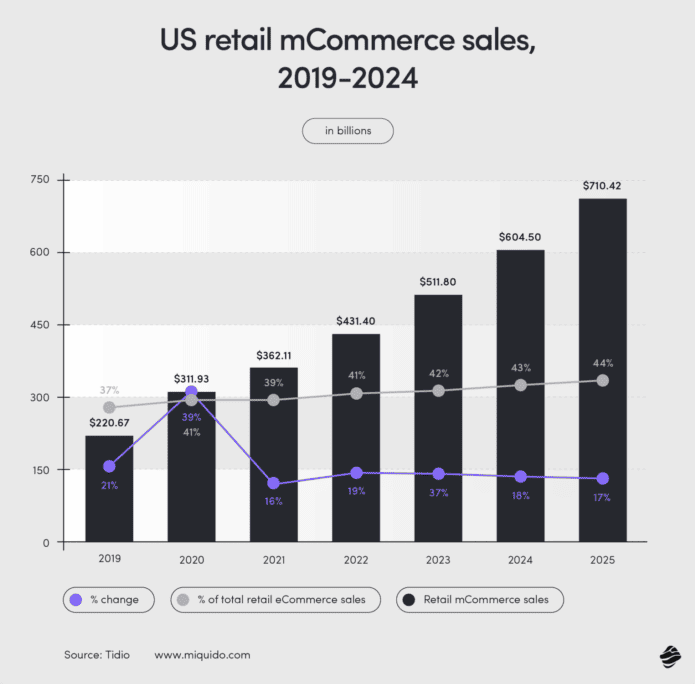
US mCommerce sales predictions
58. About 60% of mobile users have contacted a business directly from search results, using features like the “click to call” option.
59. 63% of mobile users are likely to buy from companies that provide personalized product recommendations on their mobile sites or apps.
60. 30% of smartphone users prefer using a company’s mobile site over an app when making one-time purchases while shopping on their phones.
Conclusion
That wraps up our deep dive into mobile internet traffic stats.
With more people relying on smartphones for everything from shopping to streaming, mobile internet use is only growing.
While developing countries like India are seeing a surge in new mobile users, other regions are refining their mobile experience with faster speeds and better coverage.
As technology advances and user behavior evolves, one thing is clear—mobile is shaping the future of how we connect, consume, and communicate online.