Since it was launched in 2004 by Mark Zuckerberg and his Harvard friends, Facebook has blown up from a college networking site into a massive global social media powerhouse. Every day, millions of people log in to chat with friends, share updates, and scope out new products.
With such a massive user base, Facebook offers businesses loads of chances to connect with their audiences through marketing and ads.
In this article, we’ve rounded up the latest Facebook stats for 2025 and beyond. Whether you’re a seasoned marketer or just getting started—these stats will give you the lowdown on how to make the most of Facebook’s marketing mojo.


General Facebook Stats
Did you know? There’s a saying that if Facebook were a country, it would be the largest in the world by population. This really shows how many people use Facebook.
Here are some general statistics about Facebook that highlight its huge reach, influence, and continued importance in 2024.
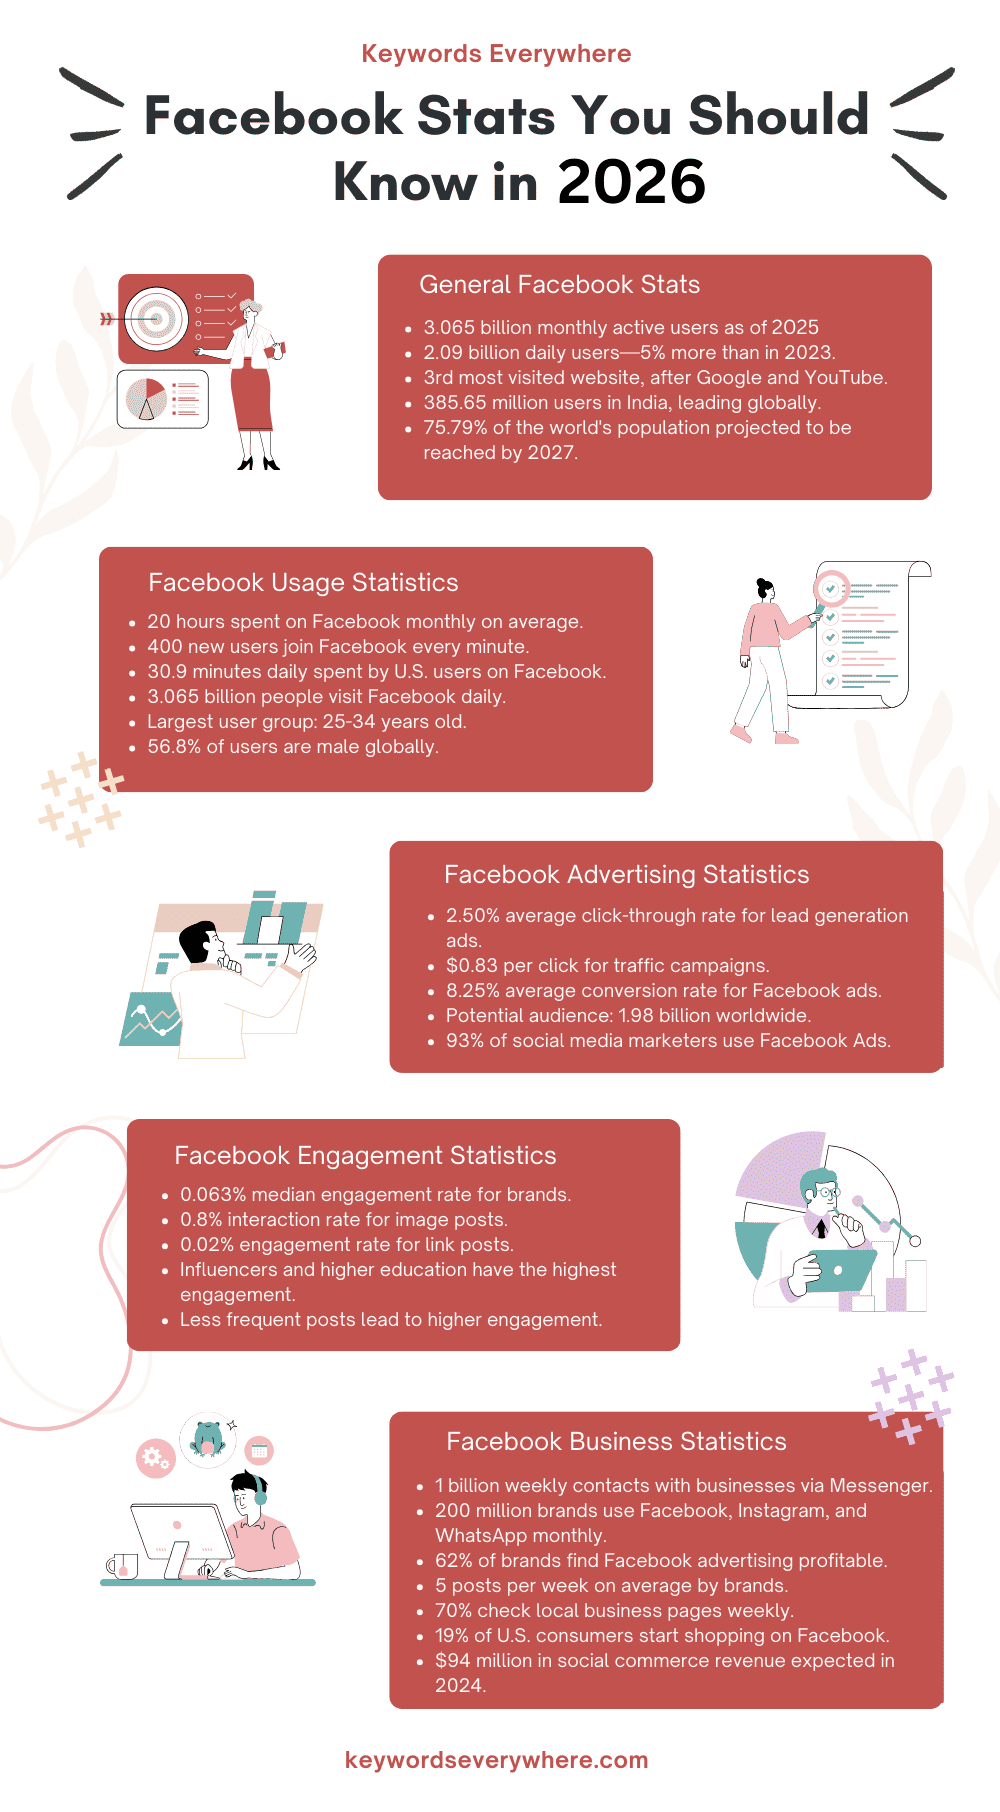
1. As of 2025, Facebook has about 3.065 billion monthly active users, making it the top app worldwide. In Q4 2022 it had 2.96 billion users, so that’s quite a jump.
2. Even more impressive, 2.09 billion people are logging in every day, showing a 5% increase from 2023.
3. Facebook is also the third most visited website, right behind Google and YouTube, beating out other big names like Twitter and Instagram.
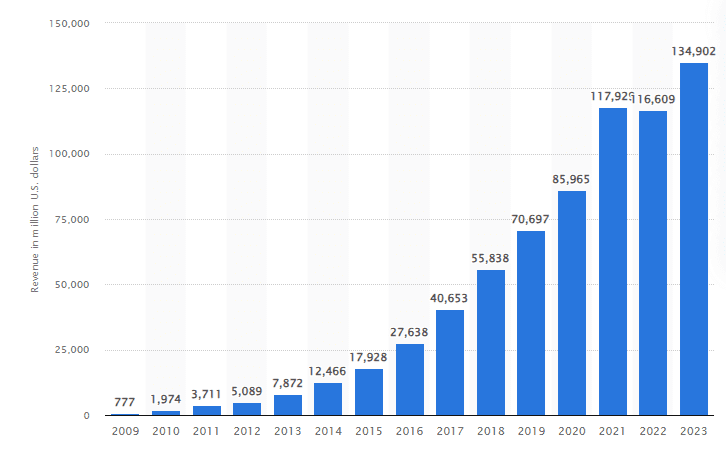
4. In 2023, Facebook raked in $135 billion from ads, up from $116 billion the previous year.
Source
5. India is leading with the most Facebook users, over 385.65 million. Following are the US (188.6 million), Indonesia (136.35 million), Brazil (111.75 million), and Mexico (94.8 million).
6. Experts think Facebook’s reach will keep growing. By 2027, it could connect with 75.79% of the world’s population.
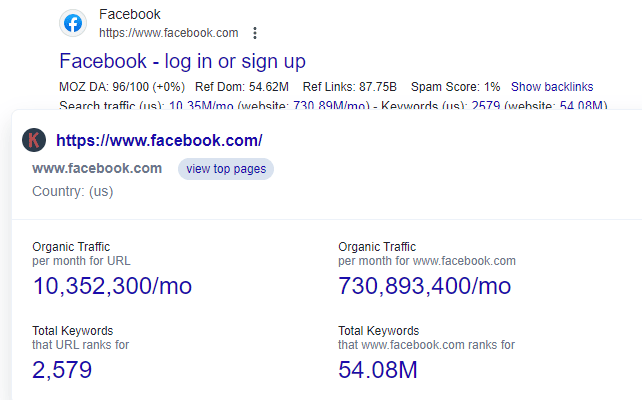
7. According to Keywords Everywhere, Facebook’s website gets 730.89 million monthly organic visitors and ranks for 54.08 million keywords.
Facebook Usage Statistics
Over the years, Facebook has become a household name in social media. It’s not just big—it’s the biggest platform out there, loved by people all around the world.
Here are some key stats about how people use Facebook. Understanding these can really help you plan how to use it for your own marketing:
8. On average, people use Facebook for nearly 20 hours each month, which breaks down to about 40 minutes every day.
9. Every minute, around 400 new users join Facebook. In that same minute, users make more than 510,000 comments, share 293,000 status updates, upload 136,000 photos, and like a whopping 4 million posts. These numbers keep growing as Facebook continues to expand.
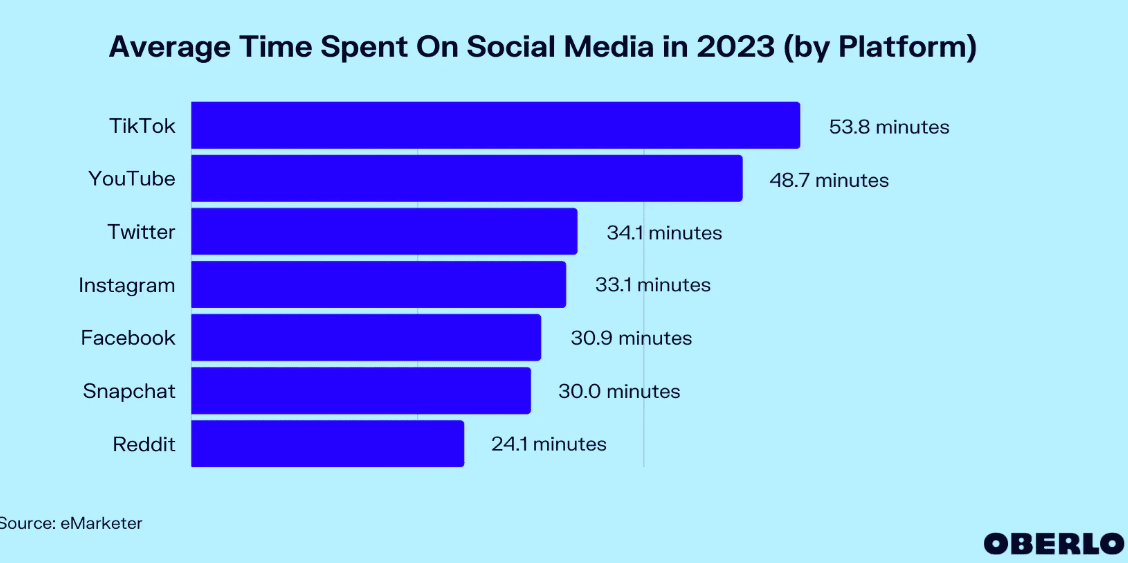
10. American users spend about 30.9 minutes daily on Facebook, which is more than other popular platforms like X, Instagram, and TikTok.
Source
11. Every day, an average of 3.065 billion people visit Facebook. That’s more than a third of the world’s population—which is over 8 billion, using Facebook every single day!
12. About 74.72% of active internet users worldwide use services owned by Facebook monthly. This translates to 49.04% of the total global population using Facebook-owned services monthly.
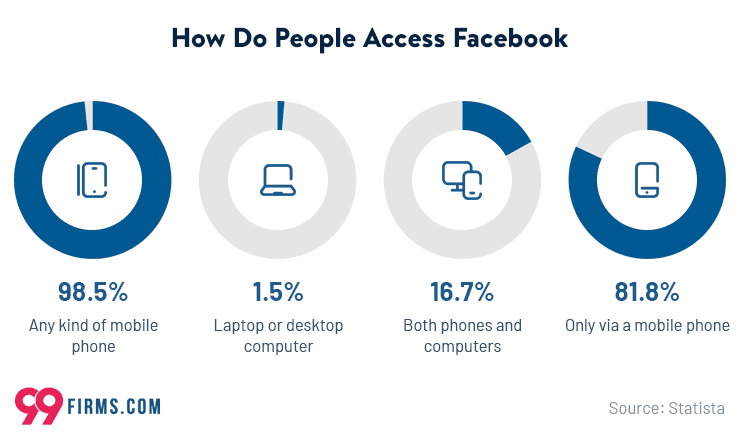
13. A large majority, 81.8%, of Facebook users access the platform only through a mobile phone. Only a small percentage (1.5%) exclusively use a laptop or desktop to use Facebook.
Source
Facebook User Statistics
Facebook boasts billions of users worldwide, but how exactly do all these people use it?
Let’s dive into some important Facebook stats about users to see how they interact and use the platform on a daily basis.
14. Out of the 3.065 billion people who use Facebook every month, 2.1 billion log in daily. That’s about 68.6% of users checking the platform daily.
15. Among U.S. adults who use social media for news, 30% prefer Facebook, leading over YouTube (26%), Instagram (16%), TikTok (14%), and X (12%).
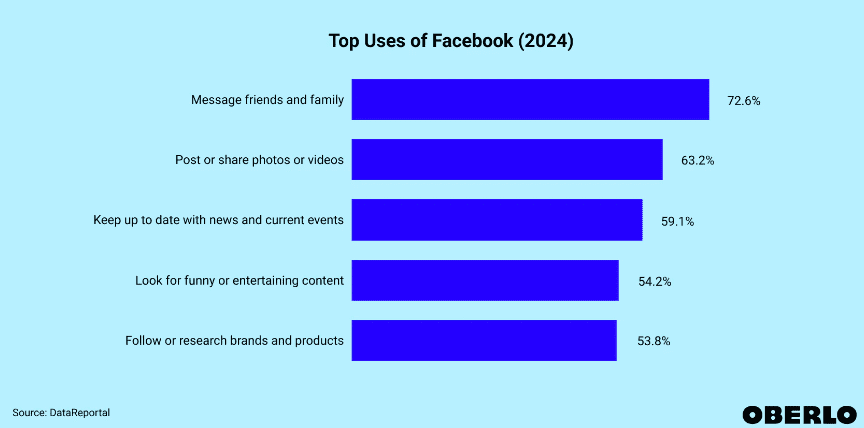
16. More than 72% of users use Facebook primarily to message friends and family, highlighting its strong social aspect. Other popular activities include sharing photos and videos (63.5%), staying updated on news and events (58.7%), and following brands and products (54.3%).
Source
17. Globally, 56.8% of Facebook users are male, compared to 43.2% who are female. In the U.S., 54.7% of users are female and 45.3% are male.
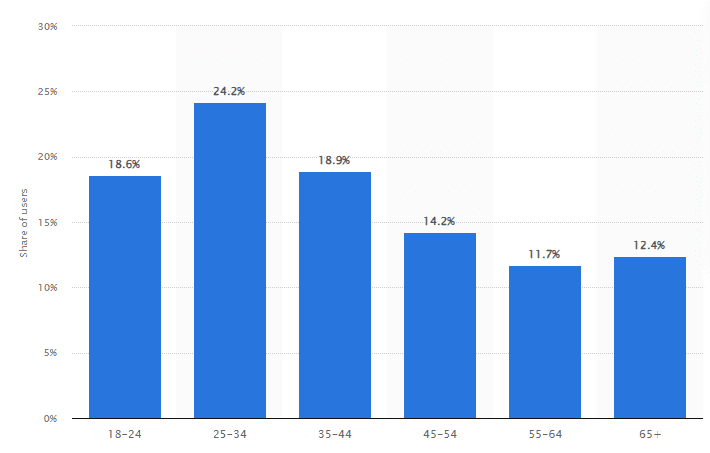
18. Facebook’s largest user group falls between ages 25 and 34. The platform generally sees higher usage among people under 44 years old, with over 20% of users aged 18 to 24.
19. As of 2023, only 33% of teenagers use Facebook, a sharp drop from the 71% who used it between 2014 and 2015.
Source
Facebook Advertising Statistics
Imagine you launch an ad, and suddenly it’s seen by thousands, maybe millions of potential customers. It’s thrilling, isn’t it?
But what does it actually take to make a significant impact in the vast world of Facebook advertising?
Let’s dive into these Facebook stats to see just how powerful advertising on this platform can be:
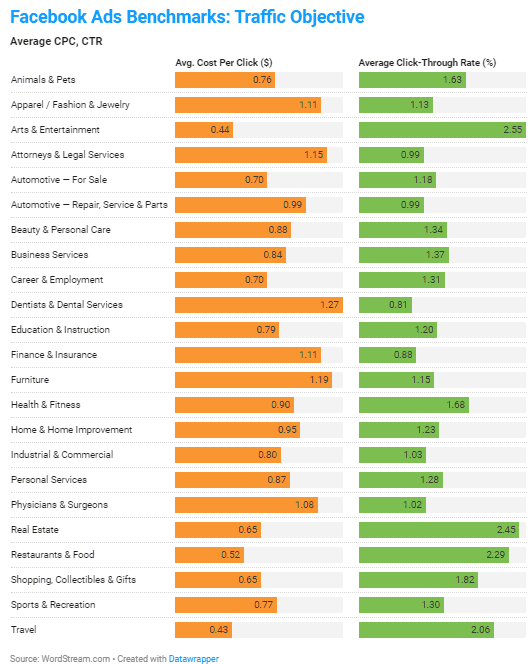
20. According to WordStream, Facebook ads aimed at generating leads typically get clicked about 2.50% of the time across different industries. Meanwhile, ads designed to drive traffic see a slightly lower click-through rate of 1.51%.
21. On average, it costs about $0.83 per click for Facebook traffic campaigns and $1.92 per click for lead generation campaigns across various industries.
Source
22. Facebook ads have an impressive average conversion rate of approximately 8.25%, which means a good percentage of people who see these ads end up taking action—like making a purchase or signing up.
23. If you’re running ads on Facebook in 2024, your potential audience could reach up to a massive 1.98 billion people worldwide.
24. In 2023, Facebook made around $152 billion globally from ads and other revenue sources. Experts predict an even stronger year ahead, estimating revenue could reach about $170.82 billion in 2024.
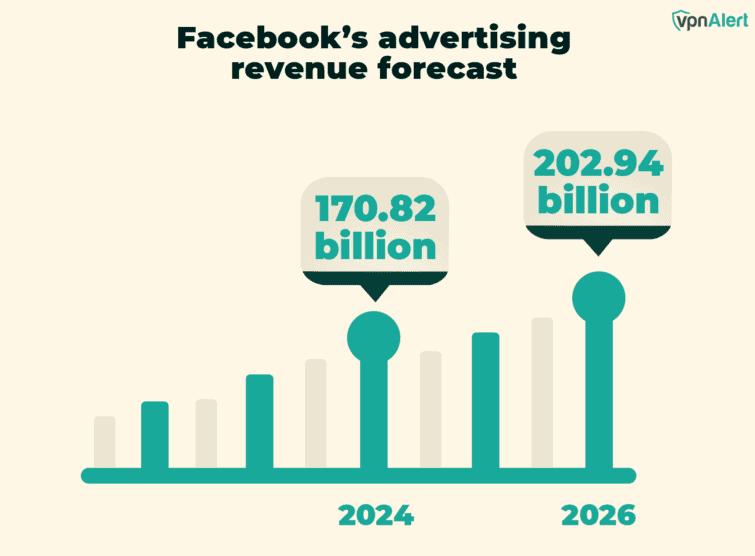
Source
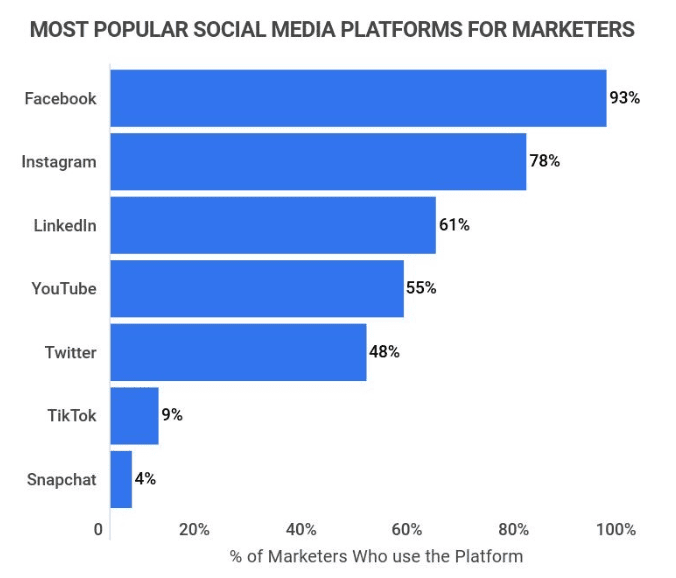
25. Almost every social media marketer out there—93% of them, to be exact—uses Facebook Ads to reach customers and promote businesses.
26. Studies show that the busiest times for Facebook activity globally are Wednesdays and Thursdays, particularly from 11 a.m. to 2 p.m., making these prime times to reach your audience.
27. Among all social media channels, Facebook and Instagram deliver the highest return on investment for advertisers, both at a solid 29%.
Facebook Engagement Statistics
As Facebook’s organic reach decreases, it’s no surprise that engagement levels are also affected.
But how does this affect Facebook compared to other social media channels?
Here are some important Facebook stats to see how engagement on this platform is shaping up:
28. According to a RivalIQ study, brands typically achieve a median Facebook engagement rate of 0.063% across different industries. This places Facebook as less engaging than most social media platforms, surpassing only X/Twitter’s 0.029% engagement rate.
29. Despite overall lower engagement rates on Facebook Pages, images tend to perform better—with an average interaction rate of 0.8%.
30. Link posts on Facebook Pages receive the lowest engagement rate among different types of posts, with only 0.02% interaction.
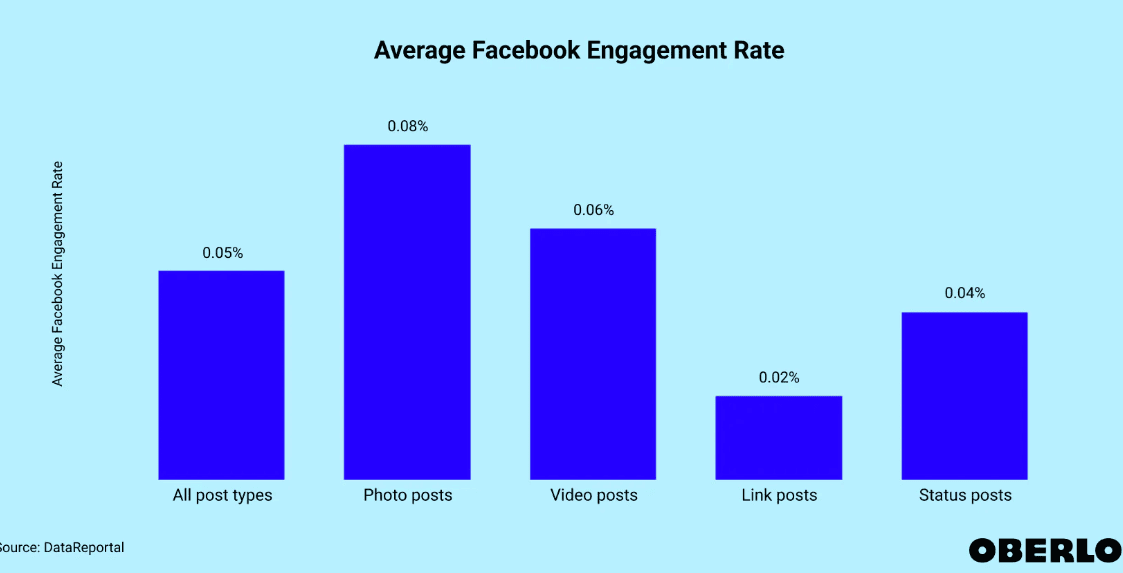
Source
31. Influencers and the higher education sector achieve the highest engagement relative to their posting frequency.
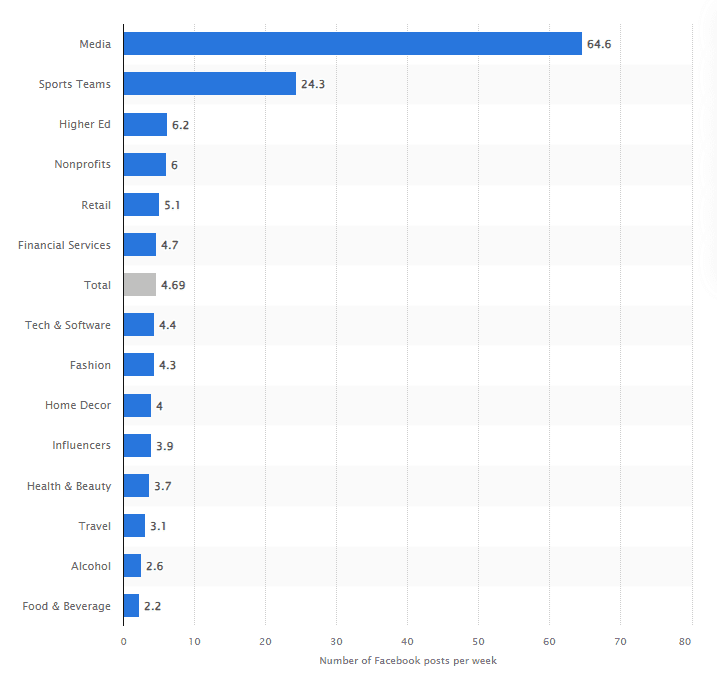
32. Expanding on the previous point, influencers and higher education pages post fewer than 10 times per week. On the flip side, media companies post over 60 times a week but only manage an average engagement rate of 0.04%. So it’s more about what and when you post rather than just how often.
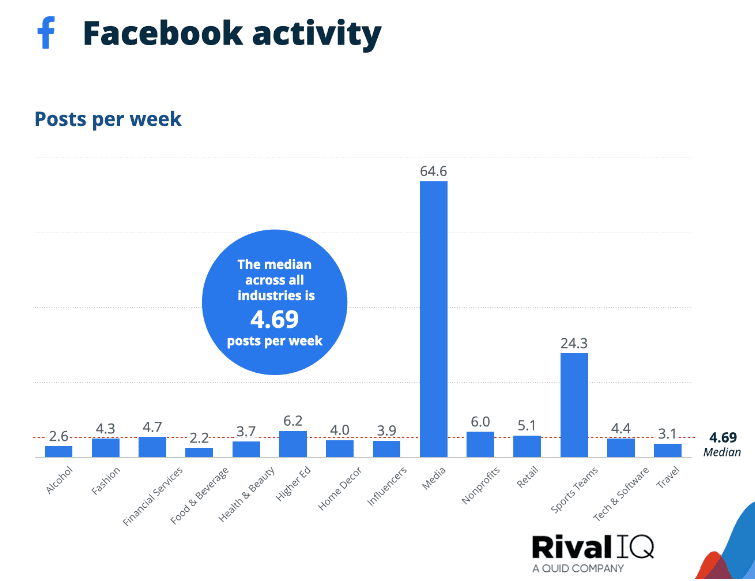
Source
Facebook Video Statistics
Imagine Facebook when it started—it was all about staying connected with family and friends, sharing updates and thoughts. But today, it’s evolved into a major video platform.
Many users now spend a significant chunk of their time watching videos on their News Feeds or on Facebook Watch.
Experts predict that soon, watching videos will be the main thing people do on Facebook.
Here are some important stats about Facebook videos that can really help you plan your strategy:
33. Facebook, Instagram, and YouTube are the top social media platforms for video marketing. 84% of video marketers use Facebook as a key channel. Two-thirds of American marketers do too.
34. Half of the time people spend on Facebook (and Instagram) is watching videos. Your audience likely watches videos there so creating more can help you reach more people.
35. Vertical videos (like Reels) with sound have a 35% higher click-through rate (CTR) than other video types on Facebook.
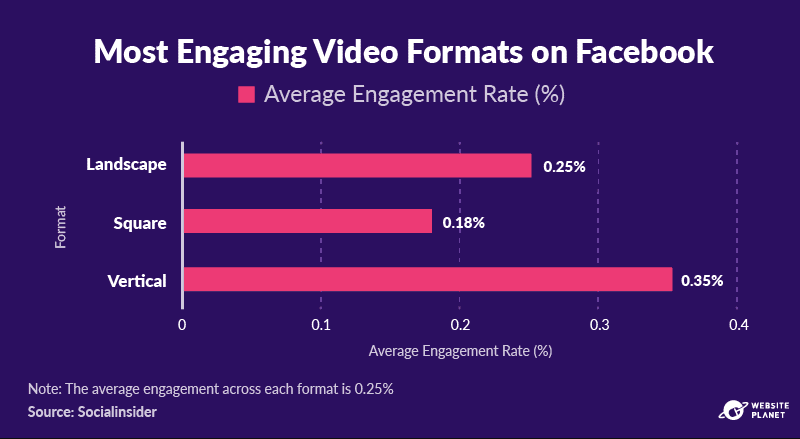
Source
36. Over 2 billion people watch videos on Facebook each month. And a huge 74% of Facebook’s non-skippable video ads are watched all the way through.
37. 65% of U.S. users enjoy watching Stories to feel close to friends. More than 70% agree Stories let them experience new things vicariously, and 57% feel part of a community through Stories.
38. A recent study found that 74% of Facebook videos are watched without sound. Since most videos start without audio—focusing on eye-catching visuals is very important.
39. Watching a Facebook video for more than 3 seconds counts as a view. If it’s over 10 seconds, viewers are actively engaging with your content. Aim for a 15-30 second average watch time for impressive results.
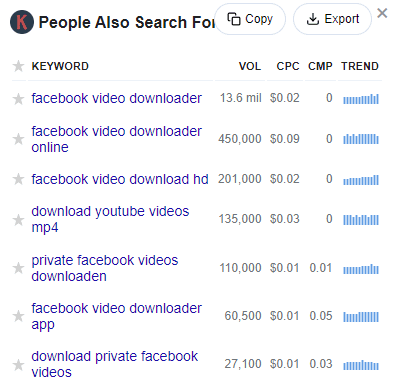
40. Keywords Everywhere reports a high number of searches for terms related to ‘Facebook video downloader’. This indicates a strong interest among users in downloading and sharing videos from the platform.
Facebook Business Statistics
More and more people are using Facebook to find and buy from brands and stores. So setting up a Facebook Marketplace or a Facebook Shop for your products is a no-brainer.
But remember, while you’re selling, don’t ignore the engagement part.
Facebook is all about building communities, and people prefer to shop with businesses they can talk to and trust.
Here are some important Facebook stats for business you need to know:
41. Each week, over a billion Facebook users contact businesses using Facebook Messenger.
42. Facebook, along with Instagram and WhatsApp, supports small businesses. Monthly, more than 200 million brands use these platforms to set up virtual shops and connect with customers.
43. Businesses of all types use Facebook widely. More than 90% of brands have a presence on Facebook—with Instagram and LinkedIn also popular among businesses.
Source
44. While many brands use Facebook for marketing, only 62% feel their investment in Facebook advertising has been profitable.
45. Brands post about five times a week on Facebook on average. Media brands post significantly more (73.5 times per week), while food and beverage companies post less (2.5 times per week).
Source
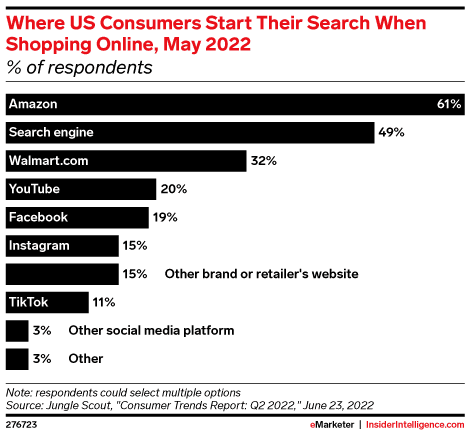
46. More than 70% of Facebook users check out local business pages weekly and 19% of US shoppers start product searches on Facebook, highlighting the importance of SEO strategies for fruitful outcomes.
47. After viewing a product or service in a Facebook Story, 58% of users visit the brand’s website for more details and 31% visit the store in person.
Facebook Consumer Behavior Statistics
So, are people actually shopping on Facebook? Absolutely!
Many users are not just browsing but actively buying from brands on Facebook. They’re using features like Facebook Marketplace and Facebook Shops to find and purchase products.
Check out these Facebook stats to know how people are shopping and interacting with brands on this platform:
48. Facebook and Instagram together are estimated to rake in about $94 million in social commerce revenue in 2024.
49. 19% of U.S. consumers begin their shopping search on Facebook. More people are turning to social media instead of search engines when researching their next buy.
Source
50. 58% of people have checked a brand’s website for more information after seeing a product or service in a Facebook Story.
51. 50% of people have visited a site to buy something after seeing it advertised in a Story.
52. 31% of people have gone to a store to check out a product after seeing it in a Story.
53. According to eMarketer, more US adults bought products directly on Facebook in early 2023. But for Gen Z, Facebook ranks fourth behind TikTok, Instagram, and YouTube.
54. Another eMarketer study shows that Facebook shopping is set to grow, reaching 67.8 million shoppers by the end of 2024.
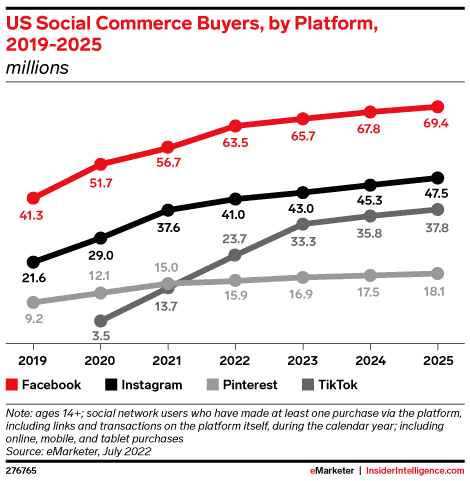
Source
55. 23% of global consumers say Facebook gives the best social commerce experience and 27% of global online shoppers prefer shopping on Facebook.
Conclusion
By now, you know that Facebook isn’t just for connecting with friends—it’s a powerful tool for businesses. With over 3 billion users each month, the potential is huge.
The insights on Facebook user behavior, engagement, and business trends go beyond numbers—they show how people shop, interact, and connect. This gives a clear path to grow your business.
By using these Facebook stats, businesses can create targeted strategies, run engaging campaigns, and post content that really connects with their audience. This helps you make the most of Facebook’s opportunities and boost your business effectively.