When it comes to social media marketing, Instagram is one of the most important platforms on which to ensure a presence. Nowadays, it’s imperative for brands to have a cross-channel social media strategy.
Instagram is a key part of this approach because only 0.2% of the platform’s users are unique to it. The rest are active on at least one other social media site, with 80.8% of Instagram users being active on Facebook, 52.8% on TikTok, and 77.4% on YouTube.
On top of that, Instagram has over 2 billion active users. That’s a large audience to tap into.
To fully understand how these people are engaging with your or your competitors’ posts, you need to use an Instagram engagement metrics checker, such as Keywords Everywhere. Below, we discuss how this metrics checker can be used to improve your Instagram marketing efforts.
What Are Instagram Engagement Metrics?
On any social media platform, engagement metrics reflect the level of interaction people have with your content. On Instagram, these metrics include the number of:
- Likes
- Comments
- Shares or saves
- Profile views
- Follows
Recent data shows that US adults spend 33.1 minutes on Instagram on average. That’s enough time for users to engage with a lot of posts as long as they’re interested in the content.
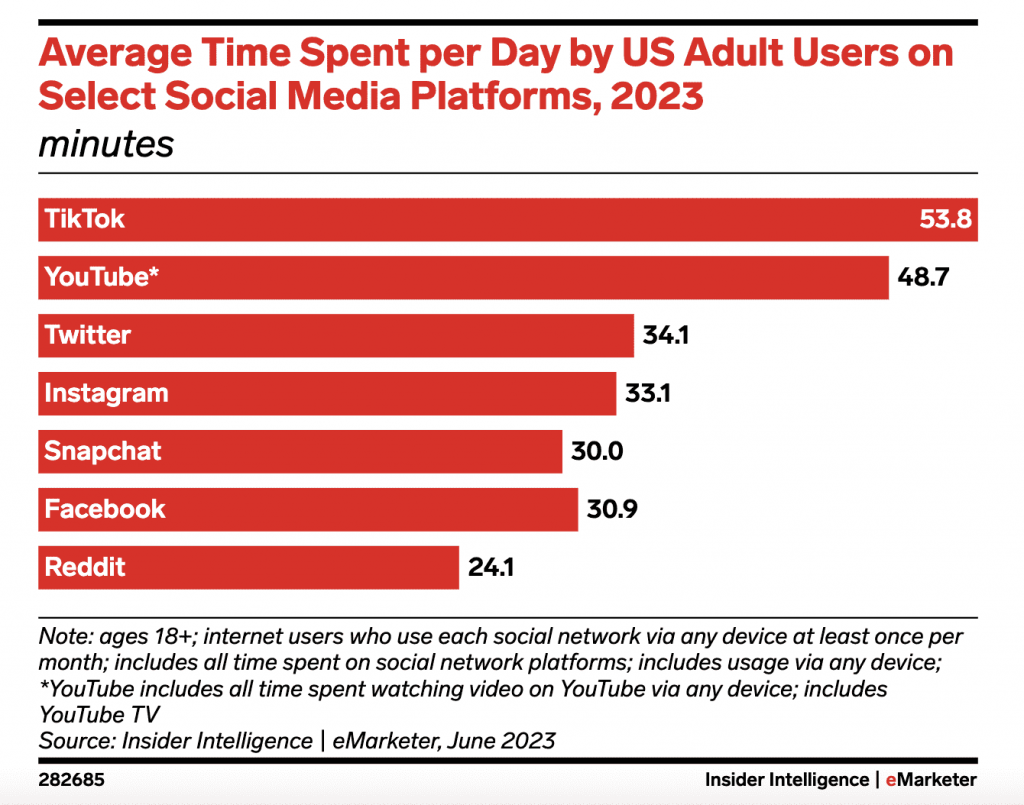
Source
As a business, you need to measure these metrics to gauge if your content is hitting the mark. Measuring Instagram engagement metrics is even more instrumental for brands with a younger audience because data shows most Instagram users are between 18 and 34 years old.
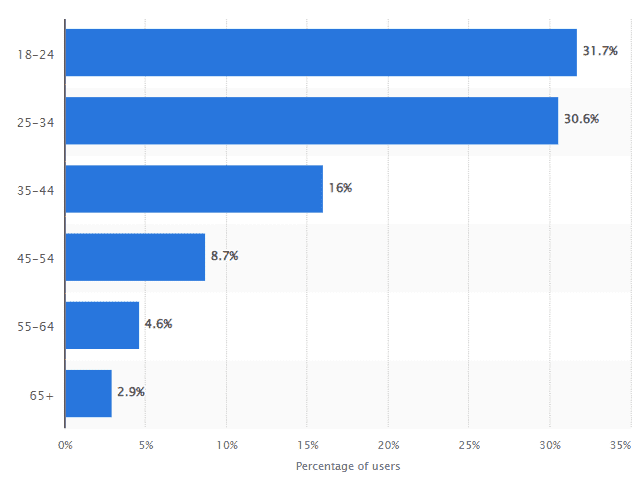
Source
Keeping this in mind, let’s take you through the process of using Keywords Everywhere to track your Instagram engagement metrics.
How to Use Keywords Everywhere to Measure Instagram Engagement Metrics?
You can use these steps to measure the engagement metrics for any Instagram page. As long as the extension is on, the data will load automatically for every page you visit.
Step 1: Visit Your Desired Instagram Page
Keywords Everywhere shows Instagram engagement metrics in a widget. You don’t have to do anything to make this widget appear. It will show up automatically when you visit any Instagram page.
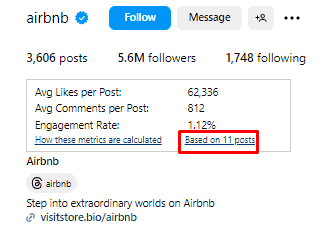
For this example, we used Airbnb’s Instagram page. The company has 5.6 million followers and a decent engagement, which would help showcase the extension’s use.
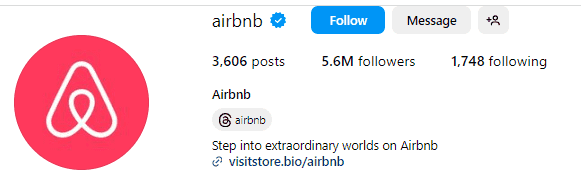
Source
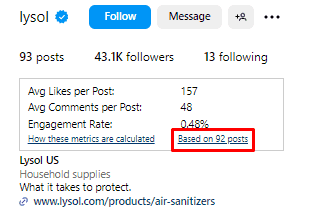
For comparison, we’ll also look at a page with a smaller following. We’re using Lysol’s Instagram page for comparison. It has 43.1k followers.

Source
Step 2: Analyze the Metrics
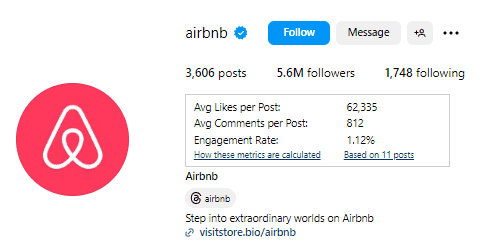
With the Keywords Everywhere extension active, you’ll see the engagement metrics widget right above the Instagram profile’s bio. This widget will give you an overall view of the engagement on that page.
Here’s what it shows:
- Average likes per post
- Average comments per post
- Engagement rate
Since Airbnb has a large, highly engaged following, you can see that their posts get over 62,000 likes on average with 812 comments.
The profile has an engagement rate of 1.12%, which means that for every 100 people following the page, one person interacts with each post.


On the other hand, Lysol’s engagement rate is significantly lower at 0.27%. This could be due to their smaller following or less engaging content.
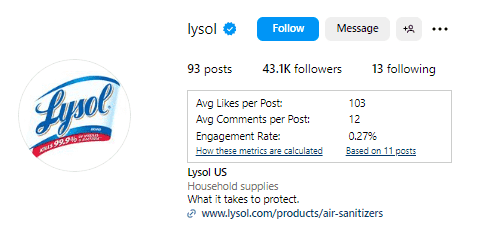
Lysol gets 103 likes and 12 comments per post on average.
Step 3: Load More Posts
Keywords Everywhere shows you the results based on the number of posts that have loaded when you visit the Instagram page. But what if you want to see more posts and get a better understanding of the engagement metrics?
To do this, simply scroll down the page. As more posts load, the engagement metrics widget will update and show you the new numbers.
You can keep scrolling until you reach the bottom of the page to get a comprehensive view of the engagement on that page.
In both of our examples above, you can see that the Keywords Everywhere data is based on 11 posts. We loaded a few more posts on Airbnb’s page to see how the engagement metrics change.
Now, the average number of likes per post is 11,000. Also, the average number of comments has decreased to 375. It indicates that the previous posts on this page have not performed as well as the recent 11 posts.
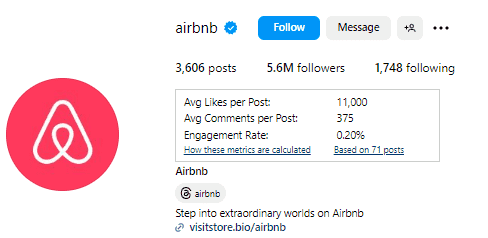
Airbnb’s engagement rate is also lower at 0.20%.
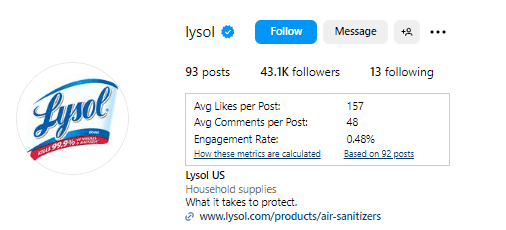
Since Lysol only had 93 posts on its page, we loaded all the way to the bottom to get a full picture of the engagement metrics.
The average number of likes per post is 157, while the comments per post have increased to 48. Similarly, the overall engagement rate has also increased to 0.48%.
Step 4: View the Posts the Data is Based On
You can click on the ”based on ”x” posts” in the Keywords Everywhere widget to see the posts the tool analyzed and show the results.
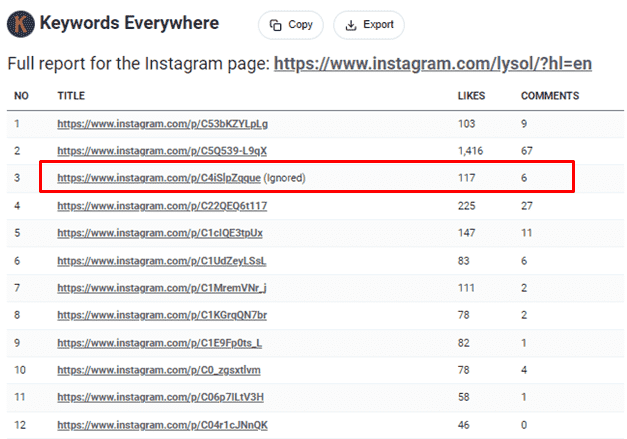
On Lysol’s page, we loaded all 93 posts, but the Keywords Everywhere data is based on 92 posts only. That’s because the tool has ignored one post.
Keywords Everywhere ignores the posts that appear as outliers. These are posts that might have gotten unusually high engagement. They are excluded from the analyzed data to prevent skewed patterns.
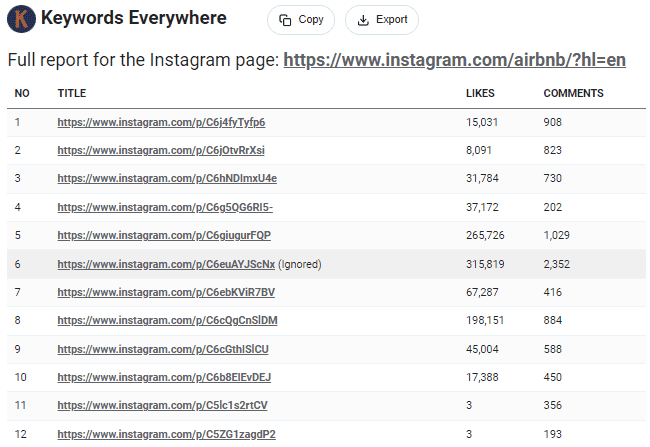
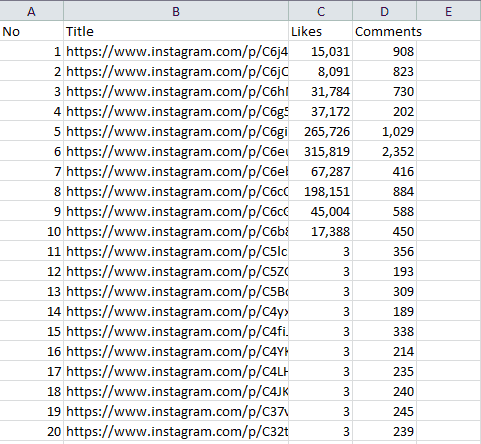
When you click on the link, the table will show you which posts have been ignored. It also shows the links to all the posts analyzed, along with their likes and comments.
Similarly, we loaded the table for Airbnb’s Instagram engagement metrics analysis.
Step 5: Export the Table
If you need the table for metrics analysis at a later time, you can export it in CSV format.
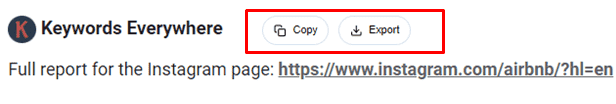
You can also simply copy the table into an Excel or Google Sheets document for further analysis.
Why Check Instagram Engagement Metrics?
As already established, Instagram is an important social media platform for any brand’s social media strategy. Knowing how well your content performs on the platform is a must.
But that’s not the only reason you need an Instagram engagement metrics check. Here are a few other reasons to use Keywords Everywhere for the job.
Analyze Content Performance
The Keywords Everywhere Instagram metrics tool allows you to analyze the performance of your Instagram posts. You can also see how your content stacks against your competitors.
If they have the same number of followers as you but seem to get more engagement on their posts, you can analyze the content to see what works for them.
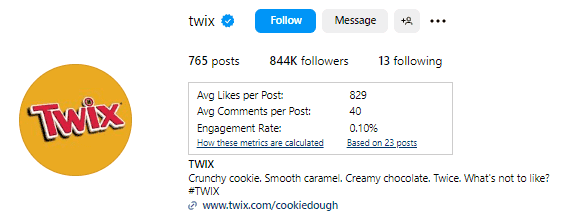
Let’s suppose we’re the social media marketers behind Twix’s Instagram page. The page has 844k followers.
Our Instagram engagement metrics widget shows that the average number of likes per post are 829 and the number of comments are 40. The page has an engagement rate of 0.10%.
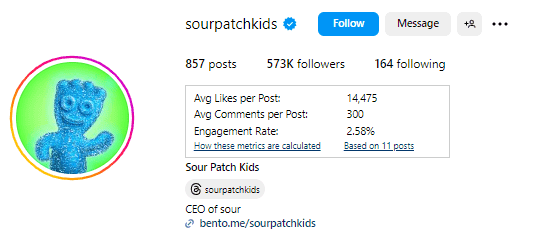
Now, let’s compare this page to another of its sort. We went to the Sour Patch Kids Instagram page.
Even though it has fewer followers (573k), the engagement was much higher at 2.58%. Also, each post gets 14,475 likes on average and rakes 300 comments.
Being Twix’s social media marketer, we could use these results to establish that Sour Patch Kids’ content must be more engaging. Then, we can go in to see what type of content they’re posting to get such high engagement.
A quick scroll through their Instagram page shows that Sour Patch Kids leverages pop culture references and viral trends to create fun and relatable content.

On the other hand, Twix’s content is just videos of their product and the occasional promotional post.

Our analysis highlights the need for a more diverse content strategy, particularly one that incorporates popular trends and references, since our audience seems to respond well to that type of content.
Not only can we use this information to improve our current Instagram strategy, but we can also use it as inspiration for future campaigns and posts.
Conduct Competitor Analysis
In the same vein, you can also use an Instagram engagement metrics checker to see how well the audience is responding to your competitors’ content.
Look for competitors that are unable to catch the audience’s attention. What is their content lacking?
Attempt to fill that gap to make your content stand out.
Conduct Influencer Research
Another use case for an Instagram engagement metrics checker is that it can help you find the right influencers for your campaigns.
Often, influencers may have hundreds of thousands of followers, but their engagement levels may be low.
Their audience is not as active or interested in the content, which may not give you the desired ROI for your campaign. Keywords Everywhere helps you conduct quick influencer research by showing you their engagement metrics, making it easier to find influencers who can get you the best results for your campaigns.
For example, let’s say you’re looking for a beauty and lifestyle influencer. You want a mid-level influencer with a decent following and engagement.
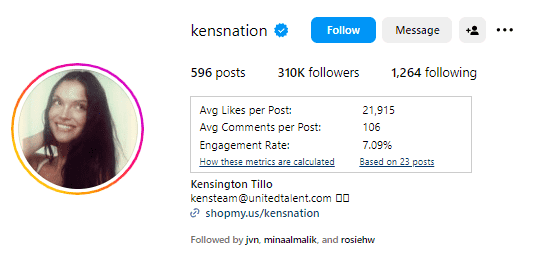
Kensington Tillio (@Kensnation on Instagram) has 310k followers, which is ideal for your campaign. Keywords Everywhere shows that she has an impressive engagement rate of 7,09%, with posts getting 21,000+ likes and over 100 comments on average.
Another similar influencer is Danielle Carolan, who has 269k followers. While there’s a slight difference in the number of followers, her engagement rate is much lower at 3.35%. That’s almost half of Kensington’s engagement rate, making her a less ideal choice for your campaign.
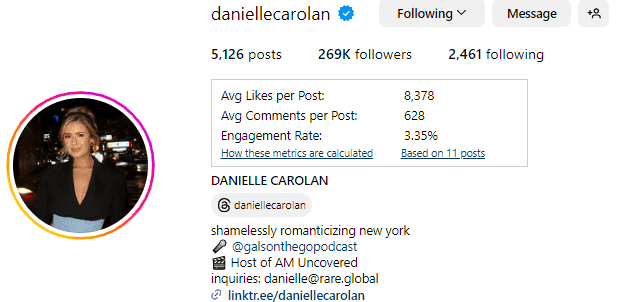
However, her posts get over 600 comments on average.
So, if you want to run a campaign where you need more eyes on your posts, Kensington might be the better choice. If you’re launching a new product, she can get your word across to more people.
But if you want more comments and interaction with your audience, Danielle may be a good option. For example, she may be a better influencer to run contests and giveaways with.
You can do the same research for multiple influencers in your niche and use the engagement metrics to make an informed decision.
Study Engagement Trends
The table Keywords Everywhere creates shows you the number of likes and comments for each of your posts, providing insights into when your posts reach the highest engagement levels.
Collecting these metrics manually can be tedious. But with a table in front of you, it’s easy to derive insights.
Are there specific days or times when your posts get more engagement? For example, if you notice that all content posted over the weekend gets the highest engagement, you could try to post more during that time.
Maybe you notice that carousel posts or Reels get more comments and likes than other posts. That’s a sign your audience enjoys more interactive and visual content.
Create more of this content.
Research also shows that Reels have an average reach of 30.81%, which is higher than other content formats. Reels also get 2x more impressions than image posts.
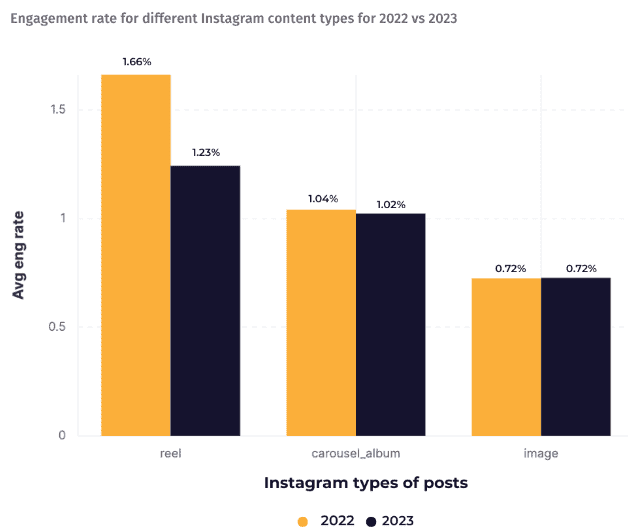
Source
Similarly, you can notice monthly or seasonal trends in engagement, too. For example, as a retail business, you may notice that your posts get the most engagement at the beginning of the month.
It’s likely because people have just received their paychecks and are more willing to spend money.
You could post promotions or sales during this time to maximize engagement and potential sales.
Conclusion
Since visual content, particularly video content, is ruling the social media marketing space, your Instagram marketing strategy must be top-notch.
Keywords Everywhere can help in this regard by allowing you to monitor your Instagram engagement metrics. You can also use the tool to keep an eye on your competitors’ engagement trends and measure your performance against theirs.