It wouldn’t be wrong to say that most marketing is digital now. Even when traditional methods are used, digital tactics supplement them.
Digital marketing is a mix of social media, content, emails, online ads, and influencer content. Besides, we’re now seeing the rise of user-generated content and video marketing. Together, these digital marketing strategies help curate a plan that allows businesses to establish their presence on multiple online platforms.
To understand which of these digital marketing strategies are most relevant and how they’re impacting businesses, we’ve put together a list of digital marketing stats that you should know.


General Digital Marketing Stats
The digital marketing industry spans across multiple verticals, and its impact can be seen in various aspects of a business, from brand awareness to lead generation and sales. In general terms, the growth and success of digital marketing cannot be denied; the numbers speak for themselves.
1. In 2025, the global digital marketing market size will reach $472.5 billion. It is expected to grow to reach $1.3 trillion by 2033. The key factors accelerating this growth are the increase in internet service penetration and a high social media usage rate.
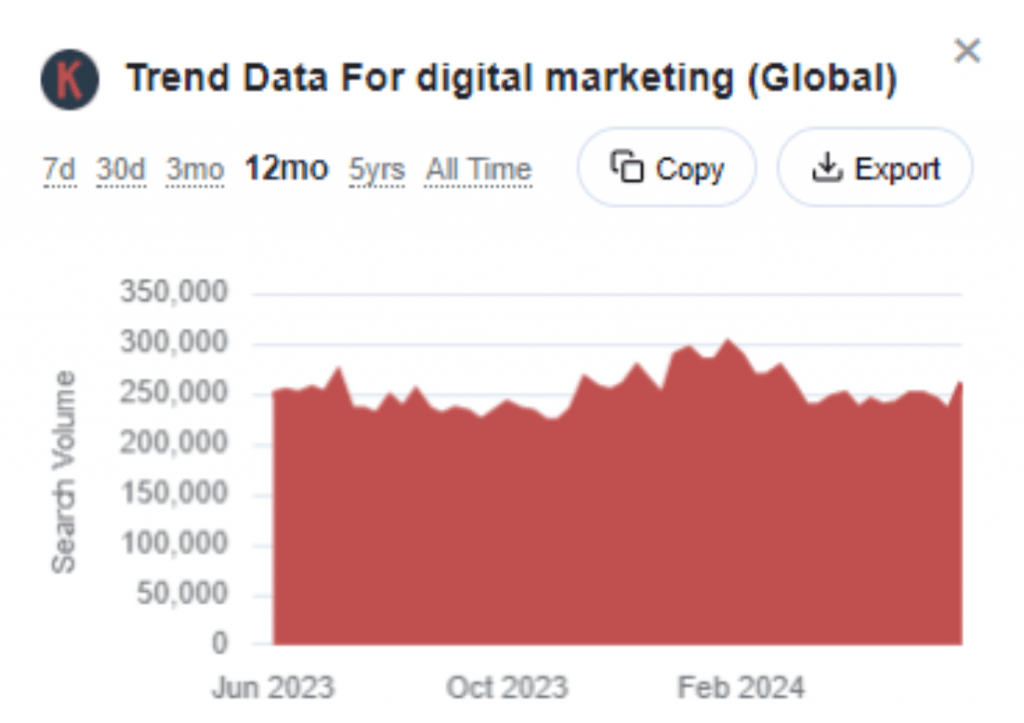
2. Keywords Everywhere data shows that the organic search for ”digital marketing” consistently remains high in trend. The keyword also gets over 100,000 organic searches per month, indicating its popularity and the need for businesses to invest in it.
3. Of all digital marketing channels, 38.5% of marketers believe that social media has the highest return on investment (ROI), whereas 15.4% of marketers believe affiliate marketing to be the most lucrative. Other significant channels for digital marketing are email, content marketing, SEO, and PPC advertising.
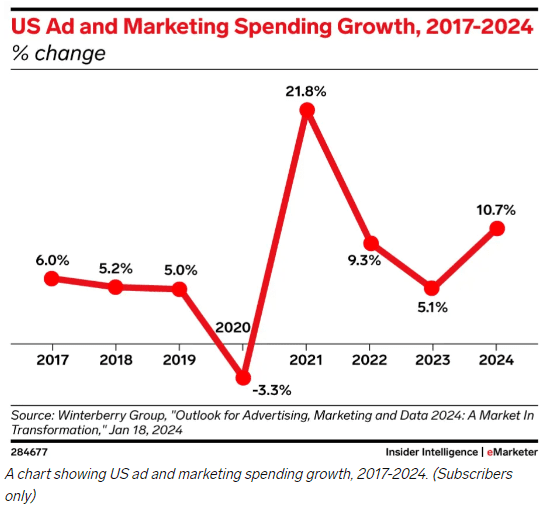
4. Online ad and marketing spending has increased by 10.7% in the US in 2024, more than double the 5.1% it was in 2023.
Source
5. Marketers in the US spend over $90 billion on traditional search, followed by $86.75 billion on social media and $58.99 on TV.
6. Around 94% of small businesses are planning to increase their digital marketing spending in 2025.
SEO Marketing Stats
Search engine optimization (SEO) is the backbone of any digital marketing strategy. With Google being the primary search engine used globally, businesses need to understand the importance of SEO and its potential impact on their online presence. Here are some statistics that highlight the significance of SEO in digital marketing.
7. 68% of all online experiences begin with a search engine. These experiences range from finding a new product to researching a service or a company.
Source
8. 39% of all purchases Internet users make are influenced by a search they conducted about a product or service.
9. Organic search remains the top traffic source for all websites globally.
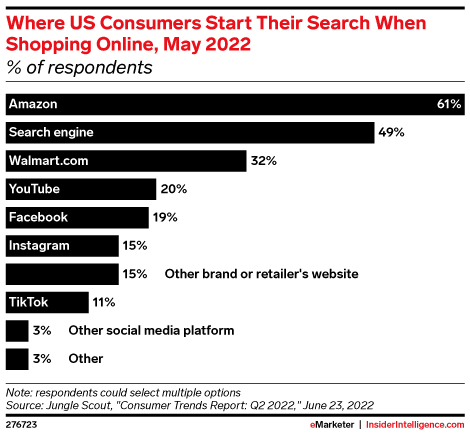
10. 49% of customers in the US search for a product on a search engine when shopping online.
11. Featured snippets, the summary of an answer displayed on top of Google’s search results, account for anywhere from 50% to 65% of the real estate on Google’s first page.
12. Keywords Everywhere data shows that Google SERPs have 4.4 fresh listings on average for a given keyword. These are websites that weren’t present on the first page 1 year ago.
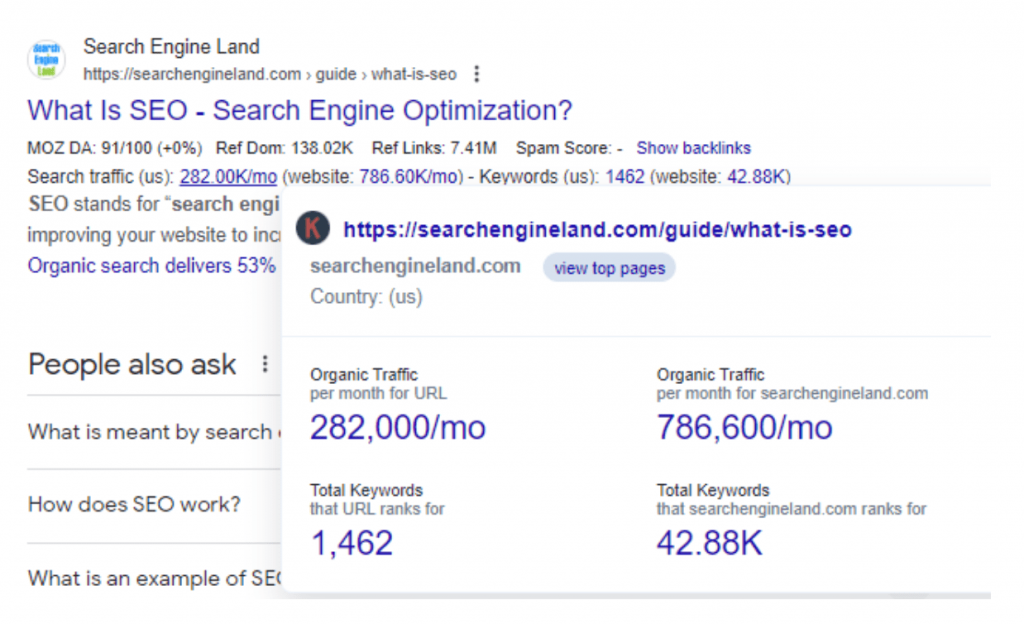
13. According to Keywords Everywhere, the first search result for the keyword ”search engine optimization” gets 282,000 organic visits per month.
14. On average, the keywords that top-ranking sites rank for are 3.2 to 2.5 words long.
15. Nearly 73% of the websites have reciprocal links. These are links exchanged between two sites to boost their SEO value.
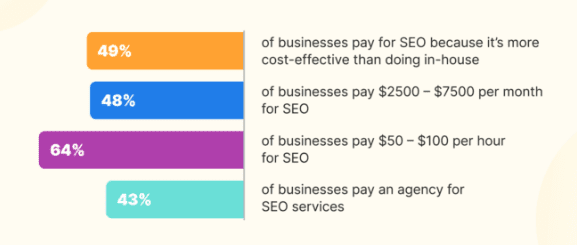
16. Nearly half (49%) of the companies pay for external SEO services from SEO agencies or freelancers because it’s cheaper than hiring in-house experts.
Source
17. 81% of customers search for local business reviews on Google, which shows the importance of local SEO for businesses.
Social Media Marketing Stats
Social media is another integral component of digital marketing, especially as new platforms like TikTok and Threads have emerged. Here are some key statistics on social media marketing.
18. About 5.17 billion people in the world use social media, which represents over half the global population.
19. On average, a social media user is present on 6.7 platforms every month.
20. In 2024, the total expenditure on social media marketing is projected to reach $219.8 billion.
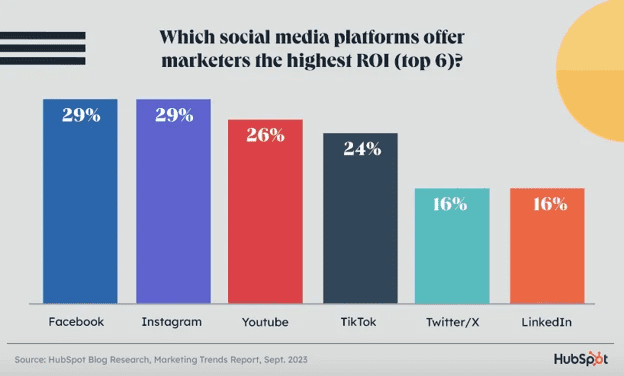
21. Both Instagram and Facebook tie in terms of the highest ROI, with 29% of businesses stating high ROI on these platforms. Meanwhile, 26% of marketers opt for YouTube, while 24% go for TikTok.
Source
22. While 89% of marketers use Facebook for digital marketing, Instagram is in second place, with 80% of marketers using it.
23. On average, Americans spend 31 minutes on Facebook daily compared to 53.8 on TikTok and 48.7 on YouTube.
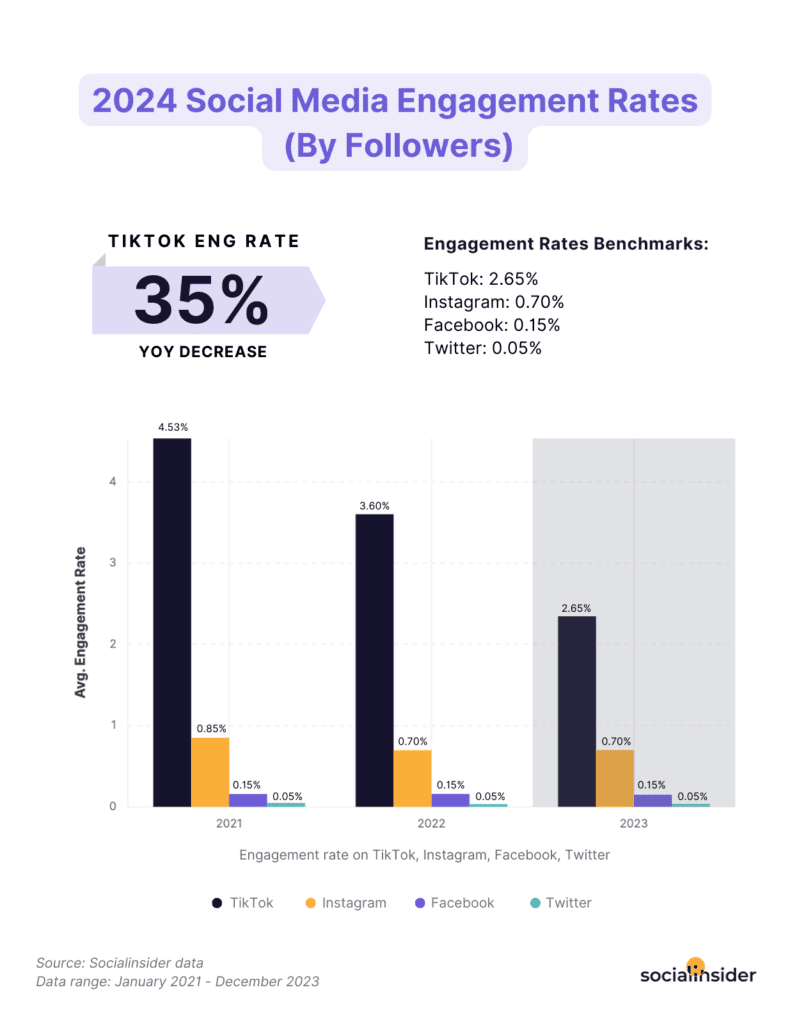
24. Instagram has a much higher engagement of 0.60% compared to 0.15% of Facebook. On the other hand, TikTok has a high engagement of 2.65%, which is a 35% year-on-year increase from 2023 to 2024.
Source
25. Statista forecasts that TikTok will have more than 2 billion users in 2024.
26. TikTok is a widely used app around the world, as people spend 34 hours per month on it.
Voice Search Stats
Voice search has recently gained immense popularity due to its accessibility and convenience. People are now able to search for information or make commands without having to type simply by using their voice. Here are some statistics that reflect this shift.
27. 13% of marketers use voice search optimization in their marketing strategy since it is the go-to mode of communication for most customers.
28. According to Edison Research, more than 1 in 3 Americans have a smart speaker, such as Amazon Echo or Google Home.
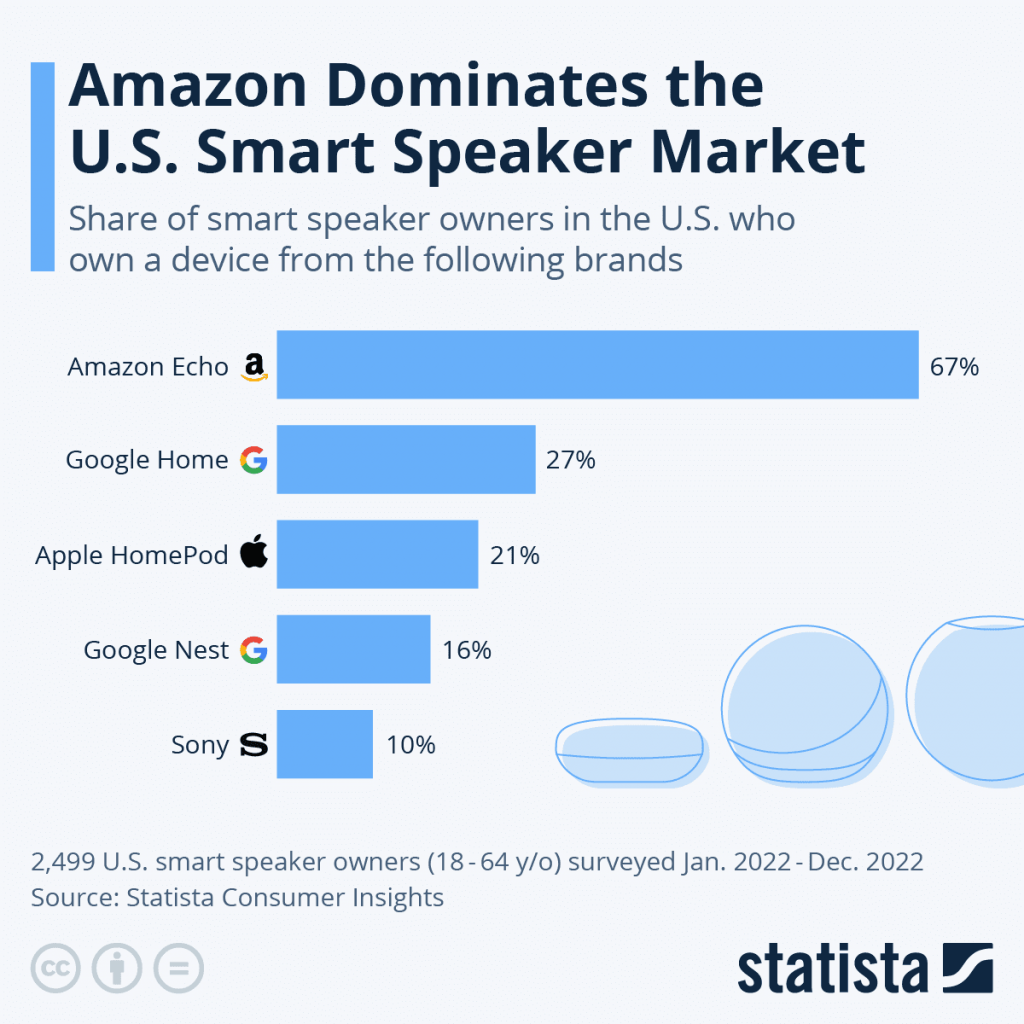
29. Amazon is the leader in the US smart speaker market, as it accounts for 67% of all market share in the country. It is followed by Google Home, which has 27% of the market share, and Apple HomePod, which has 21% of the market share.
Source
30. There are 8.4 billion digital voice assistants in use, a massive increase from just 3.25 billion in 2019.
PPC Advertising Stats
Pay-per-click (PPC) advertising is a popular form of online advertising where advertisers pay a fee each time their ad is clicked on. Marketers run PPC ad campaigns on Google Ads, Bing Ads, and other platforms to drive traffic to their websites or landing pages.
The following statistics show the importance of PPC advertising in today’s digital landscape.
31. On average, small to mid-sized businesses invest $100 to $10,000 on PPC ads.
32. Search ad spending is forecasted to reach $306.7 billion in 2024, indicating the growing importance of PPC advertising.
33. By 2028, this market volume will rise to $417.4 billion at a compound annual growth rate (CAGR) of 8%.
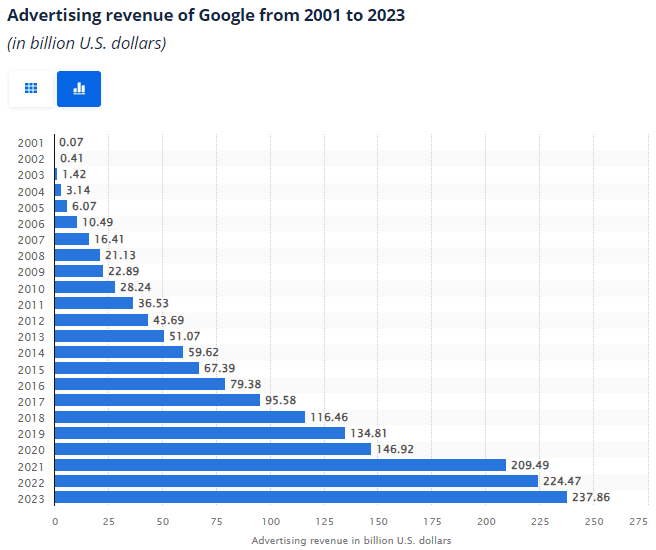
34. Google’s advertising revenue is valued at $237.86 billion, which makes sense considering the platform’s dominance in the search engine market.
Source
35. Most of the PPC ad spending will be in the US, estimated at $132 billion in 2024.
36. On average, the ad spending per internet user in search advertising is $55.5 in 2024, meaning that marketers are investing heavily in PPC advertising to reach their target audience effectively.
37. Statista’s forecast shows that mobile advertising spending will reach $399.6 billion by 2024. Since most web users access the internet through their smartphones, it’s understandable that a significant portion of PPC ad spending is allocated to mobile advertising.
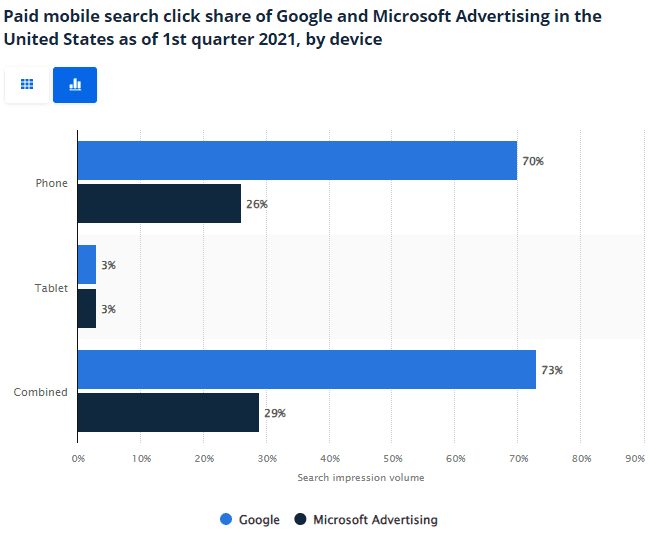
38. Google holds 70% of the market share in paid mobile search, compared to 26% of Microsoft.
Source
39. PPC advertising can bring in $2 for every $1 you spend, translating to 200% ROI, provided you have a well-planned and executed campaign.
Email Marketing Stats
Even today, email marketing is just as effective as it was before social media became such a huge thing. The reason for this consistent success is the fact that email marketing offers a direct and personalized way of reaching out to potential customers.
Let’s look at some email marketing statistics for you to understand what works in this realm of digital marketing.
40. There are 4.48 billion email users in the world, and most of them reside in the US.
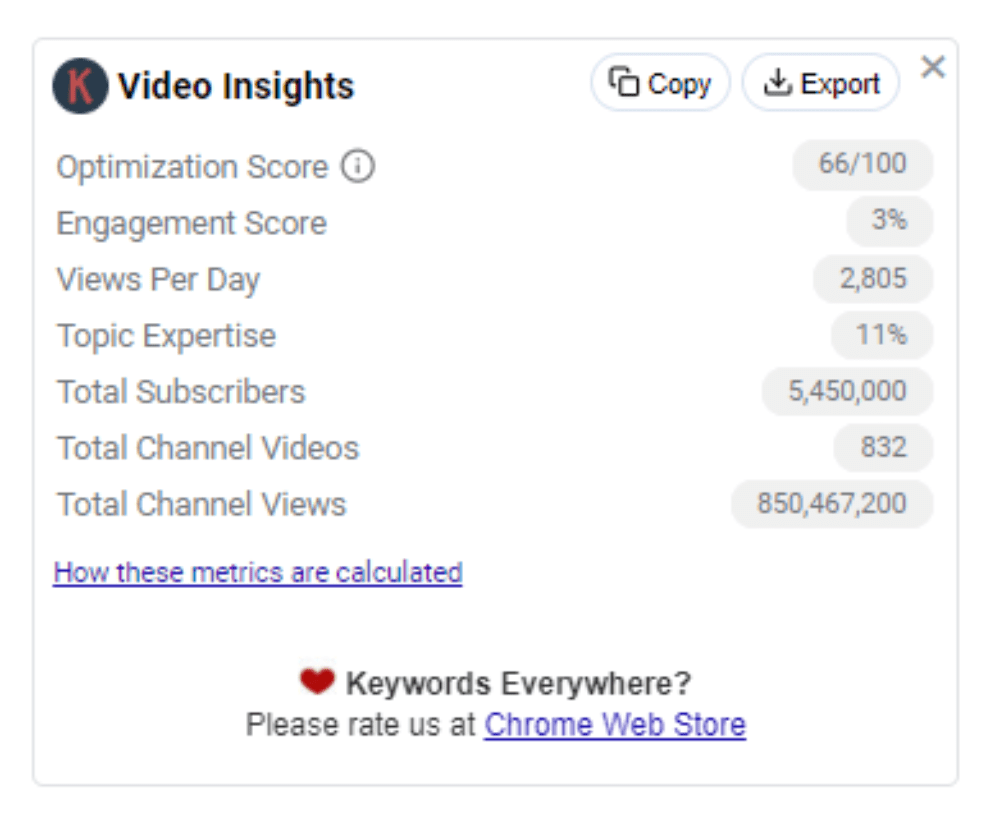
41. The global email marketing revenue is valued at $9.7 billion.
42. Statista forecasts that email marketing revenue will reach $17.9 billion by 2027 at an annual growth rate of 13.3%.
43. The subscription rate for email lists is approximately 0.22% across all industries.
44. The bounce rate, which is the percentage of undeliverable emails, is under 1%. While the hard bounce rate (due to an invalid email address) is around 0.21%, the soft bounce rate (due to a temporary issue with the recipient’s email server) is only 0.7%.
45. The highest open rate for emails is in Australia, with 38.8% of emails getting opened in the country.
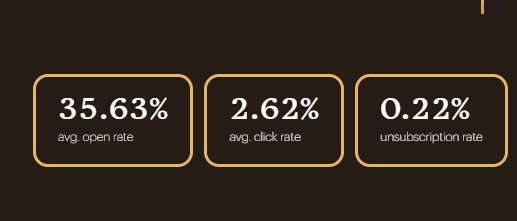
46. The average open rate for emails is 35.6% across all industries, while the average click rate is 2.62%, which means most people open and read your emails, but only a fraction of them click through.
Source
47. According to a survey, 85% of marketers add social media links to their email footers.
48. In a survey, 16% of marketers said that the leading objective for using email marketing was product awareness and promotions. 14.6% of marketers regarded retention as their primary goal, and the same percentage also opted for newsletters.
49. In another survey, 30% of global marketers said they saw a 10% to 20% open rate for their email campaigns, whereas 57.8% of marketers said the open rate for their emails is between 20% and 50%.
50. Spam messages account for almost half (46.8%) of all email traffic. The largest number of spam emails are generated by Russia, with 31.5% of all global spam emails originating from the country in 2022.
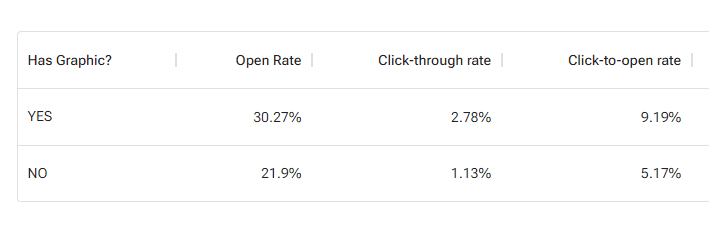
51. Image-based emails have a high open rate of 30.27% compared to text-only emails, which have an open rate of 21.9%.
Source
52. About 64% of email recipients aged between 55 and 64 report opting out of mailing lists always or most of the time. On the other hand, 53% of those aged 18 to 24 also report that they most often opt out of email lists.
53. In a survey, 40% of marketing professionals from Europe and the US said that image and content generation were the most interesting use cases for AI in email marketing. Meanwhile, 34% of respondents said that the top feature of AI for email marketing is the personalization of newsletters and email content.
54. 51% of marketers from the US and Europe reported that AI-supported email marketing is more effective than traditional email marketing methods. On the other hand, 20% of marketers said they did not see any difference between both approaches or that both had the same results.
Content Marketing Stats
Content continues to be king, especially now that there are millions of websites and blogs competing for attention. Gone are the days when content was just text. Today, it also pertains to videos, infographics, social media posts, GIFs, webinars, and images.
Together, these content formats bring organic and paid traffic to a website. Let’s look at some insightful stats.
55. Statista forecasts that the global content marketing revenue will be $107 billion by 2026. That’s quite a notable increase from $63 billion in 2022.
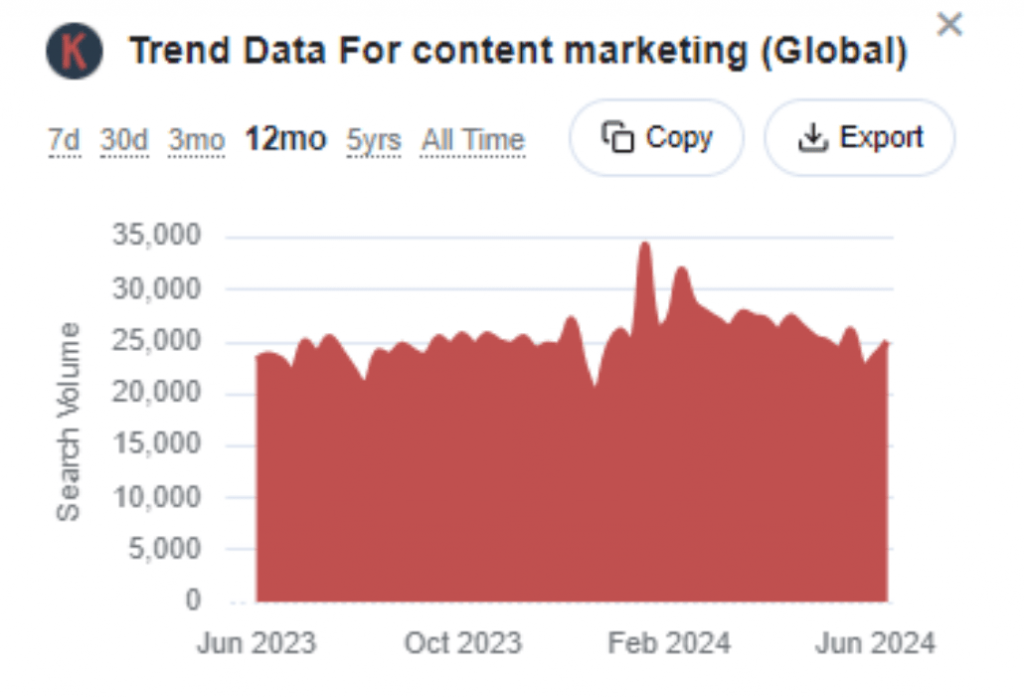
56. According to data from Keywords Everywhere, the organic search for ”content marketing’‘ has been high in the past 12 months. There’s a consistent demand for this topic, which also means that content marketing strategies will continue to be relevant for businesses.
57. In a B2B content marketing survey, 43% of respondents said they would increase their content marketing spending in the next year.
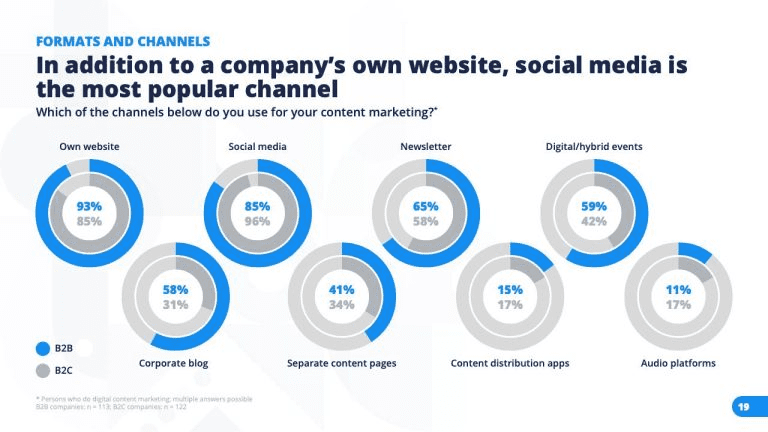
58. According to 93% of B2B businesses, their website is the most effective channel for content marketing. On the other hand, 85% of B2C businesses use their website as the primary channel for content marketing.
Source
59. 71% of marketers believe that content marketing is now more important than it was before.
60. According to HubSpot, the most common type of content marketers produce is video. The trend has remained consistent over the past four years, indicating the increasing importance of video content.
61. 84% of B2C marketers make their content different from other businesses by improving its quality. 74% of content marketers also tackle topics their competitors haven’t addressed.
62. According to 80% of bloggers, they drive results from their blogs. However, half of them struggle to keep their readers engaged.
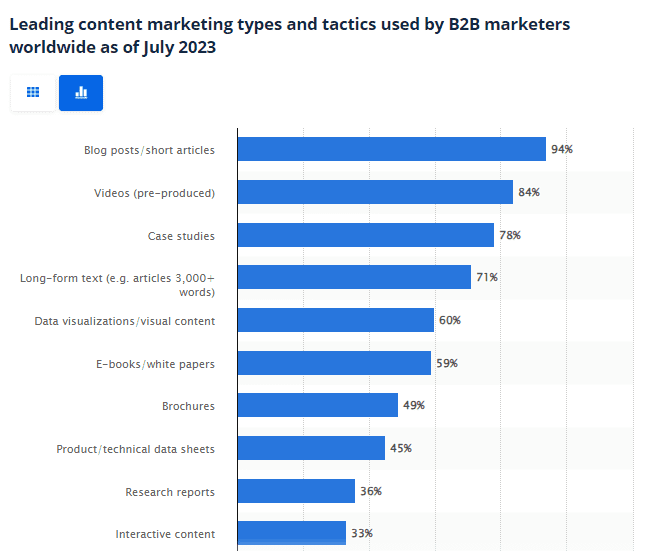
63. 94% of B2B marketers use blog posts in their content marketing strategy, followed by 84% who use videos and 78% who use case studies.
Source
64. Articles that have a video get 70% more traffic than articles without a video.
65. Keywords Everywhere data shows that a video with over 2 million views has an average engagement score of about 3%. The engagement score also depends on the length of the video and the topic being covered.
66. Backlinko analyzed hundreds of social media posts and discovered that the best social media content length to maximize shares is anywhere from 1,000 to 2,000 words.
67. 47% of companies make product demo videos, while 35% create explainer videos as a part of their content marketing campaigns.
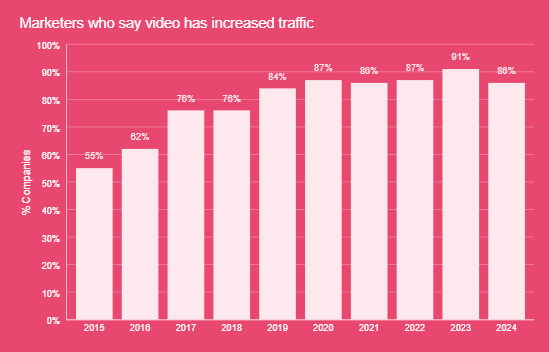
68. 86% of marketers report that their web traffic increases when they use video content.
Source
Marketing Automation Stats
Marketing automation helps streamline marketing processes, save time and resources, and ultimately drive better results. From email scheduling to lead nurturing, automation has made its way into many aspects of digital marketing.
Marketers have hundreds of marketing automation tools at their disposal to help them execute their strategies effectively. These statistics will provide some insights into the current state and future of marketing automation.
69. According to HubSpot’s Marketing Strategy Report, 64% of marketers use automation or AI. 38% of marketers who do not use automation yet plan to start using it in 2024.
70. 44% of marketers say that their customer journeys are partially automated, while 25% say that they are fully automated. On the other hand, 21% of marketers report not automating their customers’ journeys.
71. In a survey, 63% of marketing leaders said that they use automation in email marketing, while 50% said they use it in social media marketing. About 40% of marketers also automate their paid ad campaigns.
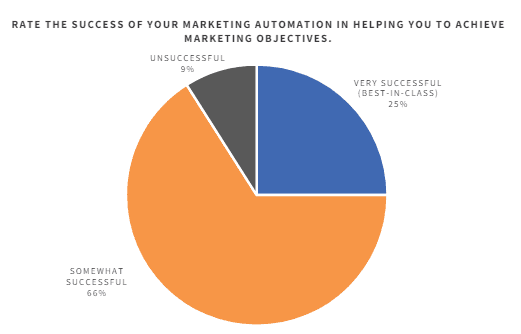
72. 66% of marketers who use automation to achieve their marketing objectives say that they have been somewhat successful, while 25% report they are very successful.
Source
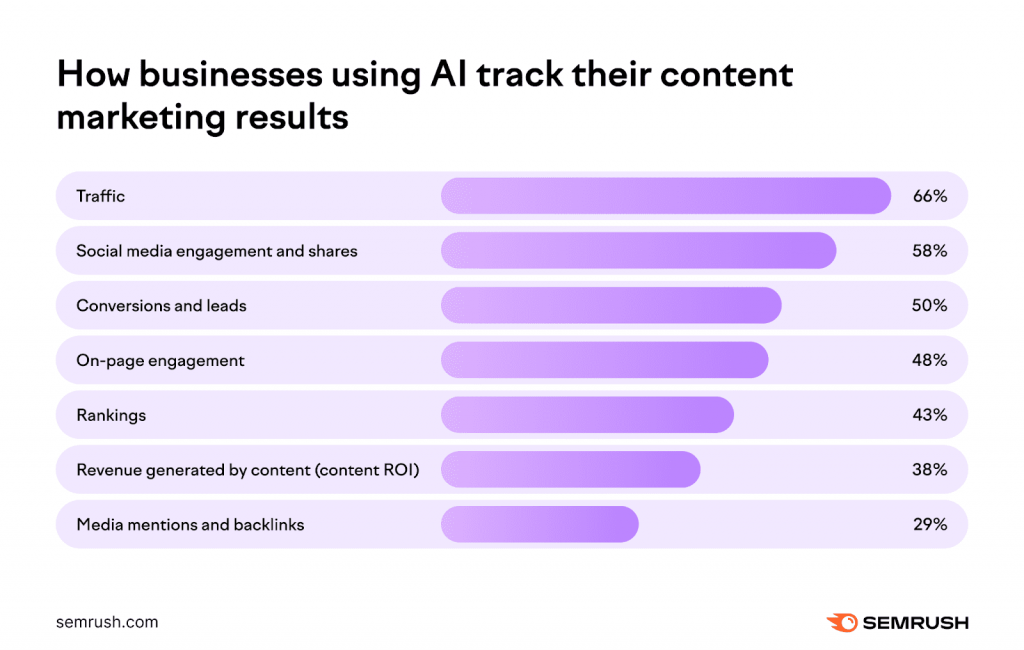
73. Businesses that use AI in their content marketing efforts traffic the following metrics: traffic (66%), social media engagement and shares (58%), conversions and leads (50%), and on-page engagement (48%).
Source
74. For 43% of marketers, their primary objective for improving marketing automation is to optimize their overall strategy, whereas 37% of marketers want to enhance their marketing automation efforts to improve data quality. Other objectives include the identification of ideal prospects, optimization of messaging, increase in personalization, and decrease in marketing costs.
75. In the future, 29% of marketers plan to use marketing automation in social media management, 29% in paid ads, 28% in email marketing, 21% in landing page optimization, and 21% in SMS marketing.
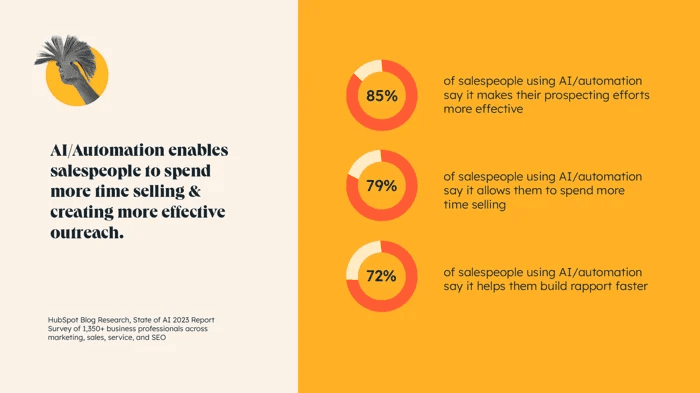
76. 79% of salespersons who use AI or automation say that it helps them spend more time selling, while 72% say that it allows them to build rapport faster.
Source
AI in Digital Marketing Stats
Besides automation, AI is also a big part of modern digital marketing. It helps marketers create content, generate images, write emails, personalize content, and do a lot more. Here’s a list of statistics related to the use of AI in digital marketing.
77. 68% of businesses see a higher content marketing ROI when they use artificial intelligence.
78. On average, sales reps save 2+ hours a day with AI, while content marketers save 3+ hours in generating content.
79. According to 65% of business leaders, if AI is properly implemented, they expect their business to experience unprecedented growth.
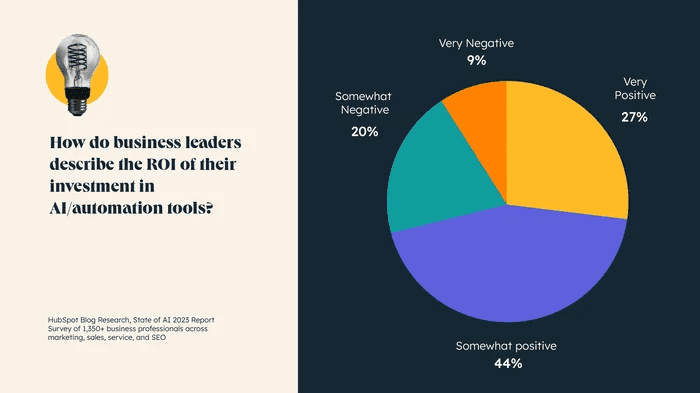
80. 44% of marketers say that the ROI of using AI in marketing has been somewhat positive, while 27% say it is very positive. On the contrary, 9% say it is very negative, while 20% say it is somewhat negative.
Source
81. Similarly, 69% of business leaders say that AI can help their companies in a way that wouldn’t be possible without it.
82. 76% of respondents to a survey believe that AI should be used in marketing roles, but one should not rely on it completely.
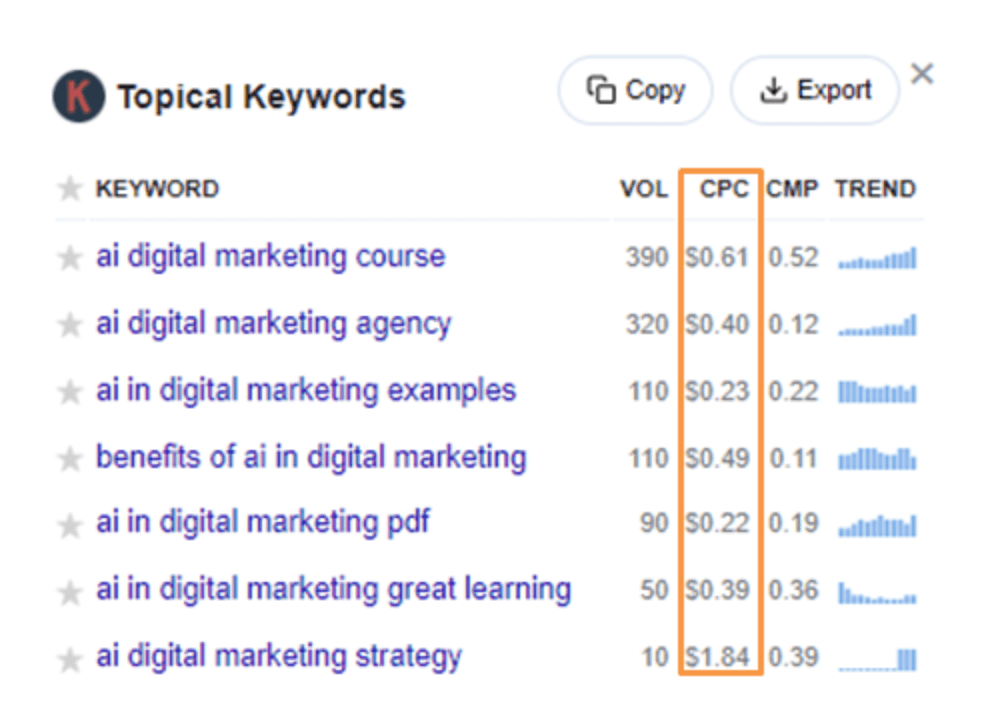
83. Keywords Everywhere data shows that the CPC for keywords related to the use of AI in digital marketing is quite high, going over $1 in some cases. A high CPC is indicative of high competition in the market, which further emphasizes that the future will see even more businesses incorporating AI in their marketing strategies.
Digital Marketing Personalization Stats
Nowadays, customers don’t want to be another face in the crowd. They want personalized experiences that cater to their individual needs and preferences. Due to this, digital marketing has shifted towards personalization as a key strategy to attract and retain customers.
Let’s look at some statistics that showcase the importance and impact of digital marketing personalization.
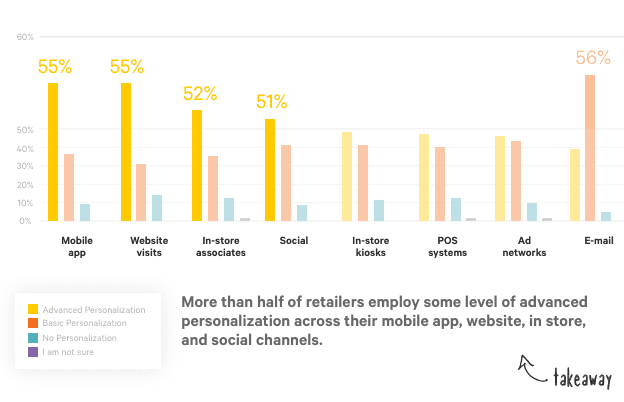
84. 55% of marketers use advanced personalization for mobile apps, compared to 55% for website visits, 51% for social media, and 56% for email.
Source
85. According to 58% of business leaders, AI chatbots will be the most influential AI personalization technology in the future.
86. 3 in 4 customers are likely to buy from businesses that offer them a personalized experience. These consumers also spend 37% more time with such businesses, indicating the impact of personalization on customer lifetime value.
87. In a Segment report, 89% of marketers said that personalization will be valuable to the success of their business in the next three years.
88. 40% of business leaders believe that personalization is a cross-functional responsibility across the marketing department and other teams.
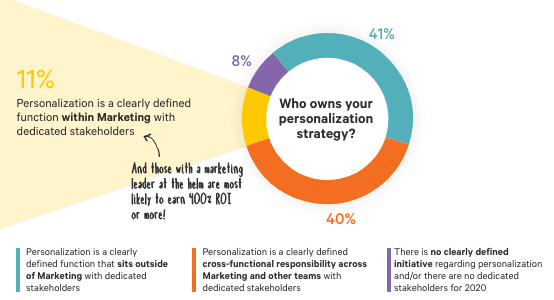
Source
89. 73% of brands believe that the incorporation of AI in digital marketing will change personalization. However, 61% of businesses are also concerned about the inaccuracies in data resulting from AI personalization.
90. In a Deloitte survey, 78% of customers said that they want marketing personalization that helps them save money. 84% of consumers said that bundles and discount offers have a medium to high influence on their purchasing decisions.
91. Compared to their counterparts with low personalization, businesses with mature personalization strategies are 71% more likely to see high customer satisfaction and 48% more likely to exceed their revenue goals.
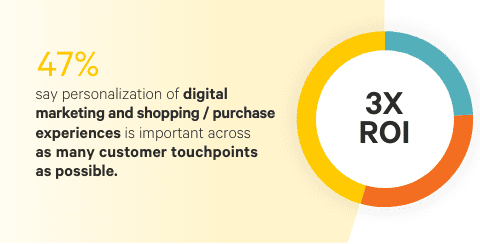
92. According to 47% of marketing leaders, personalization of digital marketing experiences is important across as many customer touchpoints as possible since it helps increase the ROI by 3x.
Source
93. Business leaders who self-rate their company’s personalization capabilities to be high are 2x more likely to achieve revenue growth of 10%+ compared to their counterparts with less mature personalization efforts.
Conclusion
As evident from these statistics, digital marketing will continue to be important in the future. Its faces and platforms might change, but the core principles will remain the same.
It’s up to you to adapt to the dynamic landscape of digital marketing and use current trends to your advantage. Keeping an eye on digital marketing stats gives you an idea of what’s currently hot and what’s not. You can then use this information to guide your strategy and make data-driven decisions.