Buy Now, Pay Later has moved from a convenient payment option to a major force shaping how people shop both online and in physical stores.
It’s influencing checkout design, boosting customer spending, and giving shoppers more control over how they pay.
With millions of users worldwide and adoption climbing every year, BNPL is now a core part of the retail and e-commerce landscape.
Today, we’ll share the latest BNPL stats covering consumer demographics, market size, usage trends, top purchase categories, and leading companies in the space.


Top BNPL Stats: Quick Overview
Buy Now, Pay Later has shifted from being a niche payment option to a mainstream way for millions of people to shop without paying everything up front.
The industry has grown at an incredible pace and is fueled by changing spending habits, online shopping trends, and more flexible credit alternatives.
Here are the top BNPL stats that show just how significant this shift has become.
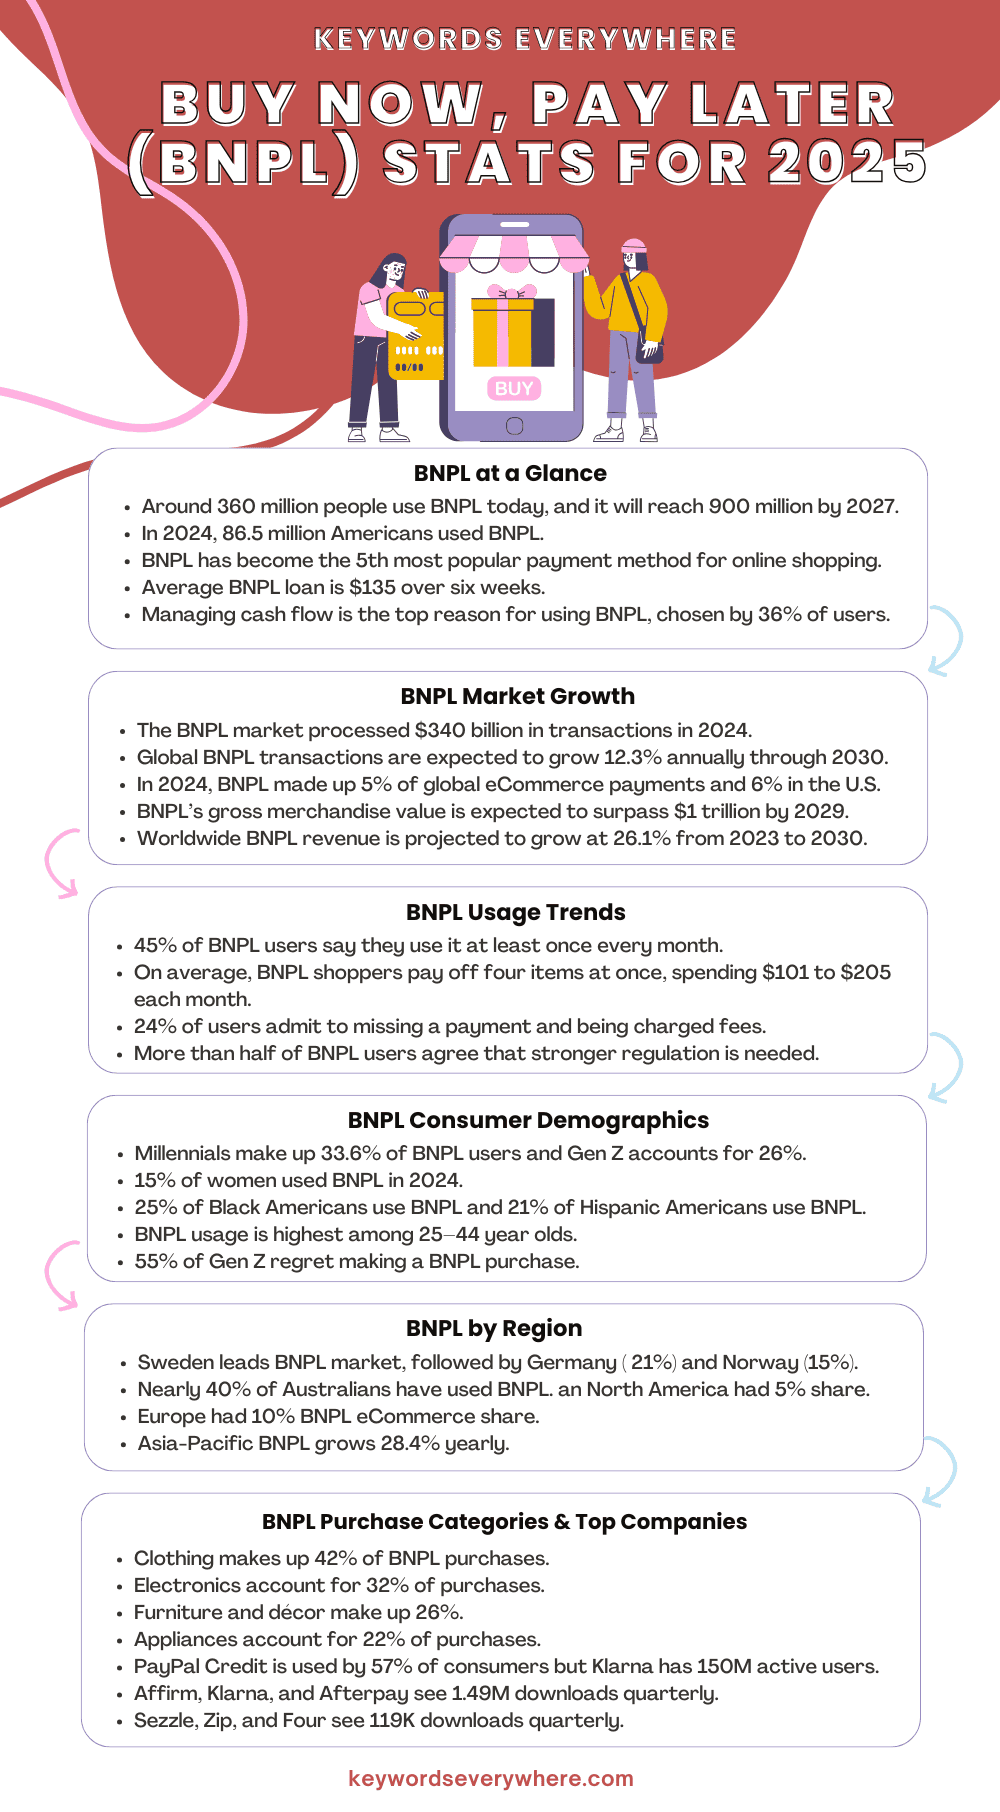
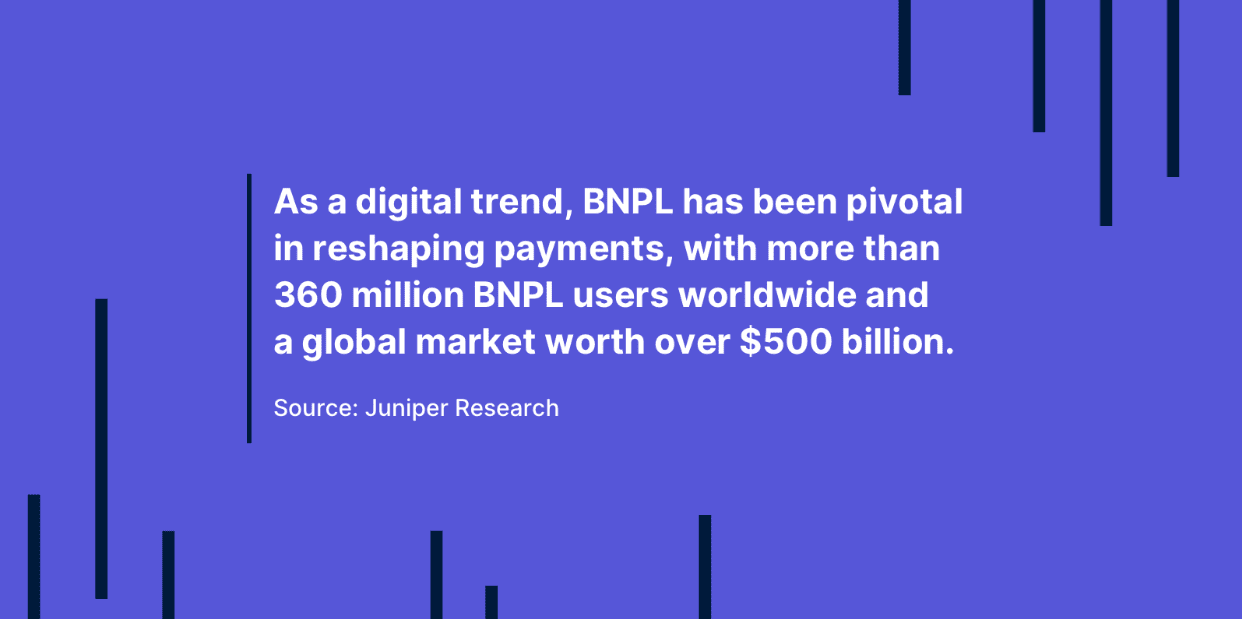
1. BNPL is used by around 360 million people today, and that number is expected to climb to 900 million by 2027 — a jump of 157%.
BNPL users 2025
2. In the U.S., about 86.5 million people used BNPL in 2024, which is nearly 7% more than the year before.
3. BNPL is now the 5th most popular way to pay when shopping online.
4. The typical BNPL loan is about $135 spread over six weeks, while traditional installment loans average $800 paid over 8–9 months.
5. The main reason people use BNPL is to better manage their cash flow (36%), followed by making bigger purchases more affordable (28%).
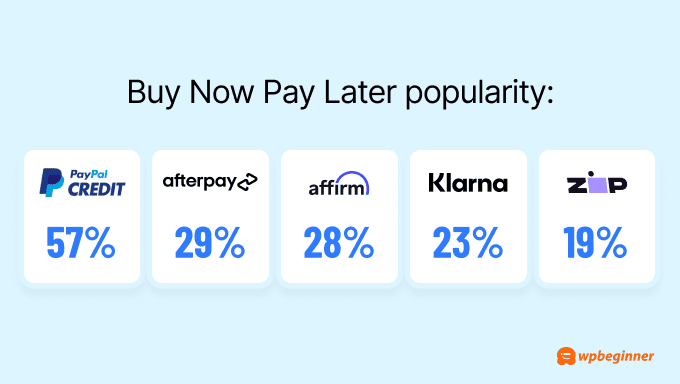
6. PayPal Credit is the most-used BNPL app, with 57% of consumers choosing it.
PayPal Credit is the number one BNPL app
7. Data from Numerator shows that BNPL users are often Gen Z or Millennial, live in cities, come from diverse backgrounds, and earn less than $60,000 a year.
8. Sweden leads the BNPL market in global share, with Germany and Norway close behind.
9. The most common BNPL purchases last year were clothing (42%), electronics and gadgets (32%), furniture and home décor (26%), and home appliances (22%).
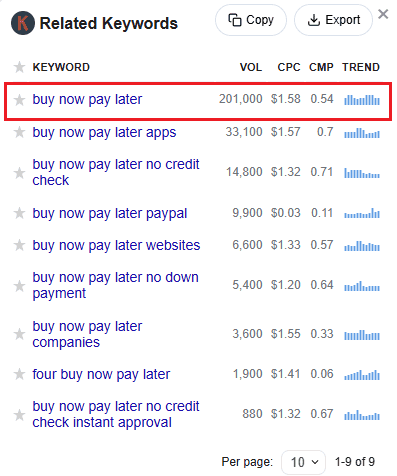
10. Keywords Everywhere data shows over 200,000 searches each month for “buy now pay later,” highlighting just how much interest in the service is growing.
BNPL Market Size and Forecasts
The BNPL market has gone from a relatively small segment of the payment industry to one of its fastest-growing areas, attracting both startups and big financial players.
Forecasts suggest this growth will continue for years as consumer demand and merchant adoption rise.
The following BNPL stats reveal how large the market is now and where it’s headed next.
11. The global BNPL market handled about $340 billion in transactions in 2024, and it’s expected to keep growing steadily at 12.3% each year through 2030, showing this trend is here to stay.
12. BNPL made up 5% of all eCommerce payments worldwide in 2024, while in the U.S., the share was slightly higher at 6%.
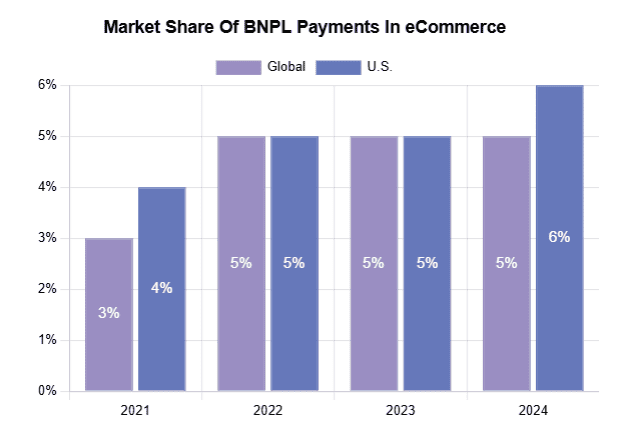
Market share of BNPL payments in eCommerce
13. By 2028, BNPL users in the U.S. are projected to reach around 105 million, seeing a 4.1% yearly growth rate.
14. In 2025 alone, U.S. BNPL spending is set to rise 20.4% year-over-year, climbing to nearly $97.3 billion.
15. By 2027, the U.S. BNPL market is expected to reach $124.8 billion, highlighting how quickly Americans are adopting installment payments.
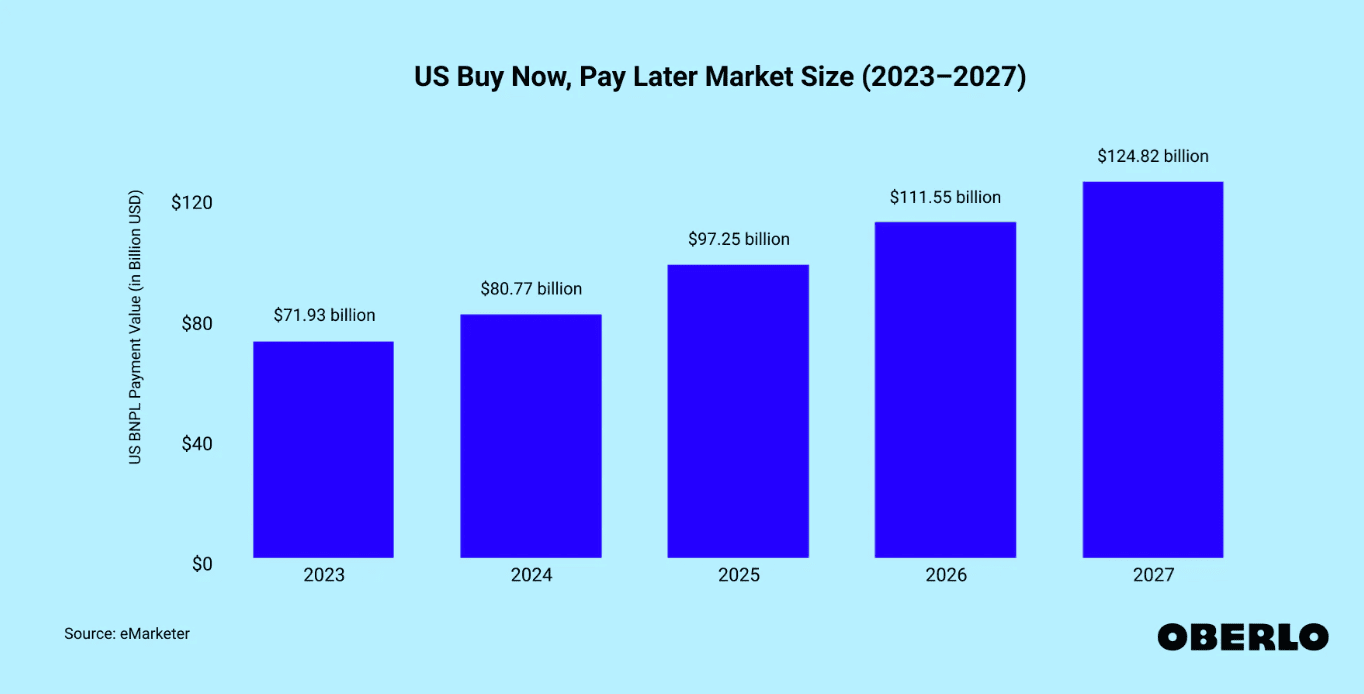
US BNPL market size (2023-2027)
16. Globally, BNPL’s gross merchandise value is forecast to surpass $1 trillion by 2029, with an annual growth rate of 11.4%.
17. Between 2023 and 2030, worldwide BNPL revenue is expected to grow at a much faster pace — 26.1% per year on average.
BNPL Usage Statistics
It’s one thing to know BNPL is available, but it’s another to see how often people are actually using it.
From single high-value purchases to everyday shopping, BNPL has become part of many consumers’ payment routines.
Here are BNPL stats that show how people are using these services and how frequently they turn to them.
18. Nearly half of BNPL users (45%) say they use it at least once a month, and when it comes to online shopping, about 47% rely on it most of the time or even every time they buy something.
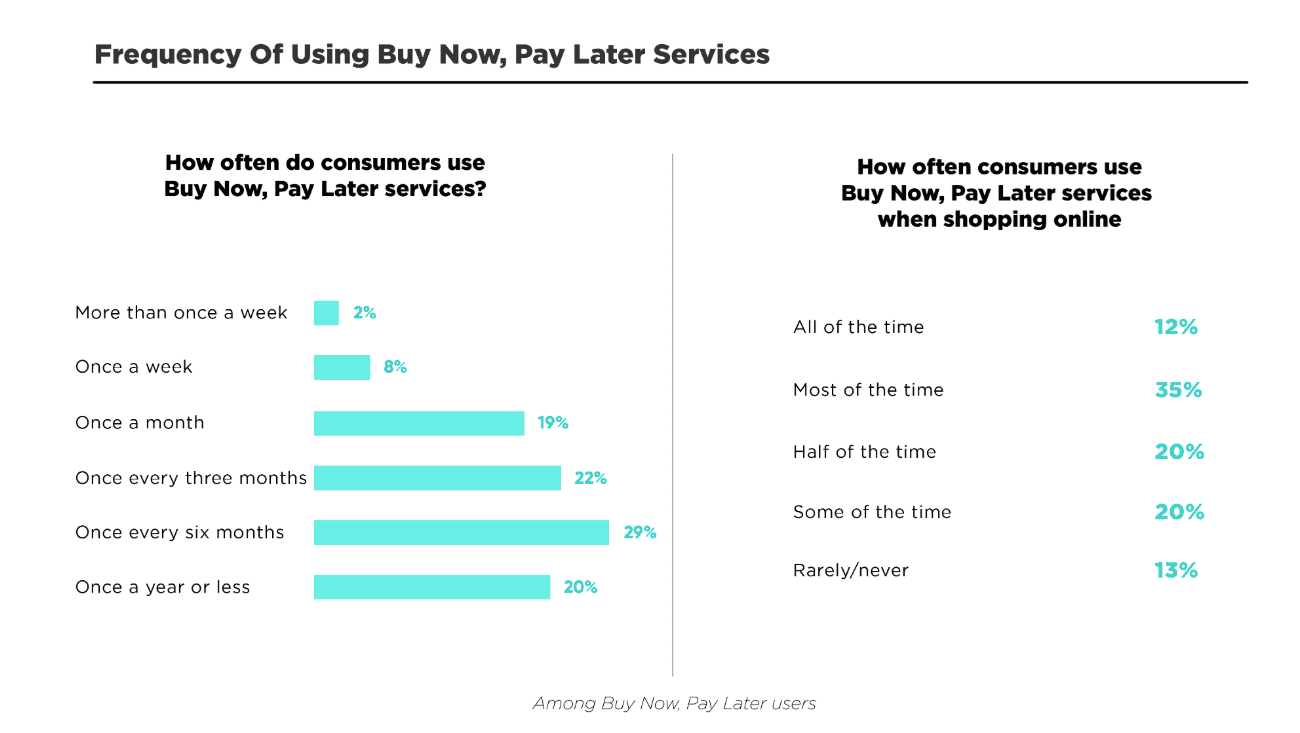
Frequency of using BNPL services
19. When asked what matters most in choosing BNPL, nearly 42% of users said clear fees and interest rates, followed by the ability to track spending (39%), convenience (37%), and how many merchants accept it (37%).
20. On average, BNPL shoppers are paying off about four items in installments at any given time, usually spending between $101 and $205 per month.
21. Roughly two-thirds of consumers use BNPL for at least half of their online shopping, and more than a third say they use it most of the time.
22. Gen Z and Millennials are 50% more likely to finance experiences like concerts and festivals, and they’re also more likely to use BNPL for travel and fitness gear.
23. BNPL is popular for holiday shopping too, with 39% using it during the holidays and 36% during big sales events.
BNPL sales during holiday season
24. Nearly half of Americans consider BNPL for purchases over $200, while active users are much more likely to use it even for items over $100.
25. Compared to the average shopper, BNPL users are 82% more likely to enjoy online shopping, 49% more likely to research products online, and 42% more likely to order weekly.
26. Shopping preferences stand out too: BNPL users are 51% more likely to shop at Nike, and they also lean toward department stores like Nordstrom, Saks Fifth Avenue, and Bloomingdale’s.
27. When it comes to brands, BNPL users are 44% more likely to choose PlayStation, 23% more likely to pick Apple, and slightly more likely to buy private-label appliances.
28. Attitudes toward risk are mixed: 54% of Americans view BNPL as somewhat risky, 16% think it’s very risky, while 30% don’t see it as risky at all.
29. The biggest reasons people prefer BNPL over credit cards are its ease of making payments (45%) and the flexibility it offers (44%). Lower or no interest costs appeal to 36% of users, while a simple approval process attracts another 33%.
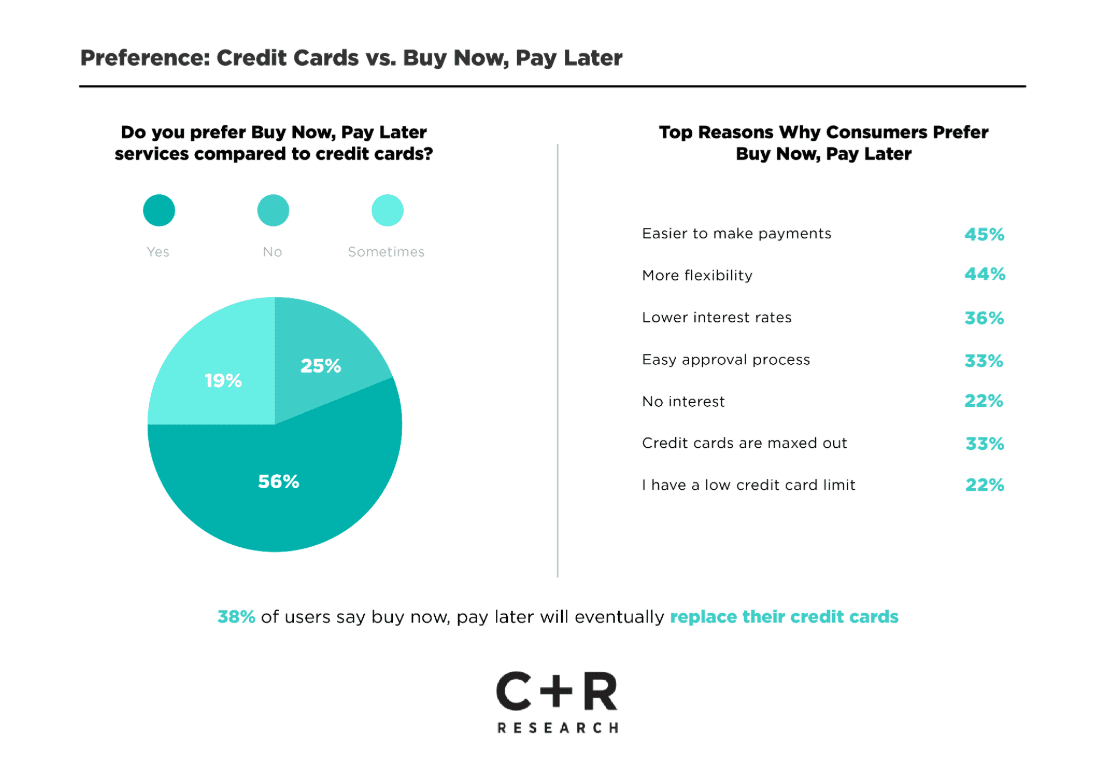
Top reasons why consumers prefer BNPL
30. Still, not everyone feels comfortable—24% of BNPL users say they often feel stressed about upcoming payments, and 14% admit to missing one or being hit with fees.
31. Regulation has public support, with half of Americans in favor of stronger rules, and even among BNPL users themselves, 53% agree that oversight should be tighter.
BNPL Consumer Demographics
Which age group uses BNPL the most? What’s their income? What about their gender?
BNPL appeals to a wide range of shoppers, but certain groups lean on it more than others. Age, income, and even shopping style can influence whether someone chooses to split their payments.
The following BNPL stats reveal which consumers are driving adoption and how usage differs between different demographic segments.
32. A little over 26% of BNPL users with incomes between $50,000 and $100,000 choose the service out of preference, while nearly the same share—about 27% of users earning under $50,000—say they rely on it out of necessity.
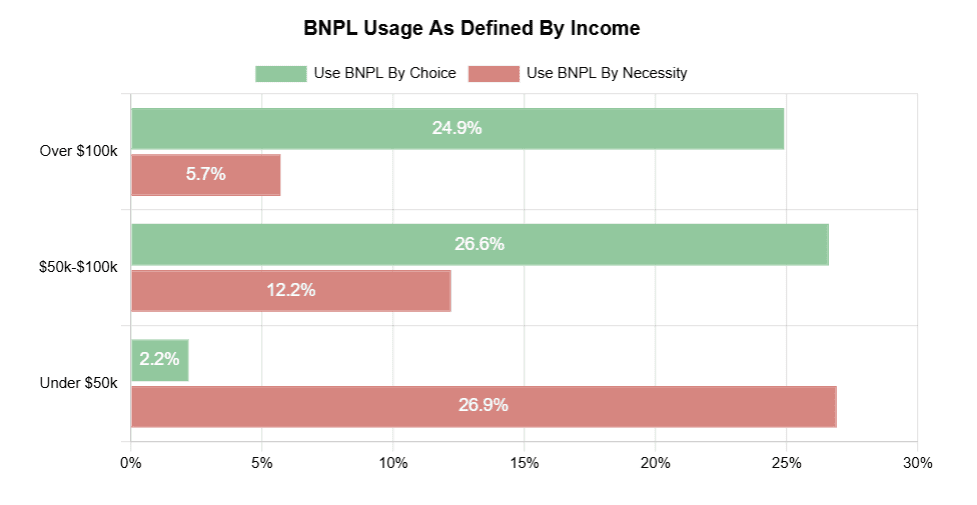
BNPL usage by income
33. In the U.S., Millennials make up the largest share of BNPL users at 33.6%, followed by Gen Z at 26%, showing younger generations are driving adoption.
34. Women tend to favor BNPL more than men: 15% of women reported using it in 2024 compared to 12% of men, and 11% of women said they used it more than five times in the past year.
35. A Motley Fool survey found that 48% of Millennials and 40% of Gen Z have used BNPL at least once since BNPL became available, compared to 28% of Gen X and only 13% of Baby Boomers.
36. Looking at race and ethnicity, 25% of Black Americans and 21% of Hispanic Americans use BNPL, compared to 11% of White Americans and 12% of Asian Americans.
37. Among younger shoppers, 18% of those aged 18–32 start their shopping directly on BNPL marketplaces, reflecting how central these platforms are becoming.
38. Usage is highest among 25–44 year olds, a group largely made up of Millennials balancing major expenses and financial pressure.
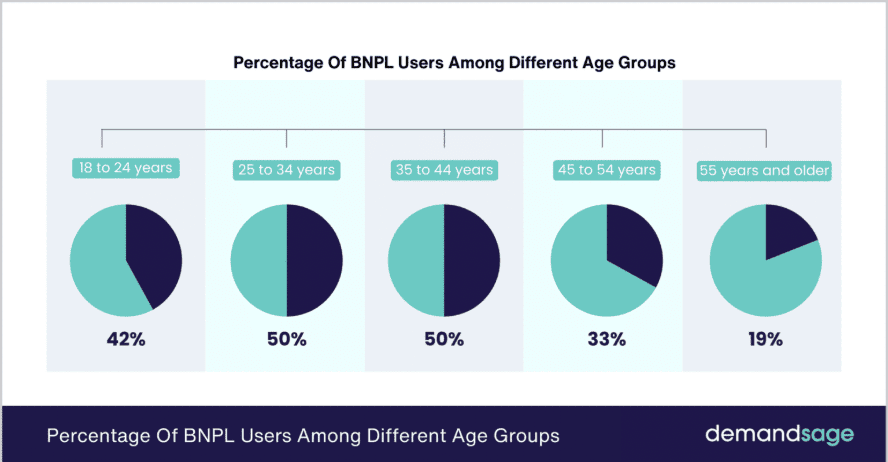
BNPL users by age group
39. Late payments are a concern, with 24% of Americans who’ve used BNPL admitting they’ve missed a payment—up from 18% in 2023. Younger and lower-income users are most affected, with late payment rates especially high among Hispanic (32%) and Black (29%) consumers.
40. Tracking payments is another issue: 37% of Gen Z and 38% of Millennials admit they’ve lost track of their BNPL installments, compared to just 9% of Baby Boomers.
41. Regret is also more common among younger generations, with 55% of Gen Z and 52% of Millennials saying they’ve regretted a BNPL purchase after realizing the full cost, while only 31% of Boomers report the same.
BNPL Usage by Region
Not every country or region is adopting BNPL at the same pace.
In Sweden, for example, nearly one in four online purchases is made using BNPL, while in the United States, only a small fraction of transactions are BNPL.
Here are BNPL stats that show how adoption rates vary around the world and which regions are leading the charge.
42. Sweden had the largest share in the BNPL market in 2023, with Germany (21%) and Norway (15%) close behind. Other countries where BNPL has a strong presence include Australia (15%), Belgium (13%), Finland (13%), Denmark (12%), Netherlands (11%), New Zealand (11%), and the UK (7%).
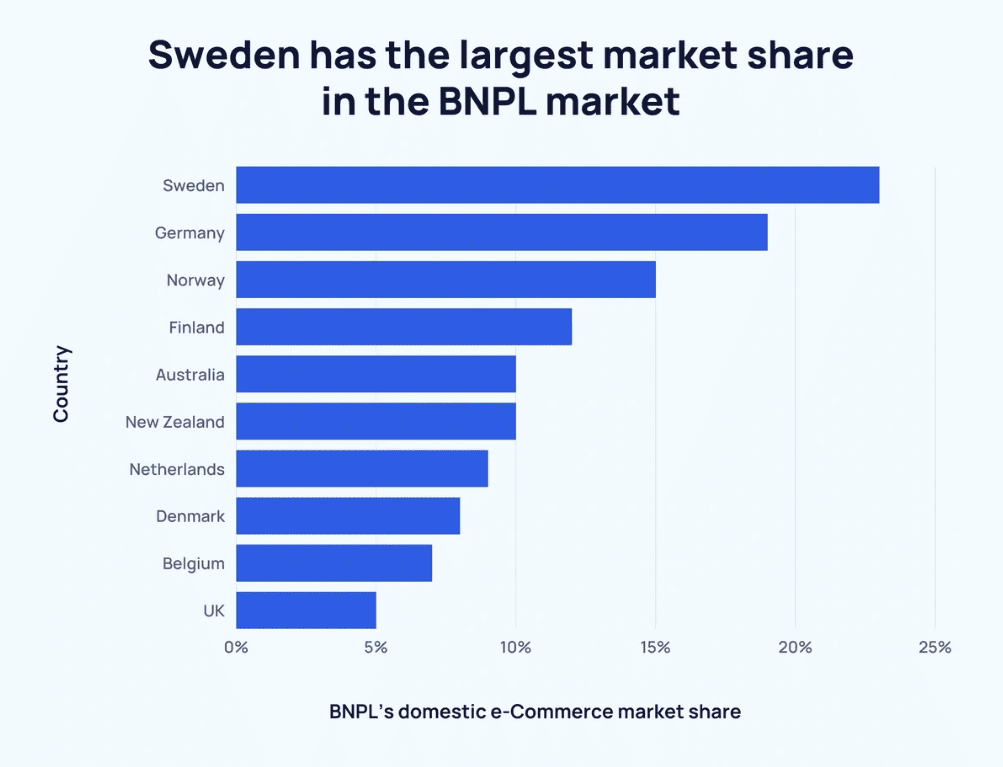
BNPL domestic eCommerce market share
43. In Australia, BNPL is especially popular—nearly 40% of consumers have used it, and in 2023, 30.1% of internet users relied on BNPL, the highest usage rate worldwide.
44. In the U.S., 56% of adults who used BNPL said they missed a payment or regretted a purchase. In the UK, 41% of BNPL users worry about missed payments compared to only 30% of credit card users.
45. Looking at regions overall, Europe had the largest BNPL share of e-commerce payments in 2022 at 10%, while North America stood at 5%, Asia-Pacific at 4%, the Middle East and Africa at 2%, and Latin America at 1%.
46. The U.S. BNPL market was valued at $1.64 billion in 2022 and is forecast to grow at 24.3% annually through 2030.
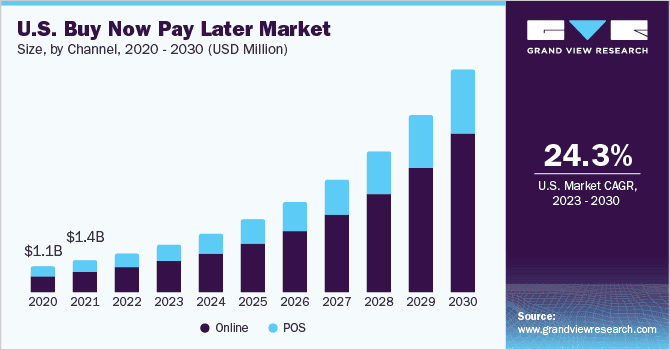
US BNPL market size
47. The Asia-Pacific region is projected to grow fastest, with BNPL transactions projected to rise 28.4% each year through 2030.
48. Europe already sees strong adoption, with BNPL transactions worth $191.3 billion, a number expected to reach $293.7 billion by 2030.
BNPL Purchase Categories
People aren’t just using BNPL for one type of purchase — it’s being applied to everything from fashion and electronics to travel and home goods.
These trends reflect how flexible the payment method has become across different spending needs.
The following BNPL stats reveal which categories dominate BNPL use and where growth is happening fastest.
49. According to Numerator, the top categories financed by BNPL over the past year included apparel (42%), electronics and gadgets (32%), furniture and home décor (26%), and home appliances (22%).
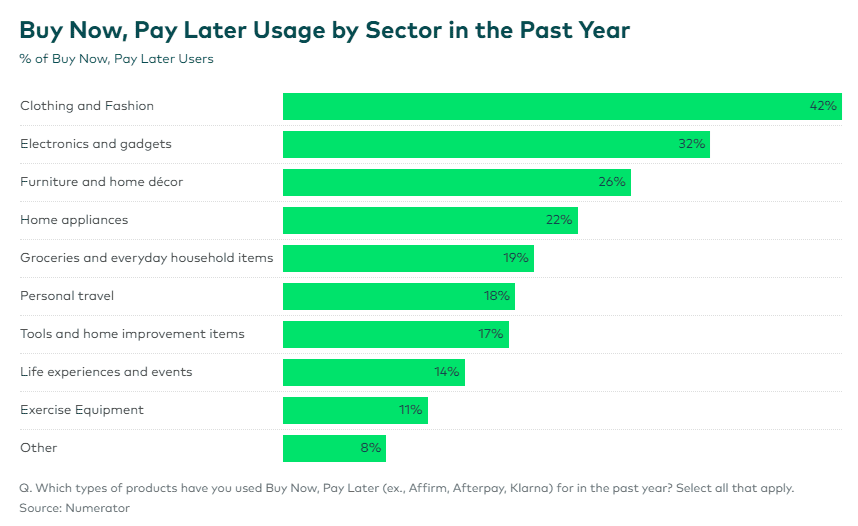
Top BNPL purchase categories
50. Numerator suggests that 72% of Americans plan to use BNPL in the coming year, with the biggest interest in furniture, appliances, and personal travel.
51. Data from Motley Fool Money shows when consumers most often turn to BNPL:
- online shopping (55%)
- electronics (44%, down from 49% in 2024)
- clothing and fashion accessories (40%, down from 39% in 2024)
- groceries (28%, up from 27% in 2024)
- furniture and appliances (27%, down from 40% in 2024)
- household necessities (24%, down from 29% in 2024)
- food delivery (22%)
- personal care products and cosmetics (17%, down from 24% in 2024)
- books, music, or games (19%, up from 16% in 2024)
52. More BNPL users are also choosing installment plans for groceries (28%) and food delivery (22%), which points to the financial strain many Americans are still facing after years of inflation.
53. According to Adobe Digital Insights, BNPL accounted for $18.2 billion in holiday shopping in 2024, making up 7.5% of total holiday spending.
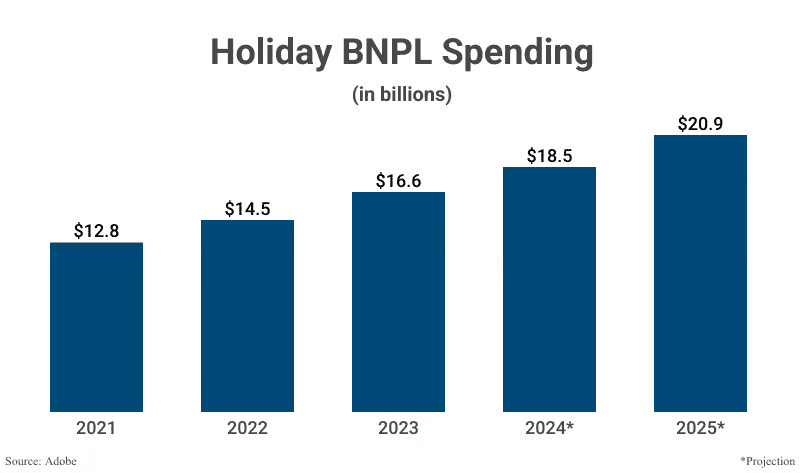
Holiday BNPL spending
54. Holiday BNPL usage grew from $14.5 billion in 2022 to $16.6 billion in 2023, and then $18.2 billion in 2024. Cyber Monday alone was the biggest day for BNPL transactions, with consumers spending a record $991.2 million.
55. The Federal Reserve highlights why shoppers use BNPL: 87% use it to spread out payments, 58% to buy something they couldn’t afford with traditional methods, 58% to avoid interest, and 53% to avoid using a credit card.
BNPL Company Statistics
A few major names have become almost synonymous with BNPL, but the competitive landscape is evolving quickly.
New providers and partnerships are constantly shaping the market, and companies are adapting their strategies to win over both consumers and merchants.
Here are BNPL stats that show which companies are leading the space and how they’re performing.
56. PayPal Credit is the most popular BNPL app, with 57% of consumers using it. Afterpay and Affirm follow, with nearly 30% of consumers preferring them.
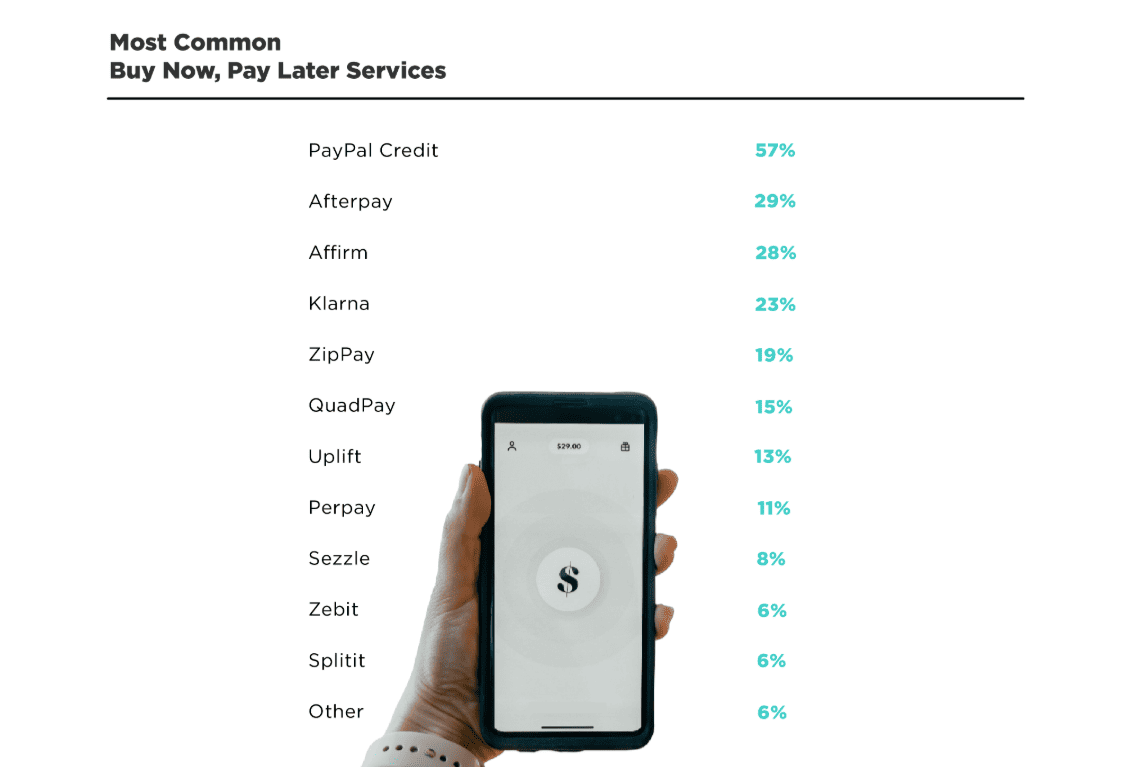
Most common buy now, pay later services
57. While PayPal Credit leads in market share, Klarna has over 150 million active users worldwide.
58. Among top BNPL lenders, Affirm and Sezzle are headquartered in the U.S., while Klarna is a Swedish company.
59. The top three BNPL apps—Affirm, Klarna, and Afterpay—each average over 1.49 million unique downloads per quarter since 2020.
60. Emerging BNPL firms in the U.S. such as Sezzle, Zip, and Four have each seen over 119,000 app downloads per quarter since 2020.
61. Two of the largest BNPL companies operating in the U.S. are Australian, where BNPL has been around since 2015, four years before it launched in the U.S.
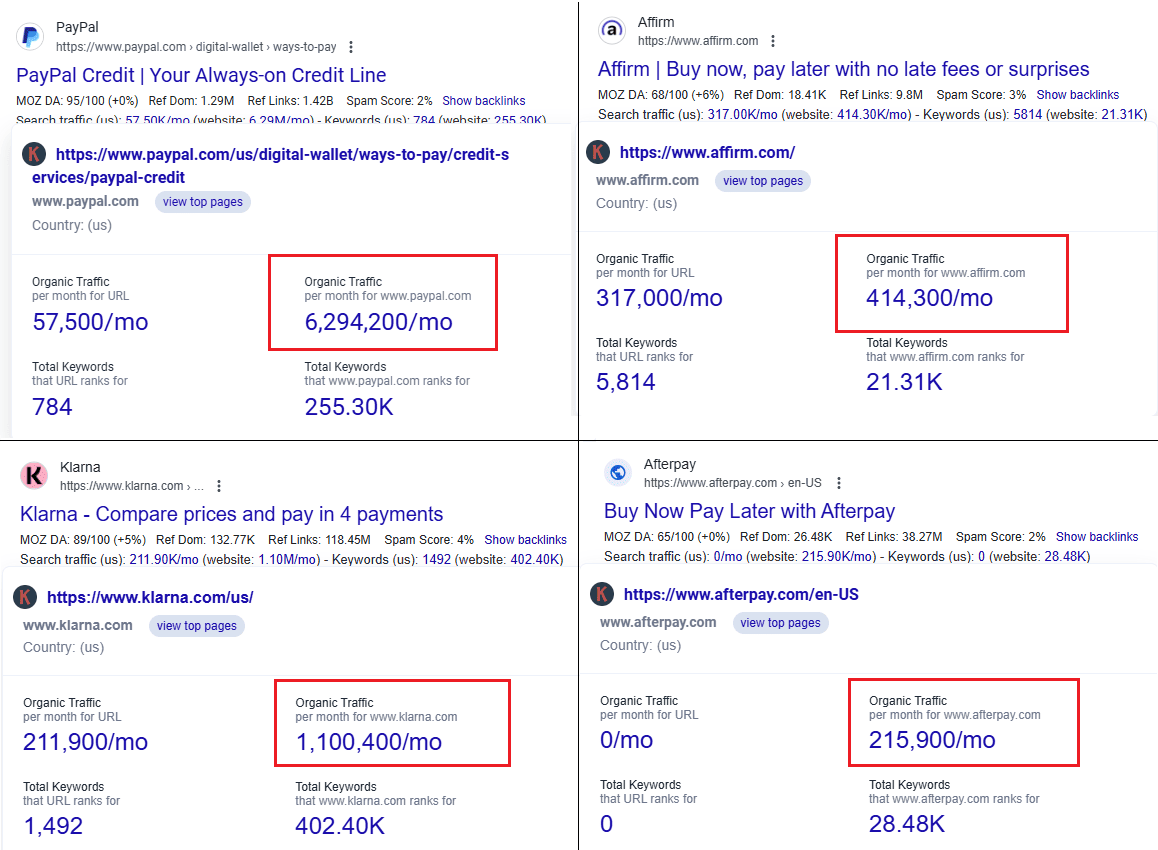
62. According to Keywords Everywhere, PayPal receives 6.29 million organic monthly visits, Affirm gets 414,000, and Klarna sees 1.10 million. It’s clear that in terms of monthly visitors, PayPal is much ahead of other BNPL companies.
Conclusion
That brings us to the end of our deep dive into BNPL stats.
What’s clear is that Buy Now, Pay Later is not a passing trend but is becoming a key part of how people shop online.
Big retailers like Target, Wayfair, Lululemon, and Urban Outfitters are already on board, showing that brands see the value in giving customers more flexible payment choices.
As shopping habits keep changing, BNPL will likely play an even bigger role in shaping ecommerce and the way people choose to spend.