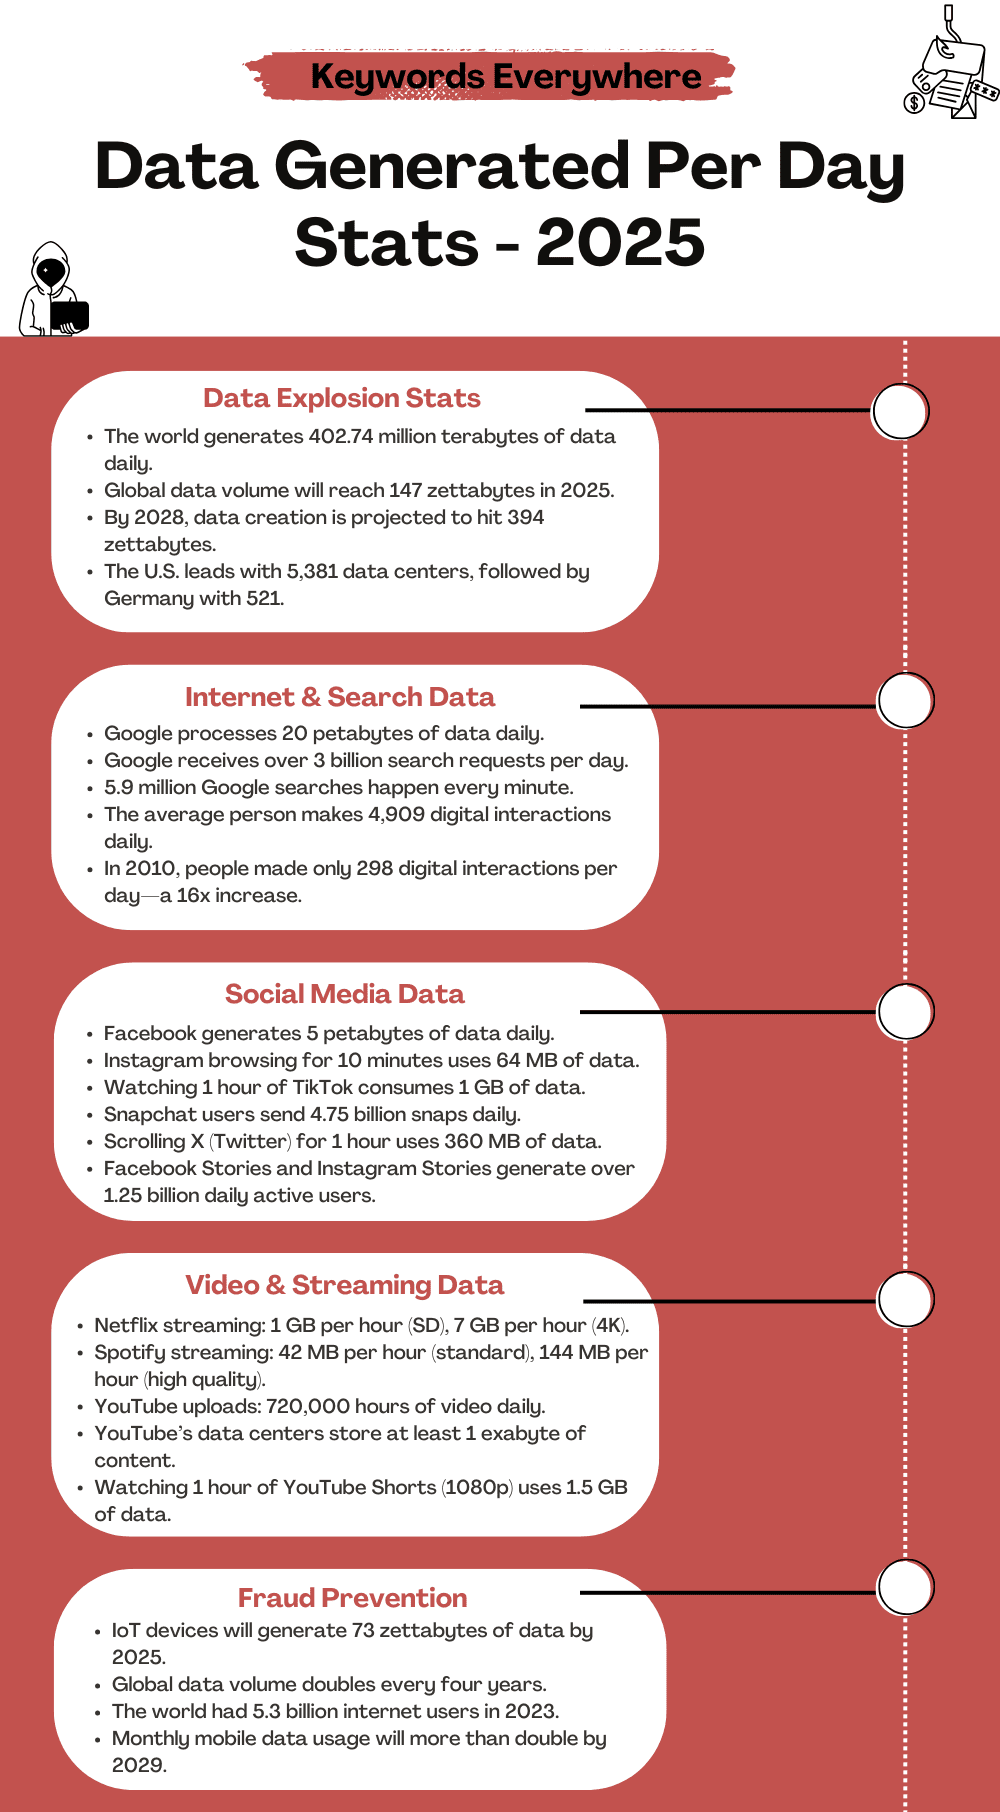
How much data do we create in a single day? The numbers are staggering. Every day, the world produces 402.74 million terabytes of data—enough to fill billions of smartphones.
From emails and social media updates to online transactions, our digital footprint is expanding at an incredible pace.
Even more surprising is that 90% of all data in existence was generated in the last two years alone.
In this article, we’ll break down the most eye-opening data generated per day stats to reveal how much information is produced every second.
Let’s dive in!


Top Data Generated Per Day Stats
The volume of data that is created and shared on the web is surging.
This growth is fueled by greater internet accessibility, technological advancements, and the overall use of social media, streaming platforms, and various digital technologies.
Here are the statistics to provide a clearer picture of the vast volume of data generated each day:
1. The world generates 402.74 million terabytes of data daily, which equals 0.4 zettabytes per day, 2.8 zettabytes per week, 12 zettabytes per month, and 147 zettabytes per year.
2. Over the next five years, global data creation is forecasted to grow to more than 394 zettabytes by 2028.
3. As of March 2024, the United States had 5,381 data centers, the highest number of any country. Germany had 521 data centers, while the United Kingdom had 514.
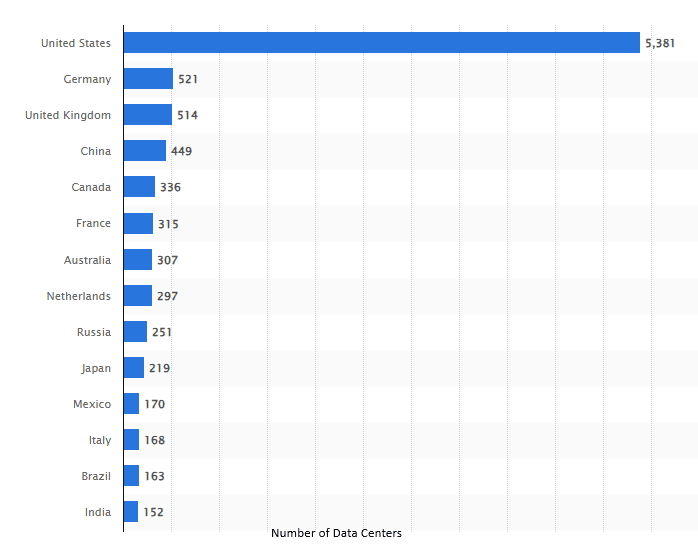
Number of data centers worldwide
4. Google processes over 20 petabytes of data every single day, which is equivalent to 1,024 terabytes or 1,048,576 gigabytes. This means Google handles over 2 million gigabytes per minute.
5. Google operates more than 60,000 servers across 25+ countries, handling over 3 billion requests per day.
6. Google has built one of the largest and most advanced data infrastructures in the world, processing an incredible 2.5 exabytes (2,500,000,000 gigabytes) of data every single day.
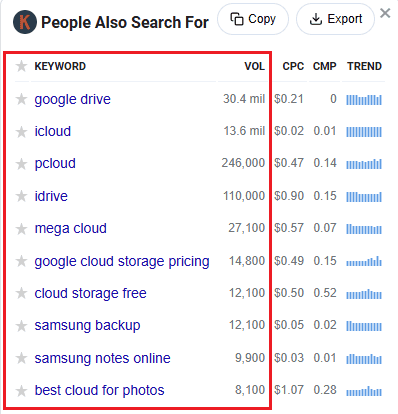
7. According to Keywords Everywhere, a large number of searches are made on Google daily for cloud storage options. This indicates that people are increasingly looking to store their data online.
8. In 2010, an average person made 298 digital interactions per day. By 2025, this number is expected to reach 4,909 interactions per day, showing how deeply the digital world has become part of daily life.
9. In 2024, 251.1 million emails were sent every minute, 138.9 million Reels were played on Facebook and Instagram, and 5.9 million Google searches were conducted.
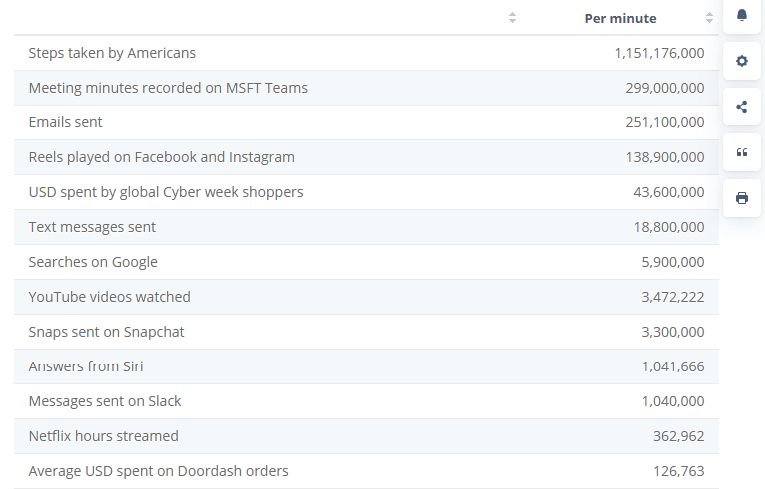
Media usage in an internet minute
Data Generated On Social Media Stats
Social media platforms create a huge amount of data every day. Millions of people post, comment, share, and message each other across different apps. Every single action adds to the growing pool of digital content.
From Instagram posts to Facebook messages, every interaction leaves a digital trace. Photos, videos, live streams, and stories contribute even more to this.
Here are the stats that share how much data is generated on these platforms:
10. Facebook generates 5 petabytes of data daily and had already expanded its data storage to 300 petabytes by 2014. The average time spent on Facebook is 30 minutes per day.
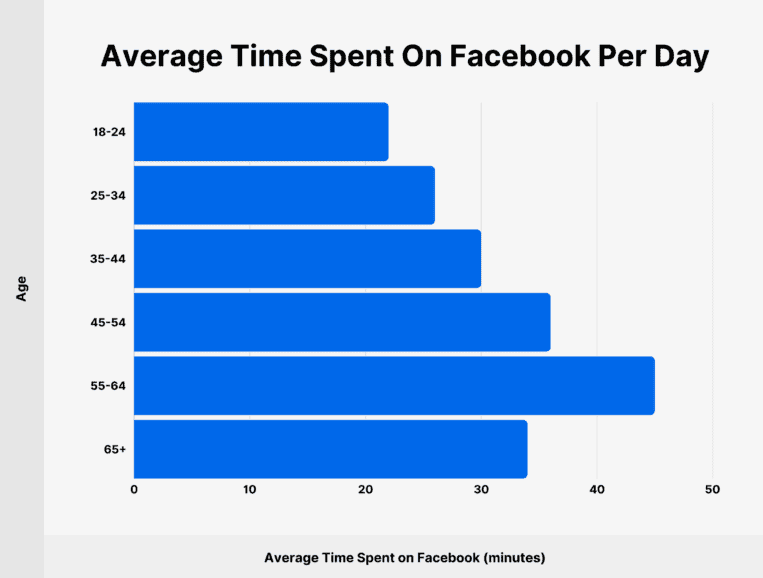
Average time spent on Facebook
11. Facebook Messenger uses very little data for text messages (less than 1 KB per message). Voice calls use around 333 KB per minute, about the same size as a small song. Video calls use significantly more, ranging from 5 MB to 15 MB per minute in standard definition (SD).
12. Streaming videos on Facebook consumes a large amount of data. Watching videos in SD uses 700 MB to 1 GB per hour, while HD videos can use 5 GB or more per hour.
13. Uploading content on Facebook varies in data usage. Text posts require just a few KBs, while images range from 100 KB to 500 KB for standard resolution and 2 MB or more for high-resolution images.
14. Scrolling through a feed with 20 images can use anywhere from 2 MB to 10 MB. Videos, however, consume much more data, with a 1-minute SD video using 10 MB to 20 MB, while HD videos can use 50 MB to 100 MB or more.
15. Browsing Instagram for 10 minutes uses about 64 MB, meaning an hour of browsing can use between 400 MB and 600 MB, depending on the amount of video content.
16. Uploading a photo on Instagram takes around 2 MB to 4 MB, while uploading a video requires at least 8 MB.
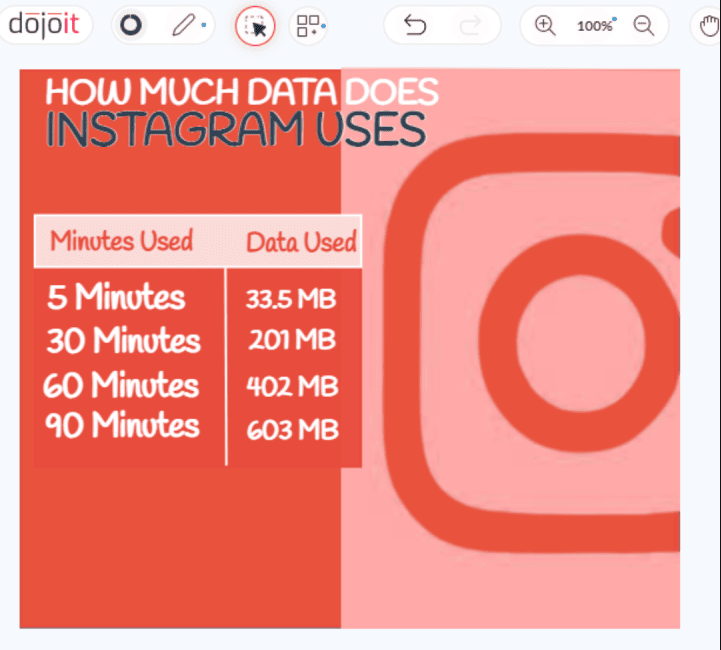
Instagram data usage
17. TikTok consumes between 750 MB to 1 GB per hour. Watching a 30-second video uses about 8 MB, so 1 GB of data allows you to watch around 128 short videos.
18. On average, TikTok users spend about 840 MB per hour, with the average TikTok video lasting 42.68 seconds.
19. Sending or receiving a snap on Snapchat typically uses 1 MB to 5 MB per snap, while video snaps can consume 20 MB to 50 MB per minute.
20. Over 4.75 billion snaps are sent daily on Snapchat, with each Snapchat message using about 20 KB of data.
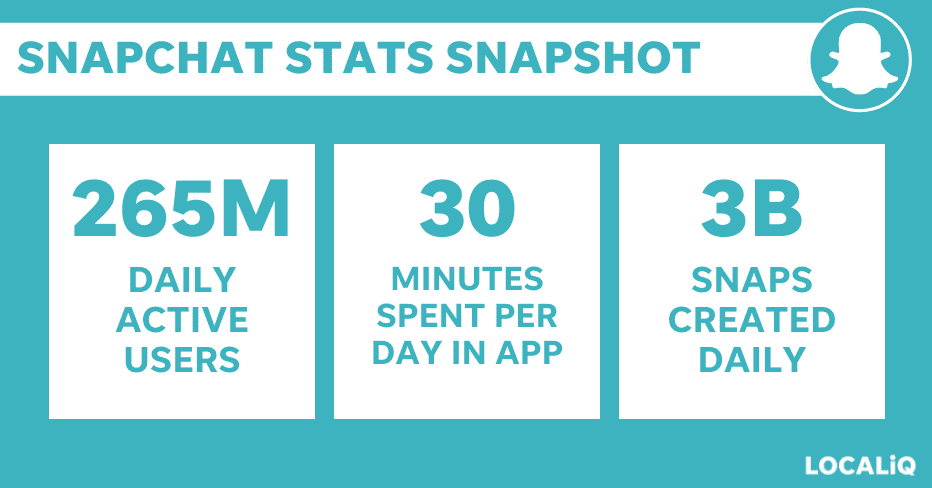
Snapchat insights
21. Scrolling on X (Twitter) for an hour uses about 360 MB of data, though this can be higher if your feed contains more images and videos.
22. Videos and live streams on X, especially through Twitter Spaces, use even more data, with live streaming consuming up to 700 MB per hour, depending on quality.
Audio and Video Streaming Data Stats
Music and video streaming services create an enormous amount of data every day.
Every time we listen to a song or watch a video, data is transmitted across networks.
High-quality streams, live broadcasts, and downloads add even more to this digital flow. As more people turn to online entertainment, data usage continues to rise.
The statistics shared below reveal just how much data we use while enjoying our favorite music, shows, and movies.
Audio Streaming
23. Streaming music on Spotify at standard quality (96 kbps) uses about 42 MB per hour. A 4-minute song at this quality takes around 2.8 MB of data.
24. Switching to higher quality on Spotify increases data usage. 160 kbps uses around 72 MB per hour, while 320 kbps (highest quality) consumes about 144 MB per hour.
25. Apple Music at its highest quality can use over 8 GB per hour, significantly more than Spotify’s maximum data usage.
26. For most Apple Music users streaming at regular quality (256 kbps), data usage is around 115 MB per hour, which is similar to Spotify’s high-quality streaming.
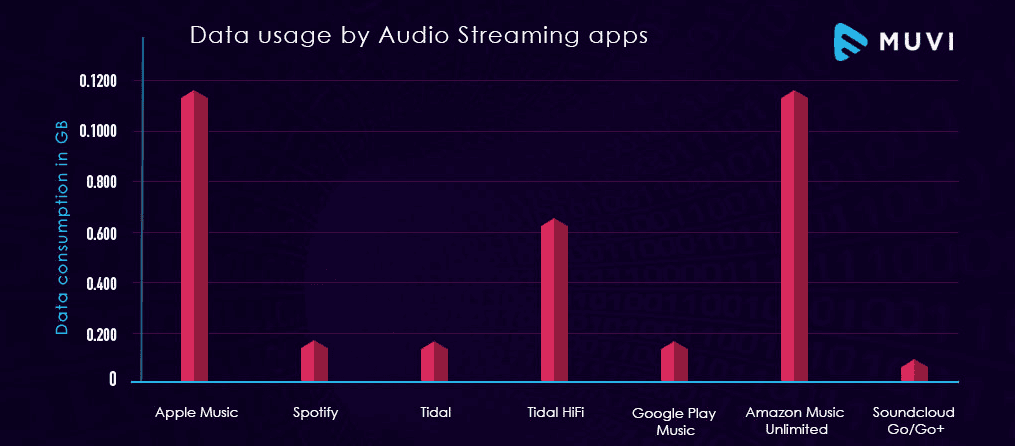
Data usage by audio streaming apps
27. Amazon Music Free and Amazon Music Prime stream music at up to 320 kbps for standard sound quality.
28. Amazon Music’s “Data Saver” mode lowers streaming quality to 48 kbps, reducing data usage to around 22 MB per hour.
29. Streaming music on YouTube uses about 1 MB per minute, meaning an hour of audio streaming consumes around 60 MB of data.
Video Streaming
30. Streaming on Netflix in standard definition (SD) uses about 1 GB per hour, while HD streaming consumes up to 3 GB per hour.
31. Watching Netflix in ultra-high definition (UHD/4K) can use as much as 7 GB per hour, but this requires a UHD subscription and a compatible TV.
32. Hulu’s recommended HD setting uses around 1.3 GB per hour, similar to Netflix and YouTube at the same quality.
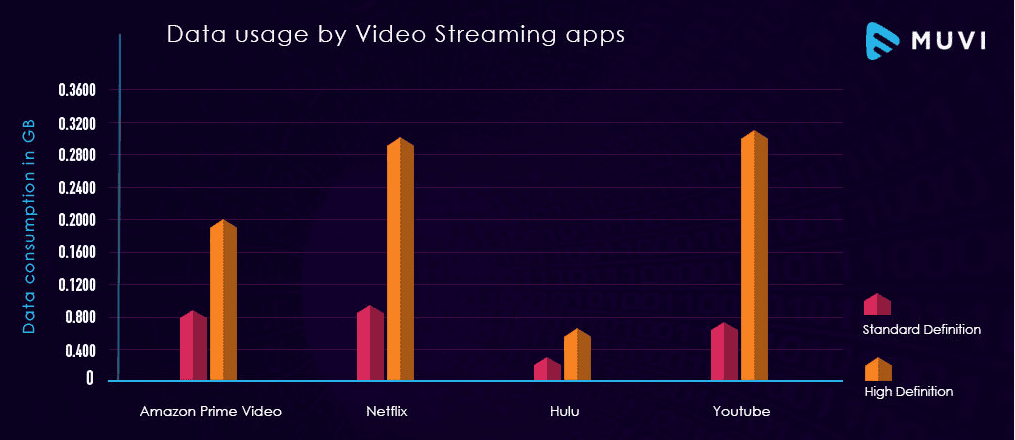
Data usage by video streaming apps
33. Streaming in 4K on Hulu consumes a massive 7 GB per hour, nearly seven times more than regular HD streaming.
34. Amazon Prime Video offers three quality options: “Good” uses about 0.38 GB per hour, “Better” takes 1.40 GB per hour, and “Best” (highest quality) consumes 6.84 GB per hour.
YouTube Data Stats
YouTube is one of the biggest drivers of data consumption worldwide.
With millions of videos (long + short) uploaded and billions of hours streamed daily, the platform processes an immense amount of digital content.
Every play, comment, and like adds to the growing data load.
Here are some eye-opening stats on how much data YouTube uses every day:
35. YouTube users upload an incredible 720,000 hours of video every day, which adds up to around 4.3 petabytes of data.
36. People around the world watch over a billion hours of YouTube content daily, making it one of the biggest data-consuming platforms.
37. YouTube’s data centers store at least one exabyte of content, according to estimates— that’s a million terabytes!
38. Watching 4K videos on YouTube can use as much as 7.2 GB of data per hour, while 480p videos consume just 360 MB per hour.
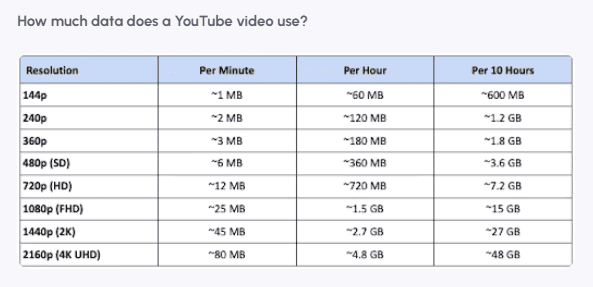
YouTube video data usage
39. Frame rate affects data usage—a 60fps video uses more data than a 30fps video because it displays more frames per second.
40. YouTube Shorts may seem small, but they can quickly eat up data. Watching Shorts for an hour at 480p consumes 360 MB, while 1080p jumps to 1.5 GB.
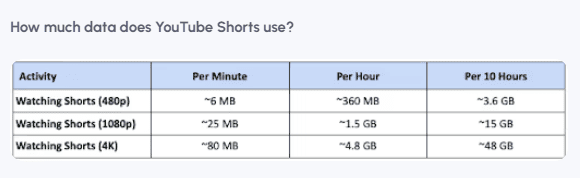
YouTube Shorts data consumption
41. YouTube Music uses less data than regular YouTube since there’s no video. Listening at low quality (48 kbps) uses only 40 MB per hour, while high quality (256 kbps) takes 210 MB per hour.
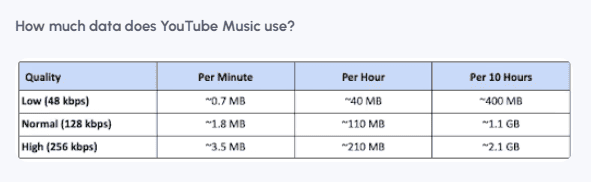
YouTube Music data consumption
Data Growth and Future Predictions
The world’s data is expanding at an incredible pace, and it’s not going to slow down anytime soon.
New technologies, smarter devices, and cloud-based solutions make it super hard to predict just how much data will exist in the future.
From the rapid growth of IoT devices to the growing demand for cloud storage and AI apps, the numbers paint a clear picture—global data generation WILL explode in the coming years.
Here are some important statistics that highlight the future of data growth:
42. The global data market is expanding rapidly, with the data analytics industry valued at $51.55 billion in 2023 and projected to reach $279.31 billion by 2030.
43. Real-time analytics, edge computing, and IoT devices are driving this growth, with IoT alone expected to generate over 73 zettabytes of data in 2025.
44. The global data center market, which supports cloud storage and computing, is expected to grow at a 10.9% annual rate until 2030, reflecting the rising demand for scalable storage solutions.
45. According to an analysis, 90% of the world’s total data has been generated in just the last two years, and experts predict that global data volume will double approximately every four years.
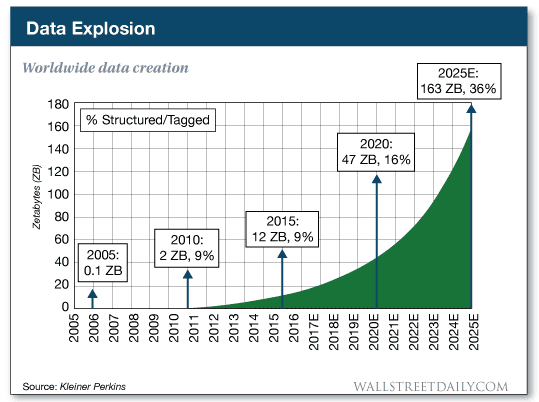
Worldwide data creation
46. In 2023, 120 zettabytes of data were created, and this is expected to increase by over 150% to 181 zettabytes by 2025.
47. Currently, around 11 billion devices are connected to the internet, a number projected to reach 30 billion by 2030 and soar to 80 billion by 2025.
48. Mobile data usage is set to surge worldwide, with monthly data traffic expected to more than double between 2024 and 2029, driven by AI, cloud applications, and changing digital habits.
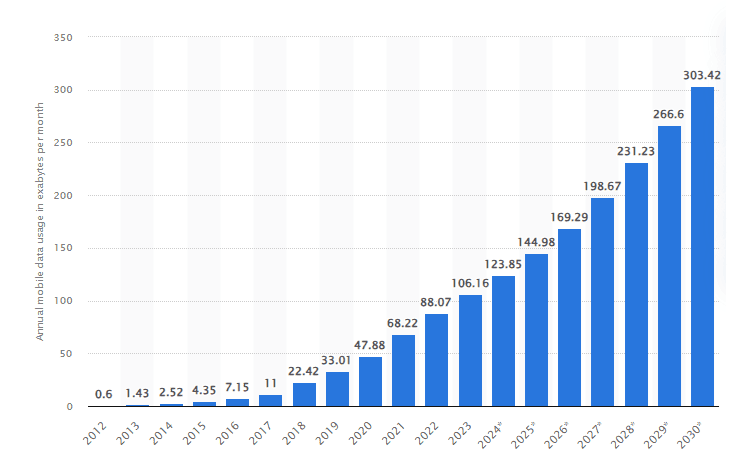
Annual mobile data traffic worldwide
49. By 2023, the world had 5.3 billion internet users, and the average global fixed broadband speed reached 110 Mbps.
50. Internet access in the U.S. is steadily rising, with penetration expected to reach 95.37% by 2029, marking the ninth consecutive year of growth.
Conclusion
The amount of data created every day is huge, and it will only keep growing. With AI, IoT, social media, and cloud storage adding to this surge, global data is expected to reach 181 zettabytes by 2025.
This growth brings both challenges and opportunities. Companies that adopt new technology, manage data well, and use it wisely will stay ahead. Those who can turn data into useful insights will lead the way in innovation.
The future will belong to businesses that don’t just store data but know how to make the most of it.