As a marketer, you understand just how vital landing pages are for capturing leads and converting visitors into customers.
That said, designing a landing page that delivers high conversion rates is no easy task. It requires a fine balance of user experience (UX) design, persuasive copywriting, and smart strategies to hook visitors.
With so many factors at play, staying up to date with the latest landing page trends and performance statistics is essential.
In this article, we’ll explore the latest landing page stats, current trends, and predictions for the future so you can take your conversion rates to the next level.
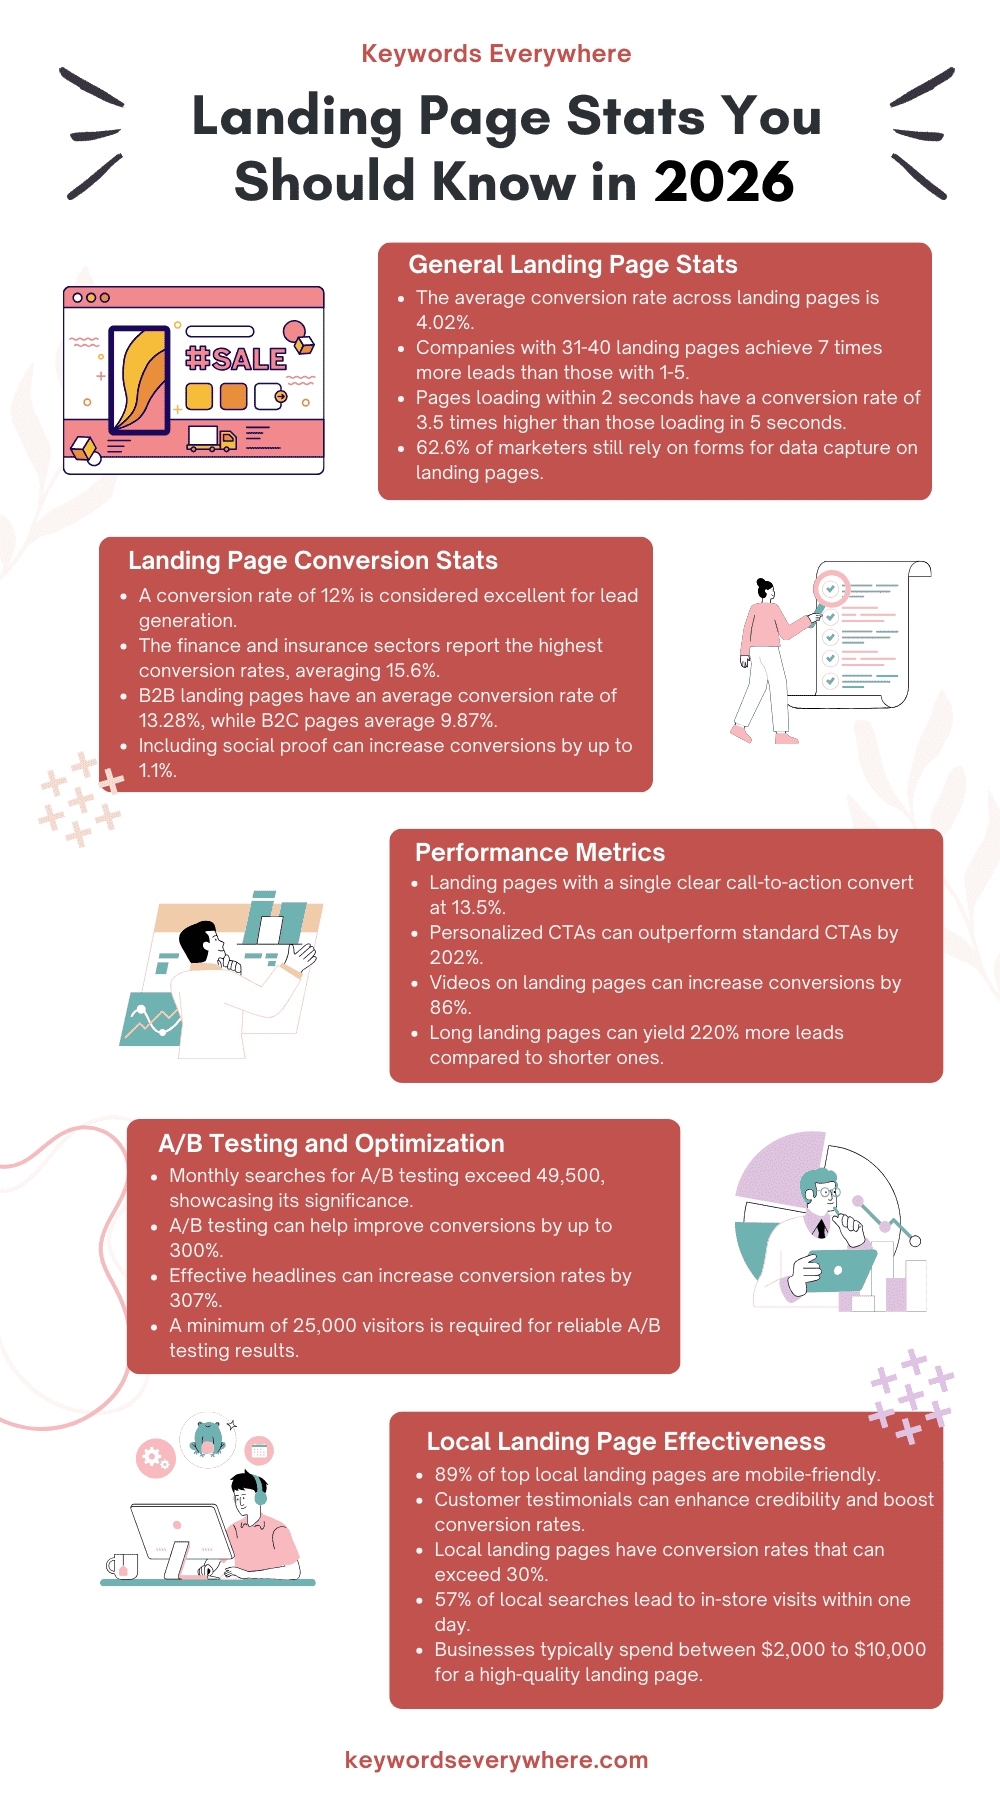


General Landing Page Stats
Landing pages are very important for turning visitors into leads or customers.
Knowing the general landing page stats helps you understand how they’re performing and where you can improve to get better results.
1. The average website converts about 2% to 5% of visitors into customers, but this can change a lot based on your industry, goals, and audience.
2. A good benchmark across all industries is a 10% conversion rate. Landing pages, which are special web pages designed to capture leads, have an average conversion rate of 9.7%.
Source
3. The most popular type of landing page is called a squeeze page, where the main goal is to collect users’ email addresses.
4. While most industries see the best results from click-through landing pages, it’s interesting that 62.6% of landing pages still use forms to capture information.
5. A study by Portent found that landing pages that load in 0-2 seconds perform much better than those that take longer to load. In fact, for every extra second a page takes to load, conversion rates drop by about 4.42% during the first five seconds after a click.
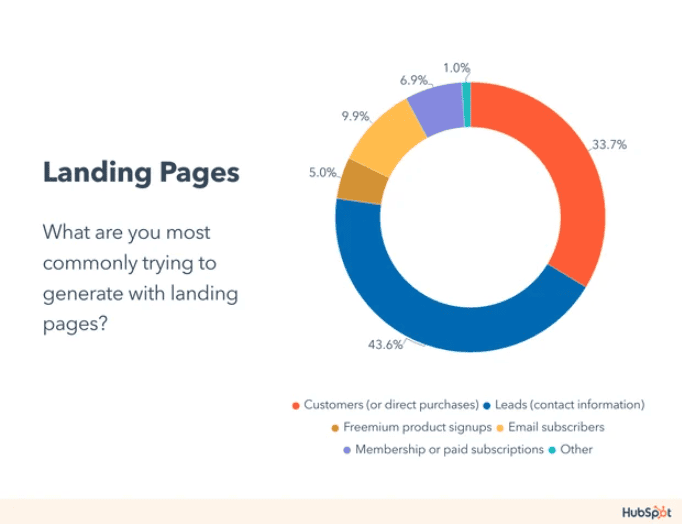
6. 43.6% of marketers aim to generate leads, while 33.7% focus on getting direct purchases from customers. If you fall into either of these groups, landing pages can be a crucial part of your marketing strategy.
Source
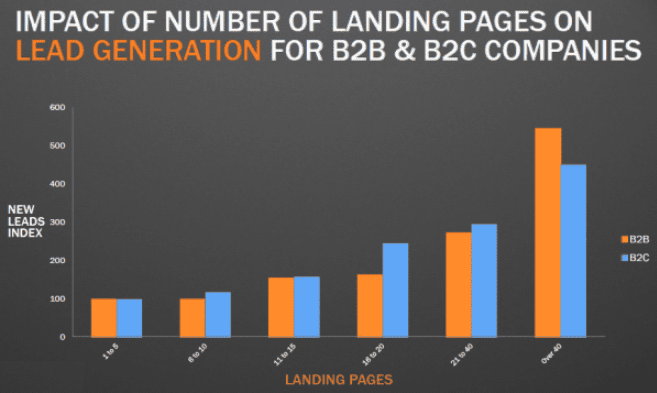
7. Most companies don’t see a big boost in leads when they increase their landing pages from 1-5 to 6-10. However, when they bump that number up from 10 to 15, they can notice a 55% increase in leads! So, the adage “the more, the merrier” definitely applies when it comes to landing pages for lead generation.
8. If a company has between 31 and 40 landing pages, it can get seven times more leads compared to those with just one to five pages.
9. In the SaaS (Software as a Service) world, marketers usually create different landing pages. The majority—42%—focus on demos or consultations, while 24% are for sign-ups and 21% are for lead magnets.
Landing Page Conversion Statistics
Conversion rates show how many visitors take action, like signing up or making a purchase.
By looking at these landing page stats, you can clearly see what’s working well and what needs tweaking to boost your conversions.
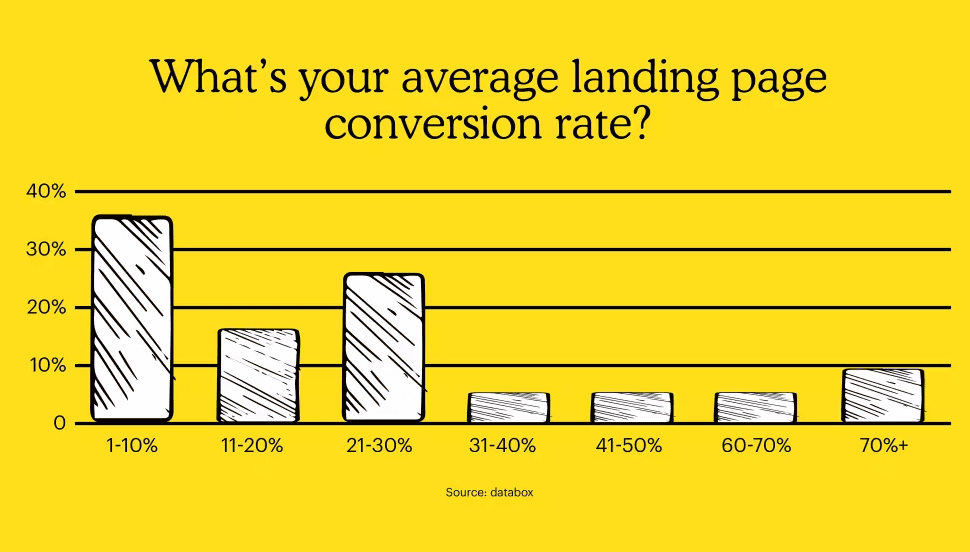
10. A study by Unbounce, analyzing over 74 million visitors across 10 industries, found that the average conversion rate for landing pages is 4.02%.
11. A 12% conversion rate is considered excellent for lead generation landing pages. If your landing page is hitting a 10%+ conversion rate, you’re performing above average.
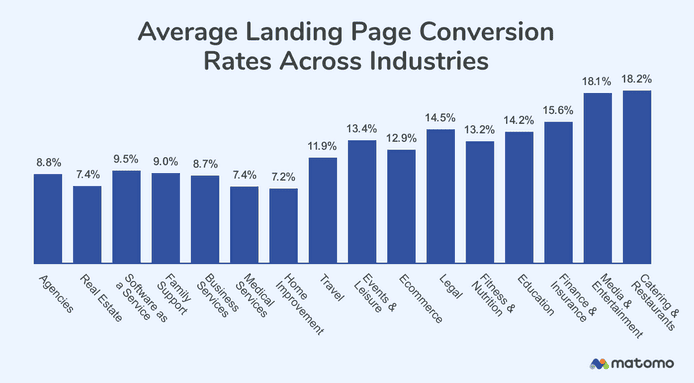
12. The finance and insurance industry leads the way with an impressive 15.6% conversion rate. On the other hand, agencies struggle with a lower rate of 8.8%.
Source
13. According to Wishpond, business-to-business (B2B) landing pages perform well, with an average conversion rate of 13.28%.
14. For business-to-consumer (B2C) landing pages, Wishpond reports a slightly lower average conversion rate of 9.87%.
15. Unbounce’s research shows that the average form submission rate for landing pages is 4.14% across all industries. When it comes to click-through rates, the average for landing pages is 11.3%.
16. Mobile landing pages perform exceptionally well in the pharmaceutical industry, with a conversion rate of over 32%. Other strong performers include internet software, media, and e-commerce, with rates between 25% and 26%. The travel industry trails behind with a 16.35% conversion rate.
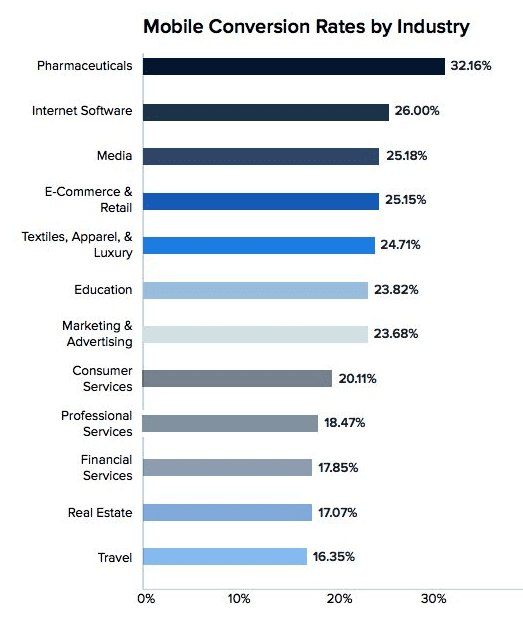
Source
Landing Page Performance Statistics
Performance metrics like bounce rates and session duration tell you how well visitors are engaging with your landing pages.
Understanding these landing page stats can help you figure out if people are finding what they need or if they’re leaving too quickly.
17. A study by Unbounce found that landing pages with just one clear call-to-action (CTA) converted at a rate of 13.5%, while pages with 2 to 4 links or CTAs only managed to convert 11.9% of visitors. This highlights the importance of directing customers towards a single, specific action.
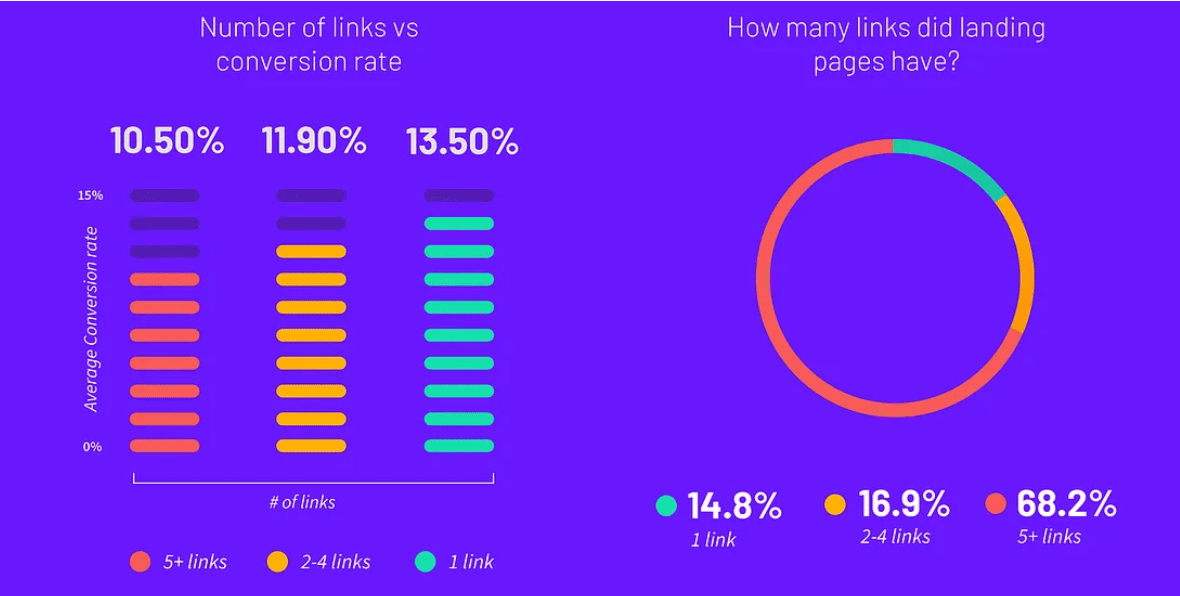
Source
18. Landing pages that include social proof—like photos of happy customers and social media posts—convert 1.1% better than those that don’t. This extra trust factor encourages customers to feel more confident in your brand, products, or services, making them more likely to take action.
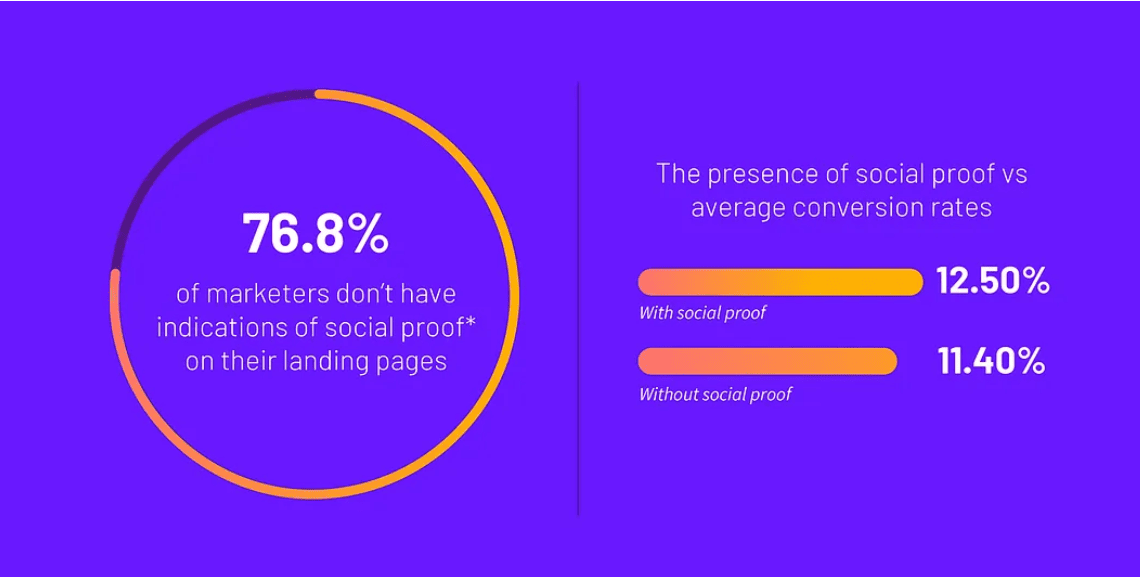
Source
19. Social media is an effective way to drive traffic to landing pages, according to 51.5% of marketers. Additionally, 43.6% find email marketing helpful for promoting landing pages, while 35.6% prefer using search engine optimization.
20. Personalized CTAs are super effective as they convert 202% better than standard ones. Consumers appreciate personalization because it means they receive relevant information tailored to their interests.
21. Long landing pages can generate 220% more leads than shorter ones, so marketers are adding more information for serious buyers.
22. Including videos on landing pages can improve conversions by 86% since 90% of consumers prefer video content. This is why smart marketers are increasingly incorporating videos into their landing pages.
23. When it comes to signup rates, landing pages lead with 23%, compared to popups, which account for 66% of all signup forms. Landing pages only make up 5.1% of signup forms, highlighting a great opportunity to create more landing pages and increase conversions.
Source
Landing Page Load Time Statistics
How fast your landing page loads matters a lot. If it’s slow, visitors might leave before it even fully appears.
Below we’ve shared the landing page stats that highlight the importance of speed to keep visitors interested and improve your chances of converting them.
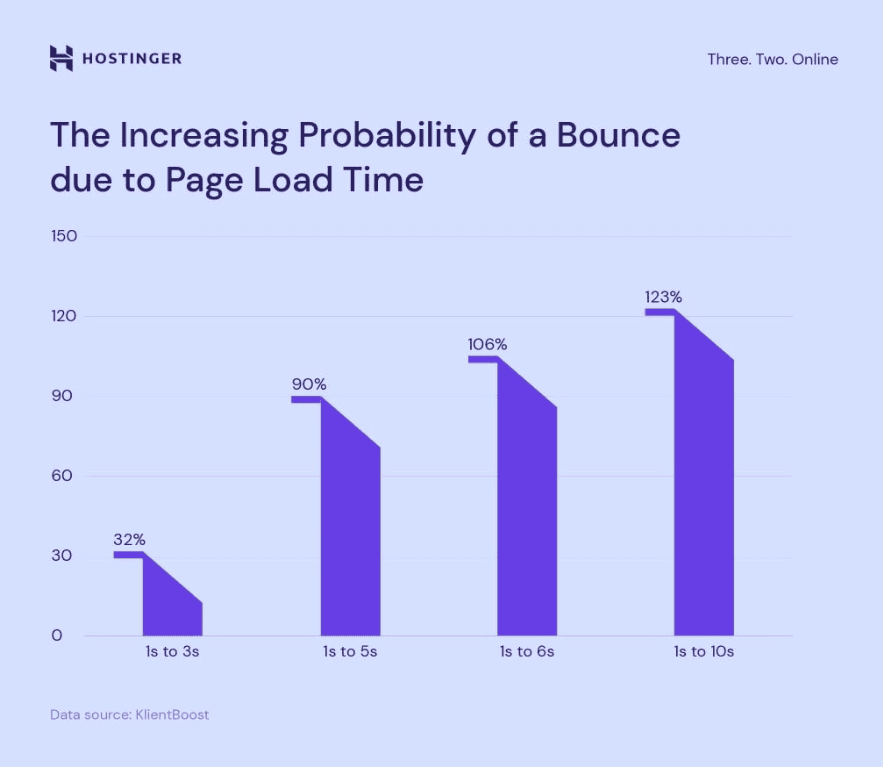
24. A website that loads in 1 second has a conversion rate 3 times higher than one that loads in 5 seconds. If it loads in 10 seconds, the conversion rate drops even further, with the 1-second site performing 5 times better.
25. For e-commerce, a 1-second load time gives a site a conversion rate 2.5 times higher than one that loads in 5 seconds. Compared to a 10-second load time, the 1-second site has 1.5 times higher conversion rates.
26. A study by Portent found that when a page loads in just 1 second, the average conversion rate is nearly 40%. However, at 2 seconds, it drops to 34%, and at 3 seconds, it falls to 29%. By 6 seconds, the conversion rate hits its lowest point.
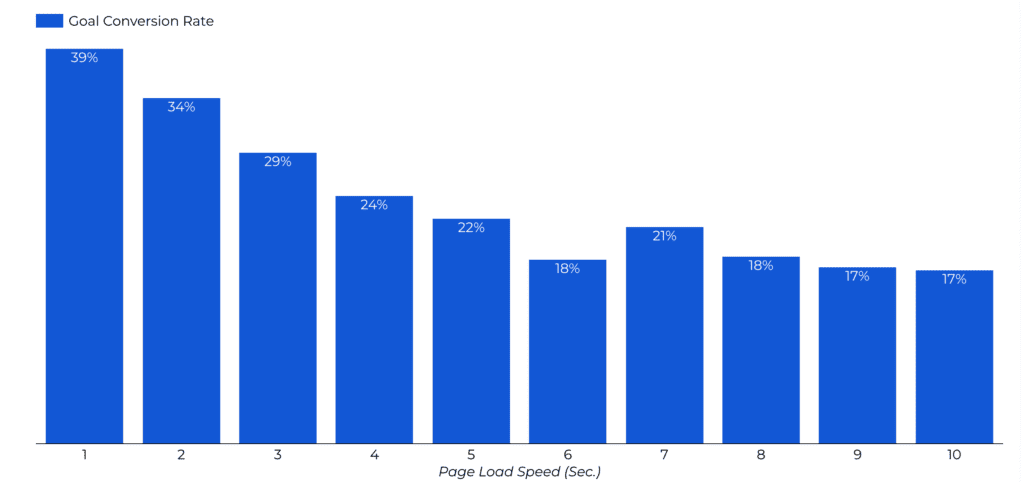
Source
27. The best e-commerce conversion rates happen between 1 and 2 seconds, with a 3.05% conversion rate at 1 second. At 4 seconds, the rate drops to just 0.67%, and beyond that, it stays below 2%.
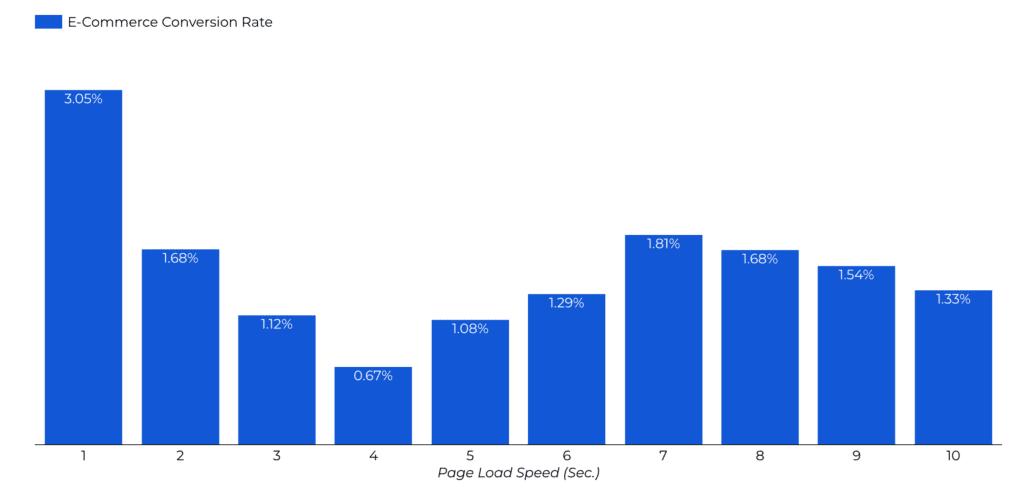
Source
28. On mobile, 70% of landing pages take more than 5 seconds to show the content at the top of the page and 7 seconds or more to load all the visuals.
29. Speed is critical for mobile users—53% of visitors leave a page if it takes more than 3 seconds to load. This highlights how important fast-loading websites are for keeping visitors engaged.
Landing Page Optimization and A/B Testing Statistics
A/B testing, or split testing, is a way to compare two or more versions of content to see which one works better.
For landing pages, this could involve testing different placements for call-to-action buttons, product images, or writing styles to improve conversions.
Below, we’ve gathered various landing page stats that show how companies optimize their pages for better results.
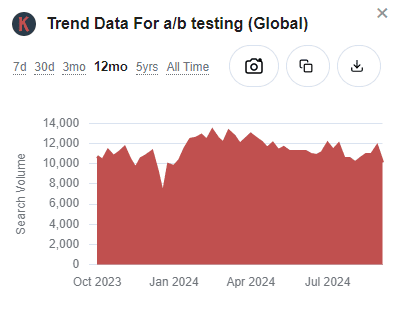
30. According to Keywords Everywhere, 49,500 searches for A/B testing happen every month, and this number has stayed steady over the past year, showing that users find this method effective.
31. Personalized call-to-action (CTA) buttons convert 42% more customers than generic ones. Knowing your audience is key to making an appealing offer.
32. After watching a video, people remember 95% of the information, compared to just 10% for text, which is why many companies are investing in video marketing.
33. Using the right headline can increase conversions by 307%. A catchy headline grabs attention and shifts focus to your offer. Using the exact words that people search for has proven effective—ConversionLab gained 31.4% more signups using this tactic.
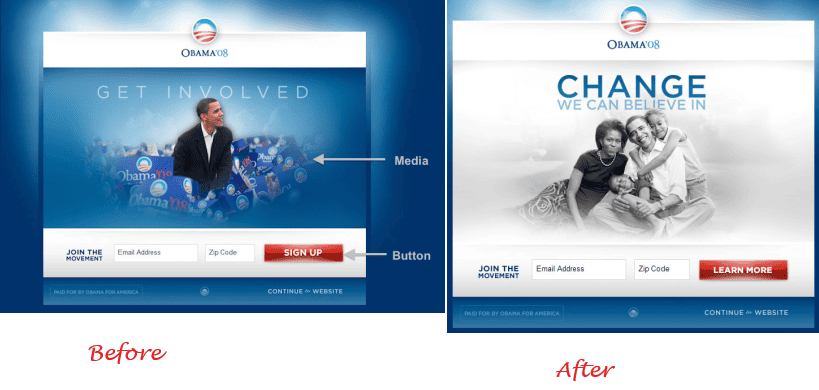
34. A/B testing hero images and CTAs helped Obama raise an extra $60 million for his campaign, as noted by Dan Siroker, who was behind the campaign.
Source
35. Yuppiechief, a VWO customer, found that removing the navigation menu from their landing page doubled their conversions from 3% to 6%.
36. For A/B testing to be effective, you need at least 25,000 visitors. A common reason for failed tests is not having enough data.
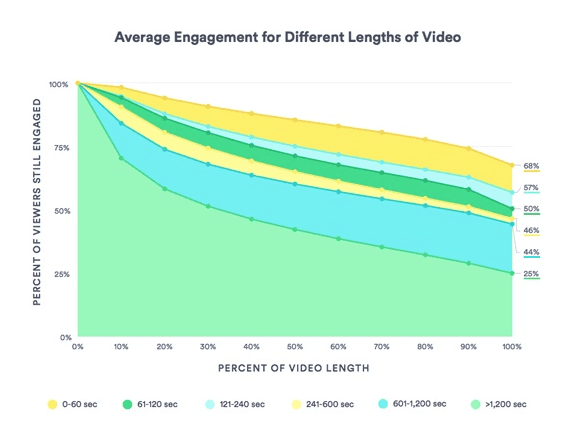
37. A/B testing can help businesses boost their average revenue per user by up to 50%. Currently, 44% of companies use A/B testing tools to run tests and analyze results.
Landing Page Design Statistics
When people visit your website, they have certain expectations. The look and the overall vibe of your landing page can greatly impact user experience.
Below, we’ve shared some landing page stats that show how design choices, like colors and layout, can either attract visitors or throw them away, helping you make better design decisions.
38. To improve your landing page performance, try keeping it simple and straight to the point. Shorter landing pages with clear calls to action (CTAs) perform 13.5% better than longer ones.
39. In tests done with CXL, using red buttons for calls-to-action (CTAs) performed 20% better than green ones on average.
40. Adding color to your content can boost readership by 80%, which helps generate more leads. This is because more people read and engage with the content in product guides or marketing materials.
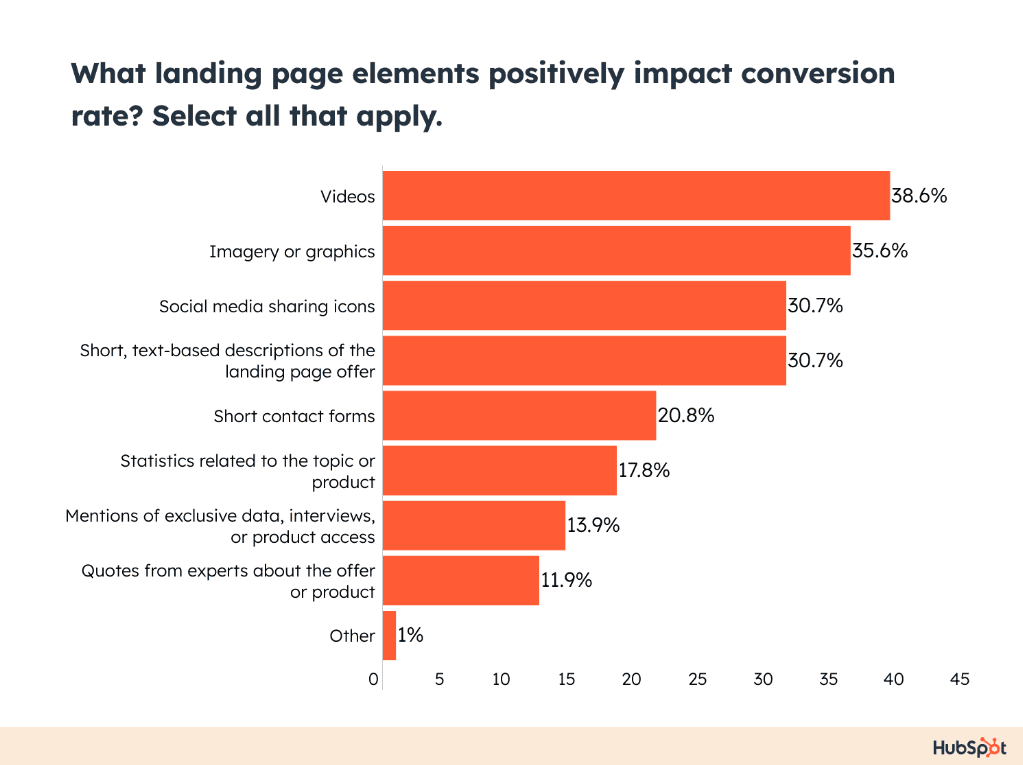
41. A survey by HubSpot found that 38.6% of experienced marketers believe videos make the biggest impact on conversions when placed on landing pages, while 35.6% say images and graphics work best.
Source
42. Dynamic landing pages, which automatically change based on things like the user’s location, browsing history, or device, convert 25.2% more mobile users.
43. 73% of landing pages use human faces, especially in the main section, to create an emotional connection and grab attention—especially in the often unemotional SaaS industry.
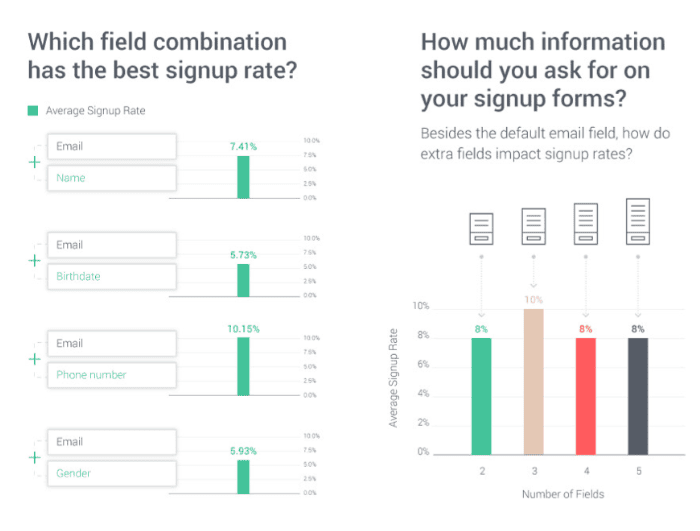
44. Omnisend’s study showed that landing pages with sign-up forms asking for a birth date or gender had lower conversion rates (5-6%). Forms asking for just an email and phone number performed best, with a conversion rate of 10.15%.
Source
45. Similar to CTA’s, including more than one offer on a landing page can drop your conversion rates by as much as 266%. It’s more effective to focus on guiding visitors toward a single, clear offer.
46. A Nifty study found that 36% of the top-performing landing pages included testimonials from satisfied customers.
47. According to Murray Datis Mohsenipour, using a two-step form to collect customer info is 30% more effective than a single, longer form. Breaking the process down helps avoid overwhelming users with too many fields.
Landing Page User Behavior Statistics
Understanding how users interact with your landing pages is essential.
Here are some key landing page stats that reveal what visitors click on and how they behave on your website. It will let you tailor your content to keep them engaged longer.
48. A better user experience (UX) design can boost conversion rates by up to 400%. Think about it—would you buy from a site that looks outdated or untrustworthy? Most people wouldn’t, which is why a professional-looking website is key to building trust.
49. 18% of buyers abandon their carts due to a long, complicated checkout process. A smooth UX design removes the roadblocks, making it easier for users to complete their purchase.
50. Almost half of consumers (47%) expect a page to load in 2 seconds or less. If it takes over 3 seconds, 40% of visitors will leave. Even one second delay can cause a 7% drop in conversions.
Source
51. Adding live chat to landing pages can increase sales by 20%. Customers who chat are 16 times more likely to buy and spend 13 times more than those who don’t.
52. Addressing buyer concerns directly on landing pages can increase conversions by up to 80%.
53. For long-form content, a scroll depth of 75% is considered good. A 50% scroll depth might be enough for websites focused on conversions.
54. Mobile devices make up about half of all web traffic globally. In late 2023, mobile (excluding tablets) generated 58.67% of worldwide website traffic. Mobile pages often load slower than desktops, even though mobile users expect faster load times.
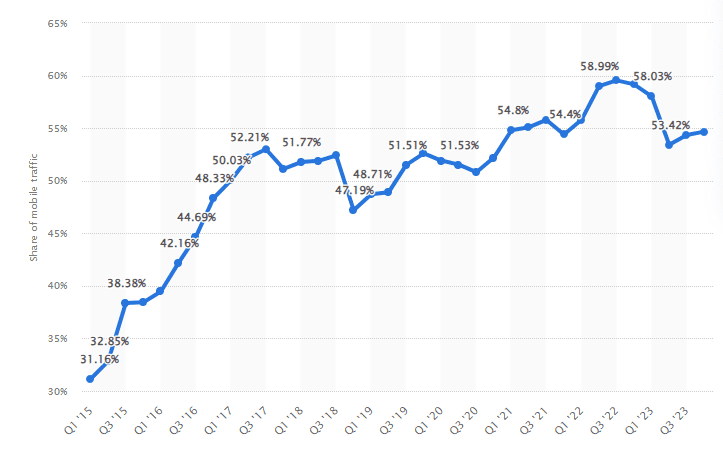
Source
55. Most websites see exit rates of less than 25% or between 26-40%, depending on the type of business and content on the landing page.
56. On average, visitors spend about 52 seconds on a page across different industries. This time shows how well the content keeps people engaged and interested.
B2B Landing Page Statistics
B2B landing pages have a strong average conversion rate of 13.28%, with webinars being especially good at capturing high-quality leads.
Discover in these B2B landing page stats how B2B stands out from B2C and learn tips to use them effectively in these stats.
57. Among the best B2B content marketers, 64% have effectively nurtured their subscribers, audiences, or leads, compared to just 49% of all respondents.
58. 67% of those measuring content performance found that conversions from landing pages give important insights into how well their B2B content is doing.
59. A B2B website that loads in 1 second can have a conversion rate 3x higher than one that takes 5 seconds to load.
60. Since 91% of B2B professionals prefer webinars for learning and lead generation, landing pages promoting webinars can be very effective for attracting quality leads.
61. B2B and B2C websites with at least 41 landing pages can generate over 500 leads, while sites with just 1 to 5 landing pages typically bring in fewer than 100 leads.
Source
B2C Landing Page Statistics
In B2C, tackling buyer concerns can boost conversion rates by 80%, highlighting how crucial trust is in consumer choices.
These landing page stats reveal how to enhance your B2C landing page for improved engagement and customer loyalty.
62. Addressing buyers’ concerns on a landing page can boost conversion rates by 80%, reassuring visitors about the safety and benefits of sharing their personal info.
63. If a brand offers an impersonal experience, 62% of consumers say they would stop being loyal to that brand.
Source
64. Internet users typically read only about 20% of the text on web pages. They often rush through content or have short attention spans, making it hard to focus on longer articles.
65. B2C content is shared nearly ten times more than B2B content, as it targets consumers who are more likely to share than businesses.
66. Around 68% of people prefer watching videos that are less than a minute long. Most viewers tend to avoid longer clips, and they’re more likely to watch a video all the way through if it’s short.
Source
Local Landing Page Statistics
If your business serves specific areas, local landing pages are vital.
These stats show how personalizing content for local audiences can lead to more conversions and help you connect better with potential customers nearby.
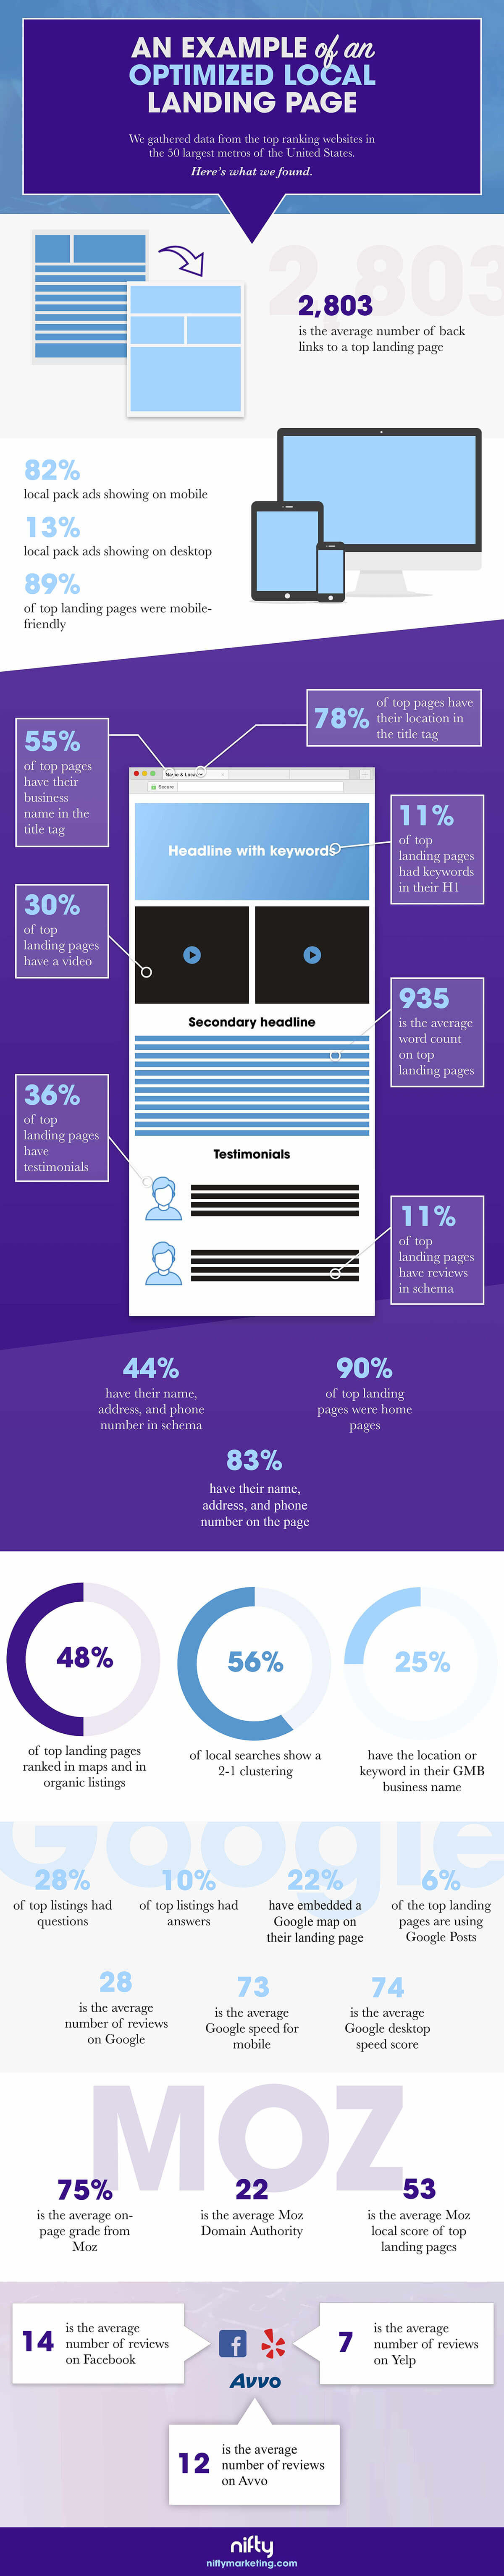
67. Nifty studied the best landing pages from top websites in 50 major U.S. cities. They found that while 89% of the top local landing pages are mobile-friendly, 90% are actually homepages.
68. Nifty’s research revealed that 78% of these local landing pages on Google have a location mentioned in the page’s title tag. Additionally, 25% include their business location or a related keyword in their Google Business Profile title.
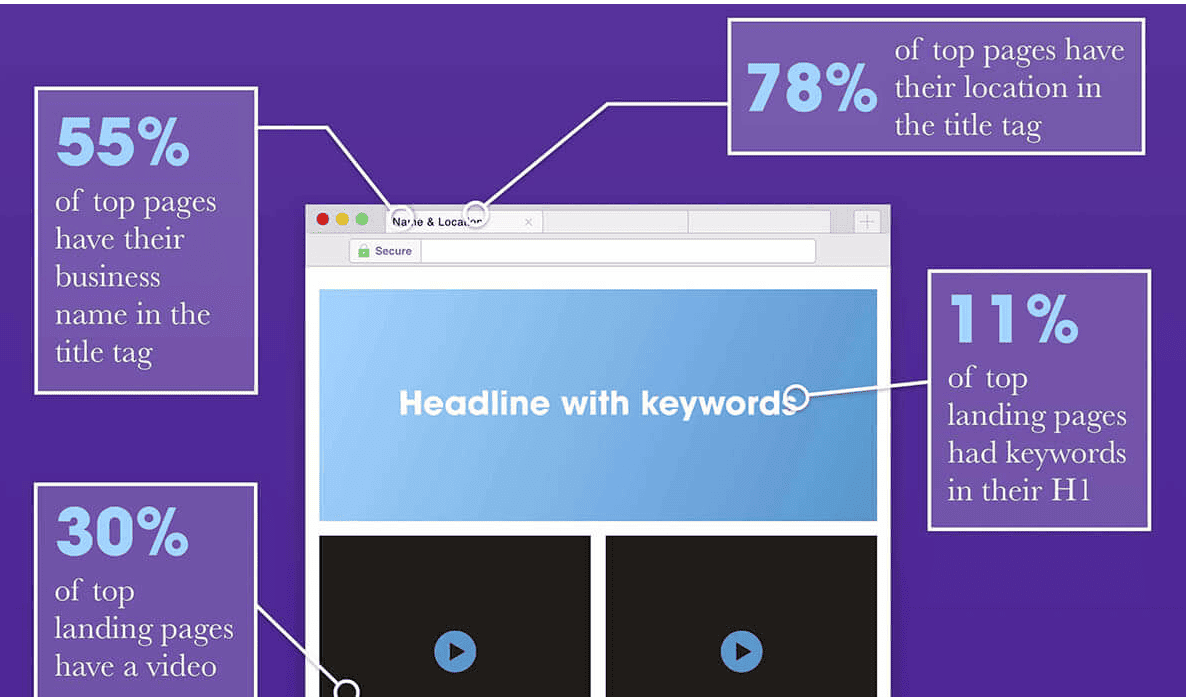
Source
69. The title tag of 55% of the highest-ranked local landing pages includes the business name. Adding the business name boosts credibility, leading to more trust, more leads, and better conversion rates.
70. Nifty’s analysis also showed that 36% of the top local landing pages feature customer testimonials, 28% address questions, and 30% include videos.
71. On average, these top local landing pages have about 935 words, but only 11% use keywords in the H1 heading.
Landing Page Cost Statistics
The cost of making a landing page can range from a few hundred dollars with DIY tools to several thousand if you hire top professionals.
Check out these landing page stats to find the best option for your budget and goals:
72. Freelancers who create landing pages typically charge between $50 and $500 an hour. Fixed-cost freelancers might ask for $1,000 to $10,000, but you can find prices as low as $5 or $45 on sites like Upwork or Fiverr.
73. If you use a landing page builder, expect to pay between $19 and $399 per month, depending on the platform and pack you choose.
74. A web design and development agency usually charges between $500 and $3,000 for each landing page, with prices varying based on how complex the project is and your business goals.
75. For an advanced landing page, the average cost usually falls between $1,160 and $10,000, depending on the service provider and design needs.
76. A custom-designed landing page will cost between $500 and $3,000. This range includes about $500 for a yearly subscription to a high-quality landing page platform and up to $3,000 for hiring agencies or skilled freelancers.
Conclusion
To wrap things up, now is the perfect time to focus on our latest landing page stats. These stats clearly show that creating multiple pages, personalizing content, and addressing customer concerns are main factors in increasing engagement.
Whether it’s targeting different segments or using optimization techniques like mobile-friendly designs and fast load times, your efforts will pay off.
As you continue to test and refine your pages, you’ll see many improvements in performance.