Driving traffic to your website is just the start. The real challenge is turning those visitors into actual customers. This doesn’t just happen on its own. You need to use conversion rate optimization (CRO) strategies and tools to boost those conversion rates, even if just a little.
The great news? It doesn’t take a huge effort to achieve significant results. For example, increasing your conversion rate from 1% to 3% can triple your revenue.
And even better, you don’t have to guess how to make these improvements. We’ve done the legwork and gathered the latest and most relevant conversion rate optimization stats to guide you.


What Is Conversion Rate Optimization?
Before we jump into the conversion rate optimization stats, let’s clarify what CRO is all about. Simply put, Conversion Rate Optimization (CRO) is all about fine-tuning your website to boost the actions you want users to take.
Whether that’s filling out a form, requesting a quote, or making a purchase, CRO helps you analyze pages that might be attracting good traffic but aren’t converting visitors into customers.
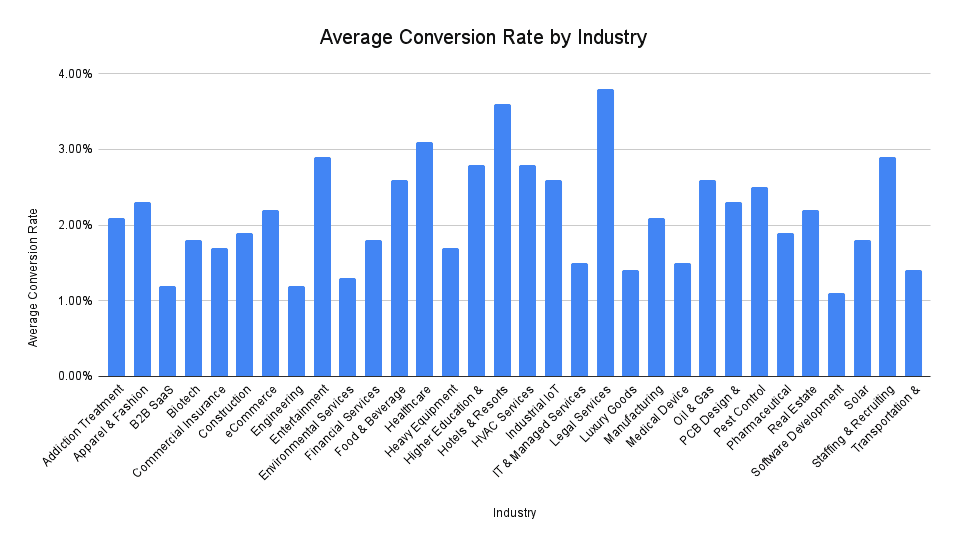
Now, you might think, “What’s a good website conversion rate to aim for?” It completely depends from industry to industry.
For example, the jewelry and apparel industry has the lowest conversion rate (1.57%). On the flip side, physicians and surgeons converted more than 13% of their visitors.
General Conversion Rate Optimization Stats
Let’s kick off this list of Conversion Rate Optimization stats by diving into some general numbers that shed light on how conversions work.
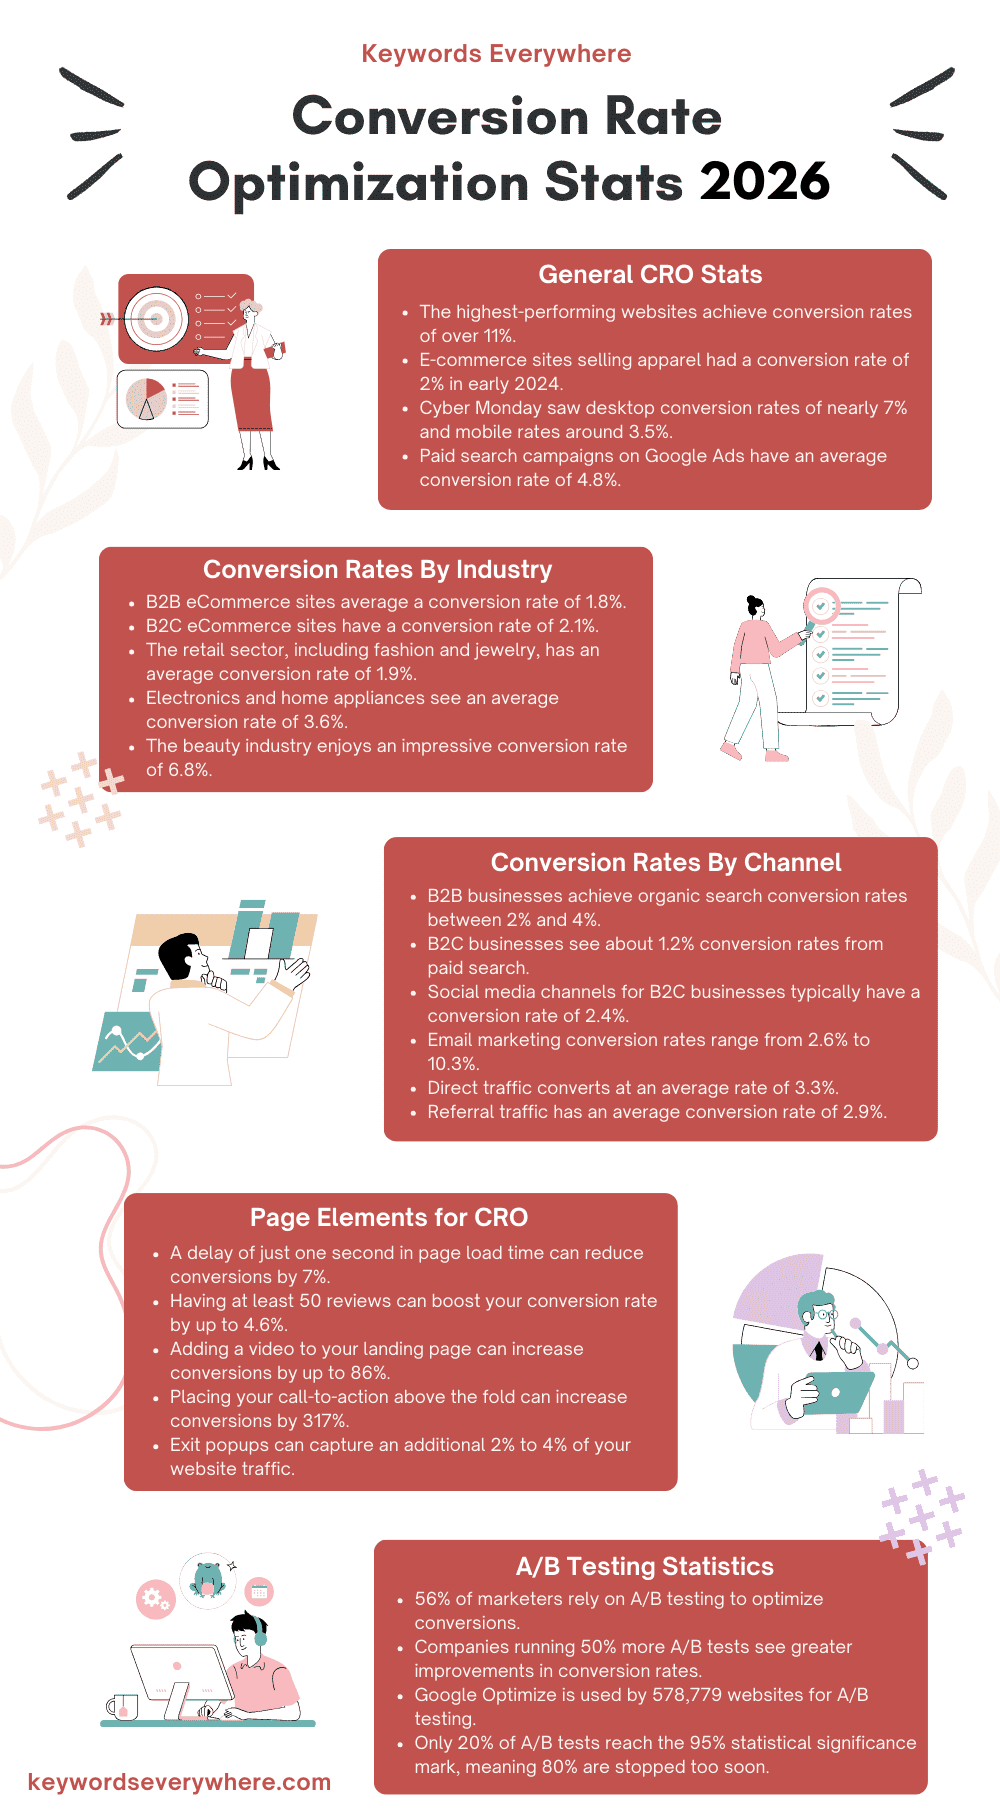
1. On average, websites convert about 2.35% of their visitors into customers. While conversion rates can differ depending on the industry, if your site is hitting that 2-3% range, you’re doing alright. However, top-performing websites are converting at 11% or higher so if you want to reach the big leagues, aiming for that level is key.
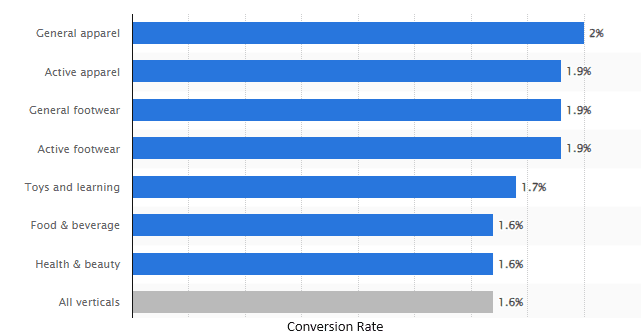
2. Regarding online shopping, e-commerce sites selling general apparel had the highest conversion rate at 2% in early 2024, followed by active apparel at 1.9%. Overall, the average conversion rate for e-commerce sites across various sectors was just over 1.5%.
Source
3. In devices, tablets led the way in December 2023 with a 3.1% conversion rate on e-commerce sites, followed by desktops at 2.8%. The e-commerce industry as a whole had an average conversion rate of 2.5%.
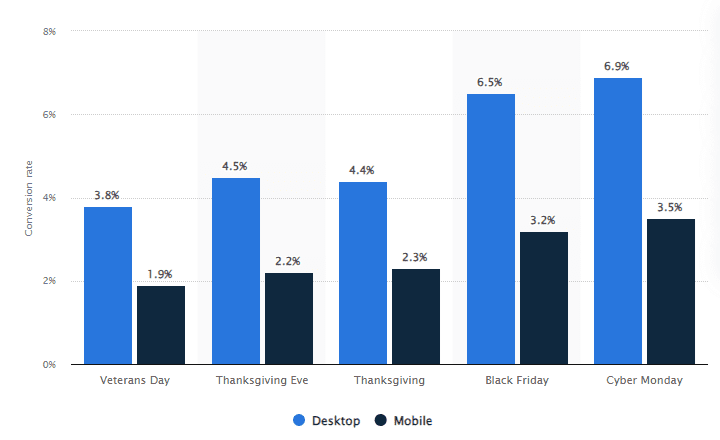
4. During the 2023 holiday season, Cyber Monday saw the highest conversion rates for online shopping in the U.S., with nearly 7% for desktop users and around 3.5% for mobile. Black Friday wasn’t far behind, with desktop conversion rates at about 6.5% and mobile at 3.2%.
Source
5. For paid search campaigns on Google Ads, you can expect an average conversion rate of around 4.8%, which is pretty solid.
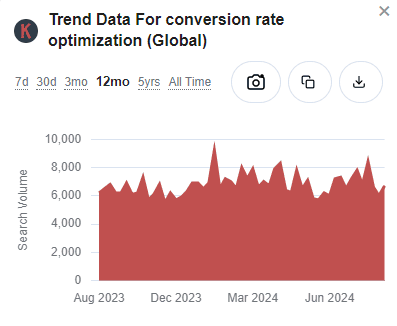
6. According to Keywords Everywhere, interest in optimizing conversion rates has remained steady over the past year, showing that companies are keen on boosting their conversion success.
Conversion Rate Across Industries
Improving your conversion rate is crucial for any business. We’ve already covered that.
But what exactly is a good conversion rate to aim for? The ideal conversion rate can vary depending on the industry.
To help you determine your target conversion rate, we’ve gathered some CRO statistics that show conversion rates across different industries.
7. B2B eCommerce: The average conversion rate is 1.8%. To boost this, we suggest that B2B companies should focus on understanding their customers’ unique needs, creating relevant content, and using targeted strategies to simplify the complex B2B buying process.
8. B2C eCommerce: The average conversion rate is 2.1%. To increase this, consider personalizing product recommendations based on visitor behavior, improving the clarity of product pages, and testing various promotional strategies.
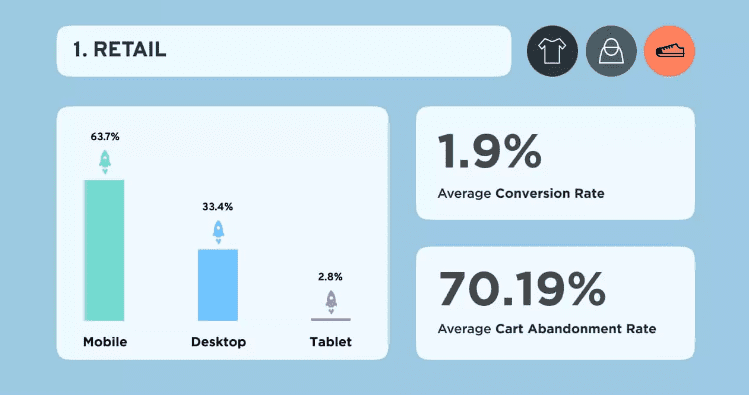
9. Retail (including fashion, jewelry, shoes, etc.): This sector has an average conversion rate of 1.9%, but it also faces a very high cart abandonment rate of 70.19%. The fashion industry is on track to reach a value of $1,626.97 billion by 2030.
Source
10. Electronics and Home Appliances: These products see a solid average conversion rate of 3.6%. In addition to this, they have a high average revenue per user, sitting at $111.60.
11. Home Decor: This industry also has a 1.9% average conversion rate but struggles with a very high cart abandonment rate of 88.64%.
12. Personal Care Products: With an impressive 6.8% average conversion rate, the beauty industry was valued at $483 billion in 2020 and is expected to exceed $716 billion by 2025. The health and beauty sector is also projected to grow at an annual rate of 12.1% from 2021 to 2026.
13. Other Industries: Professional services have an average conversion rate of 4.6%, finance is at 3.1%, travel at 2.4%, healthcare at 3%, higher education at 2.8%, and finally, food and beverages see a 4.9% average conversion rate.
Source
Conversion Rate By Channels
Knowing how different marketing channels perform can help you fine-tune your strategy. Each channel has its own characteristics that influence how visitors convert on your website.
Here are some important conversion rate optimization stats for channels like organic and paid search, social media, email marketing, and direct traffic.
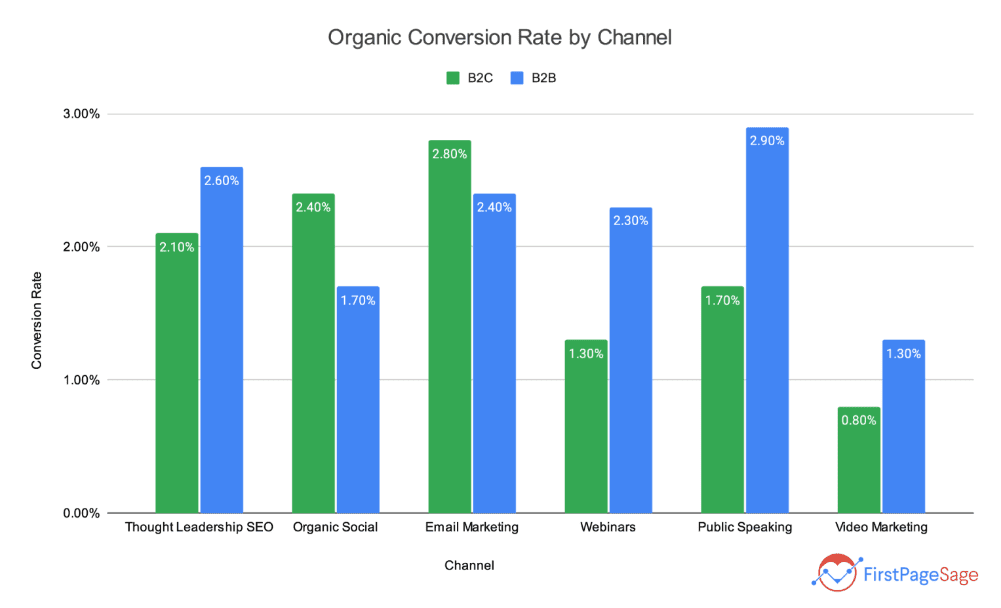
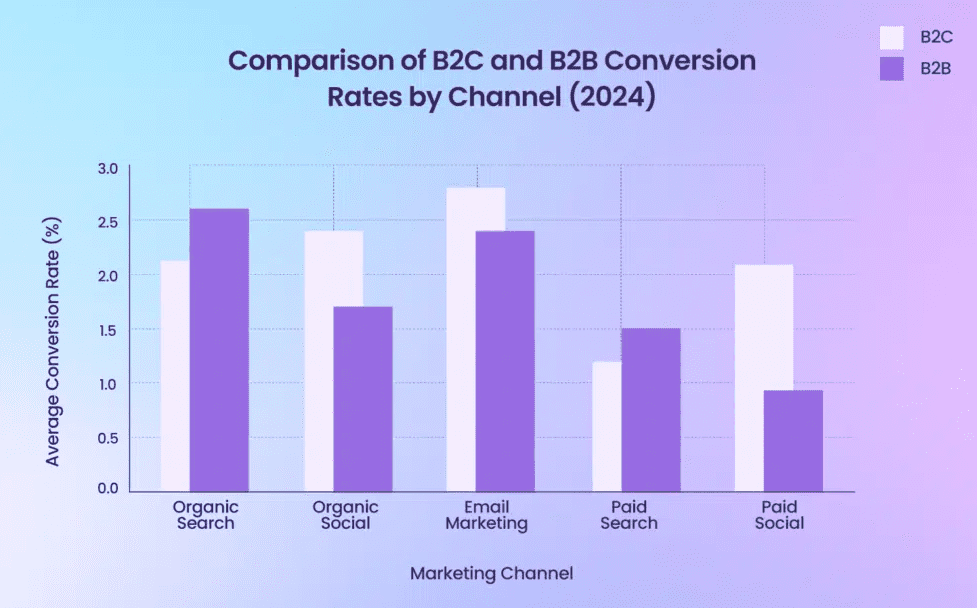
14. Organic Search: Conversion rates generally range from 2% to 4%. B2C businesses see about 2.1%, while B2B businesses are slightly higher at 2.6%.
Source
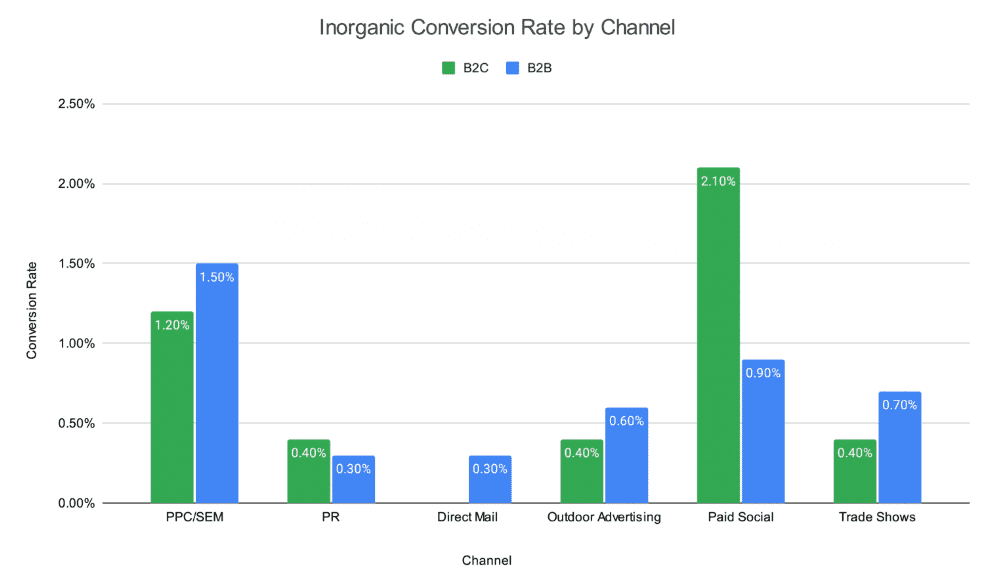
15. Paid Search (PPC): Conversion rates usually hover around 3%, though they can vary between 2% and 3% depending on the campaign. B2C typically has a lower rate of 1.2%, compared to B2B at 1.5%.
Source
16. Social Media: Conversion rates are usually lower, averaging around 1.5%. For organic social media, B2C businesses see about 2.4%, while B2B is at 1.7%. Paid social media conversion rates show B2C at 2.1% and B2B at 0.9%.
17. Email Marketing: This channel performs well, with conversion rates ranging from 2.6% to 10.3%. B2C email marketing typically has a conversion rate of around 2.8%, with B2B close behind at 2.4%.
18. Direct Traffic: This includes repeat visitors and users already familiar with your brand, leading to an average conversion rate of about 3.3%.
19. Referral Traffic: This can come from other websites, email campaigns, affiliate links, or online communities, and has an average conversion rate of around 2.9%.
20. When comparing channels, B2B tends to have higher conversion rates in organic and paid search, while B2C performs better in organic social media, email marketing, and paid social media.
Source
Page Elements For CRO Statistics
CRO isn’t just about driving more traffic through paid ads or SEO.
While SEO and ads are crucial for bringing more visitors to your site, they don’t guarantee conversions.
If your page or site isn’t optimized for conversions, it will have a lower conversion rate compared to one that is.
Here are some key conversion rate optimization stats that show how different page elements can impact and boost the percentage of visitors who convert.
21. Just a 1-second delay in loading time can reduce conversions by 7%. So if you think site speed only matters for SEO, think again. Faster pages lead to more conversions.
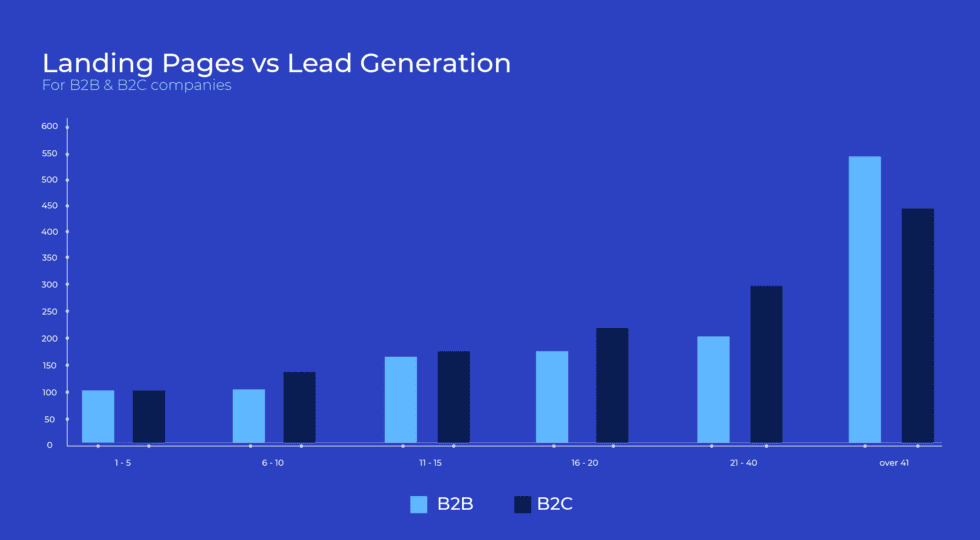
22. Increasing your landing pages from 10 to 15 can boost your leads by 55%. Creating dedicated landing pages for each campaign is a smart move that helps convert more of your traffic into leads.
Source
23. A quarter of companies say that rapidly evolving technology is their biggest challenge in improving conversion rates. While working on conversion rates, many struggle to keep up with new technologies, with 20% having difficulty understanding online behavior at scale and another 20% finding it hard to identify areas for improvement.
24. Having at least 50 reviews can increase your conversion rate by up to 4.6%. Why? Because when potential customers see a product or service with lots of reviews, it gives them a sense of trust and reliability.
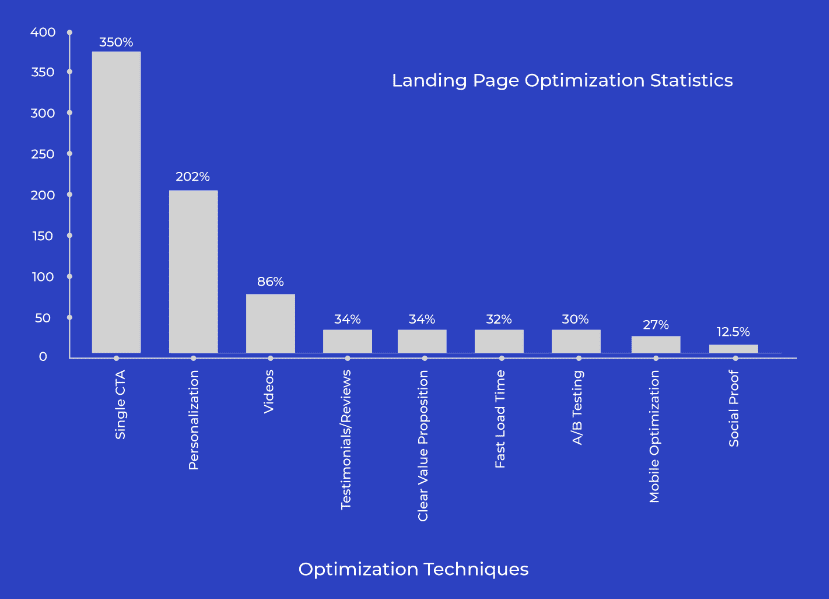
25. About 30% of the best landing pages include videos, and adding relevant video content can increase conversions by up to 86%. Videos grab attention and keep visitors engaged, which drives more conversions.
26. Placing your calls-to-action (CTAs) above the fold can boost conversions by 317%. Visitors often decide within seconds if they’ll stay on your page, so making sure they see your CTA right away is crucial.
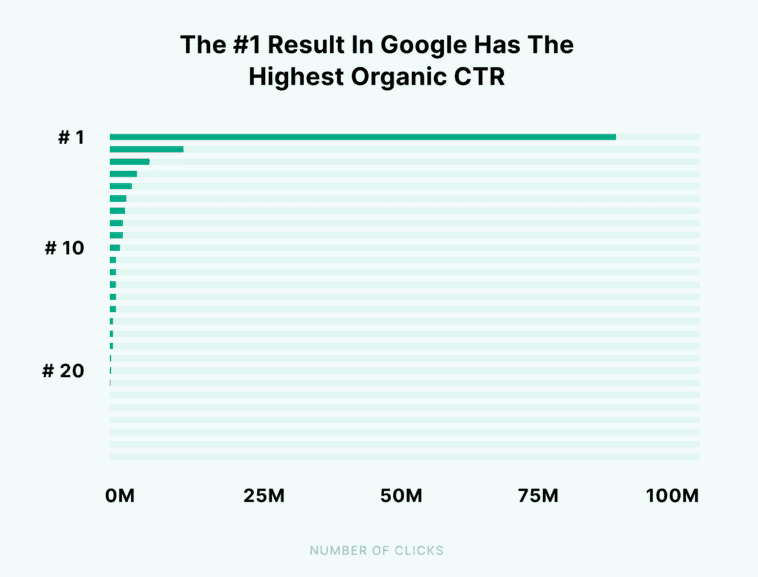
27. The top result on Google’s search page has an average click-through rate (CTR) of 27.6%, making it 10 times more likely to be clicked than the result in the #10 spot. There’s a sharp drop in CTR for results on the second page, with only 0.63% of searchers clicking on something from there.
Source
28. Exit popups can convert an additional 2% to 4% of your website traffic. The idea is that a targeted message or offer right before someone leaves can encourage them to stay and take action.
29. Adding a live chat feature can increase revenue per chat hour by 48% and boost conversion rates by 40%. The real-time interaction helps build trust and provides immediate assistance, leading to more successful conversions.
A/B Testing Conversion Rate Optimization Statistics
CRO is an ongoing process. You need to keep testing your marketing materials and landing pages to figure out what’s working, what isn’t, and how you can make things better.
Here are some CRO stats that reveal how other businesses test and improve their conversion rates.
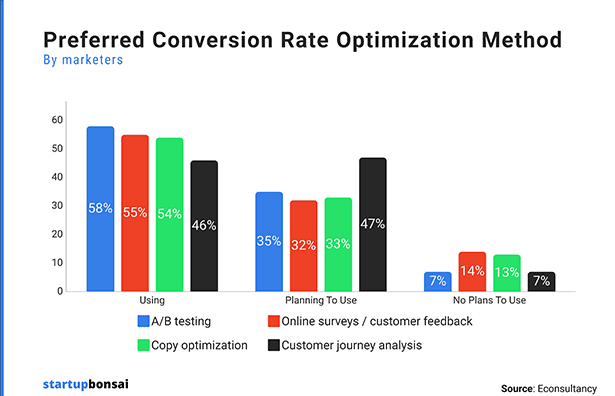
30. A whopping 56% of marketers prefer A/B testing as their go-to CRO method. So, what’s A/B testing? It’s when you create two versions of your marketing materials, change just one element, and see which one performs better in terms of conversion rates.
Source
31. Companies that see the biggest improvements in conversion rates tend to run 50% more tests. The takeaway? The more you test, the more likely you are to succeed with your CRO efforts.
32. The United States leads the way in A/B testing, with 520,415 websites running these experiments.
33. Google Optimize is the most widely used platform for A/B testing, with 578,779 websites using it.
34. Testing multiple landing pages at once can be very effective, but it’s a more advanced method that many marketers find challenging, so it’s not widely adopted yet.
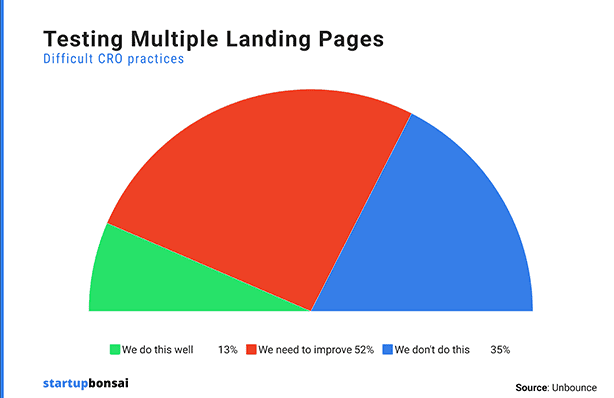
Source
35. Only 20% of A/B tests reach the 95% statistical significance mark, meaning 80% of tests are stopped too soon.
36. Interestingly, 33% of businesses at the highest maturity level in CRO have only been A/B testing for a year or less.
Landing Page Conversion Statistics
Imagine you’re at a party and you’ve just told a joke. Everyone laughs, but how many people really found it funny, and how many are just being polite while thinking, “I need to leave”?
Wouldn’t it be helpful to know who actually enjoyed the joke?
When it comes to landing pages, the conversion rate is like that—it tells you how many visitors genuinely like what you’re offering.
In other words, the conversion rate shows how well your landing page is doing its job.
Here are some key stats about landing page conversion rates:
37. Enterprises with more than 40 landing pages generate 12 times more leads than those with just 1 to 5 pages. So creating separate landing pages for each of your offers can really ramp up the number of leads you get.
38. Removing the navigation bar from landing page can double your conversions. An A/B test by VWO on Yuppiechef’s landing page showed that taking away the navigation bar increased signups from 3% to 6%, effectively doubling their conversion rate.
39. 38% of marketers say that having a video on a landing page helps boost conversions. Videos can show off products and explain ideas in a more engaging way than text alone. In fact, using videos can increase conversions by 86%.
Source
40. Improving your page load speed from 5 seconds to just 1 second can triple your conversions. If your page takes too much time to load, visitors are going to leave before it even fully appears.
41. A test by Jeff Rizzo at Slumber Yard showed that adding a floating coupon to landing pages increased their CTR by 12%. These coupons, like free shipping, can offer small perks that make a big difference.
CRO For PPC Statistics
A solid PPC conversion rate to aim for is between 2.5% and 5%. If your PPC rates are lower than the industry average or not bringing in enough traffic for effective testing, you’ll need to work on improving them.
To help with that, here are some important PPC conversion rate stats you should know:
42. The average conversion rate for B2C PPC is 1.2%, while B2B PPC has a slightly higher average of 1.5%.
43. Paid search landing pages across all industries typically have a 2.35% conversion rate. The top 10% of these pages achieve a much higher rate, around 11.45% or more.
44. In 2024, the average conversion rate for Google Ads is 6.96%. Some industries with the highest rates include Automotive Repair (12.96%), Animals and Pets (12.03%), and Physicians and Surgeons (11.08%). On the lower end, Furniture has a 2.53% rate, Finance and Insurance is at 2.78%, and Real Estate is at 2.91%.
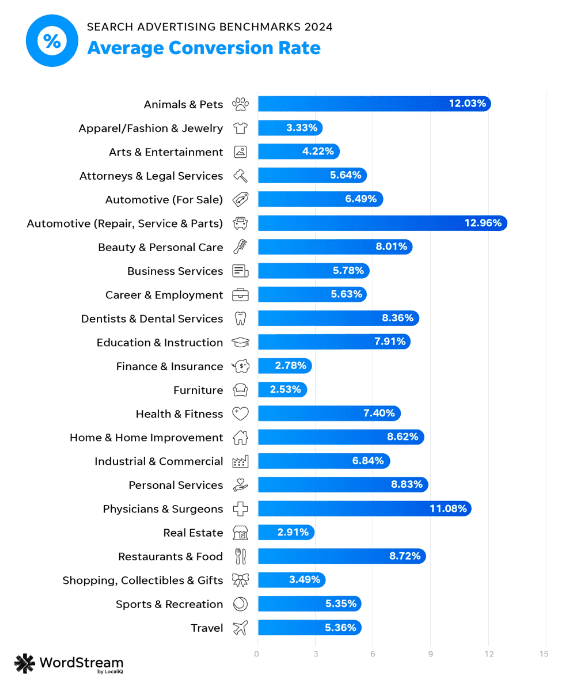
Source
45. The average click-through rate (CTR) for Facebook ads is 0.90%. Industries with higher CTRs include Retail (1.59%), Apparel (1.24%), Beauty (1.16%), and Fitness (1.01%).
46. Retargeting display ads can be very effective, with 70% of retargeted website visitors likely to convert.
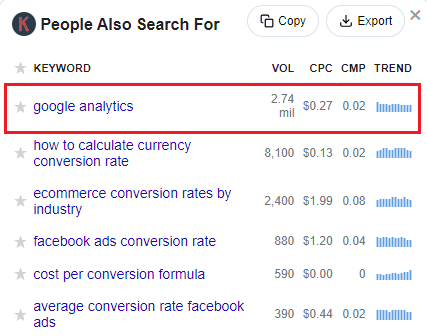
47. According to Keywords Everywhere, around 2.74 million people search Google Analytics to measure conversion rates.
CRO Spending Statistics
Finally, let’s check out how much companies are spending on conversion rate optimization in 2024.
48. Companies typically spend only $1 on CRO for every $92 they spend on getting new customers. This huge gap shows how much more we invest in driving traffic compared to turning that traffic into actual customers.
49. A survey shows that more than half of businesses spend less than 5% of their total budget on CRO.
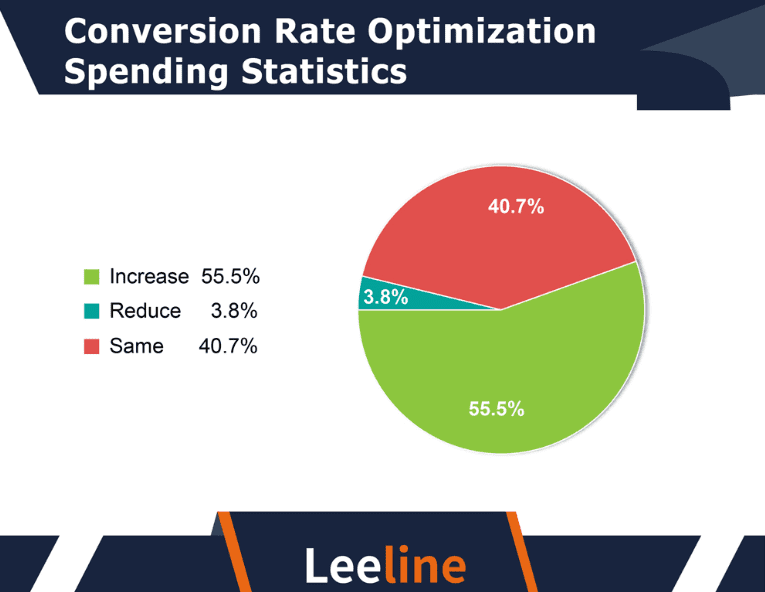
50. On a brighter note, about 55.5% of companies have increased their budgets for conversion optimization. They’re investing in better landing pages, paid ads, and strategies to boost conversions.
Source
51. Around 40.7% of businesses have kept their conversion optimization budgets the same, which is still a positive sign. Only about 3.8% of companies have reduced their spending on conversion optimization.
Conclusion
Looking at these conversion rate optimization stats gives you a clear picture of where you can make improvements and what a good conversion rate should be.
Now is a great time to focus on your own business and website. Use our insights to examine your current setup more closely. Look for areas where you can make changes and explore all the opportunities you might have missed.