Customer retention is one of the most important things for any business to focus on.
But what does it actually mean?
Simply put, customer retention is about keeping your customers coming back for more. When a company has high customer retention, it means customers love the product or service and want to stick around.
Why does this matter?
Understanding your customer retention stats can give you a clear picture of how your customers behave, how well your product is doing, and how effective your customer service and engagement efforts are.
Today, we’re diving into the latest customer retention stats to help you make smarter decisions to keep your customers happy, loyal, and coming back for more.


What is the Customer Retention Rate?
Before jumping into the numbers, let’s break down what customer retention rate means.
Think of CRR as a way to measure how well a business is holding on to its customers over time. It shows the percentage of customers who stay with a company and return.
A high retention rate is a great sign—it means customers are happy with what they’re getting and are likely to stay loyal.
So how do you calculate CRR?
You need to know three things: the number of customers you had at the beginning of a period (S), the number of customers at the end of that period (E), and how many new customers you gained during that time (N).
So the formula to find CRR is:
CRR = ((E-N)/S)*100
This shows how many customers stick around, which helps you understand and improve loyalty.
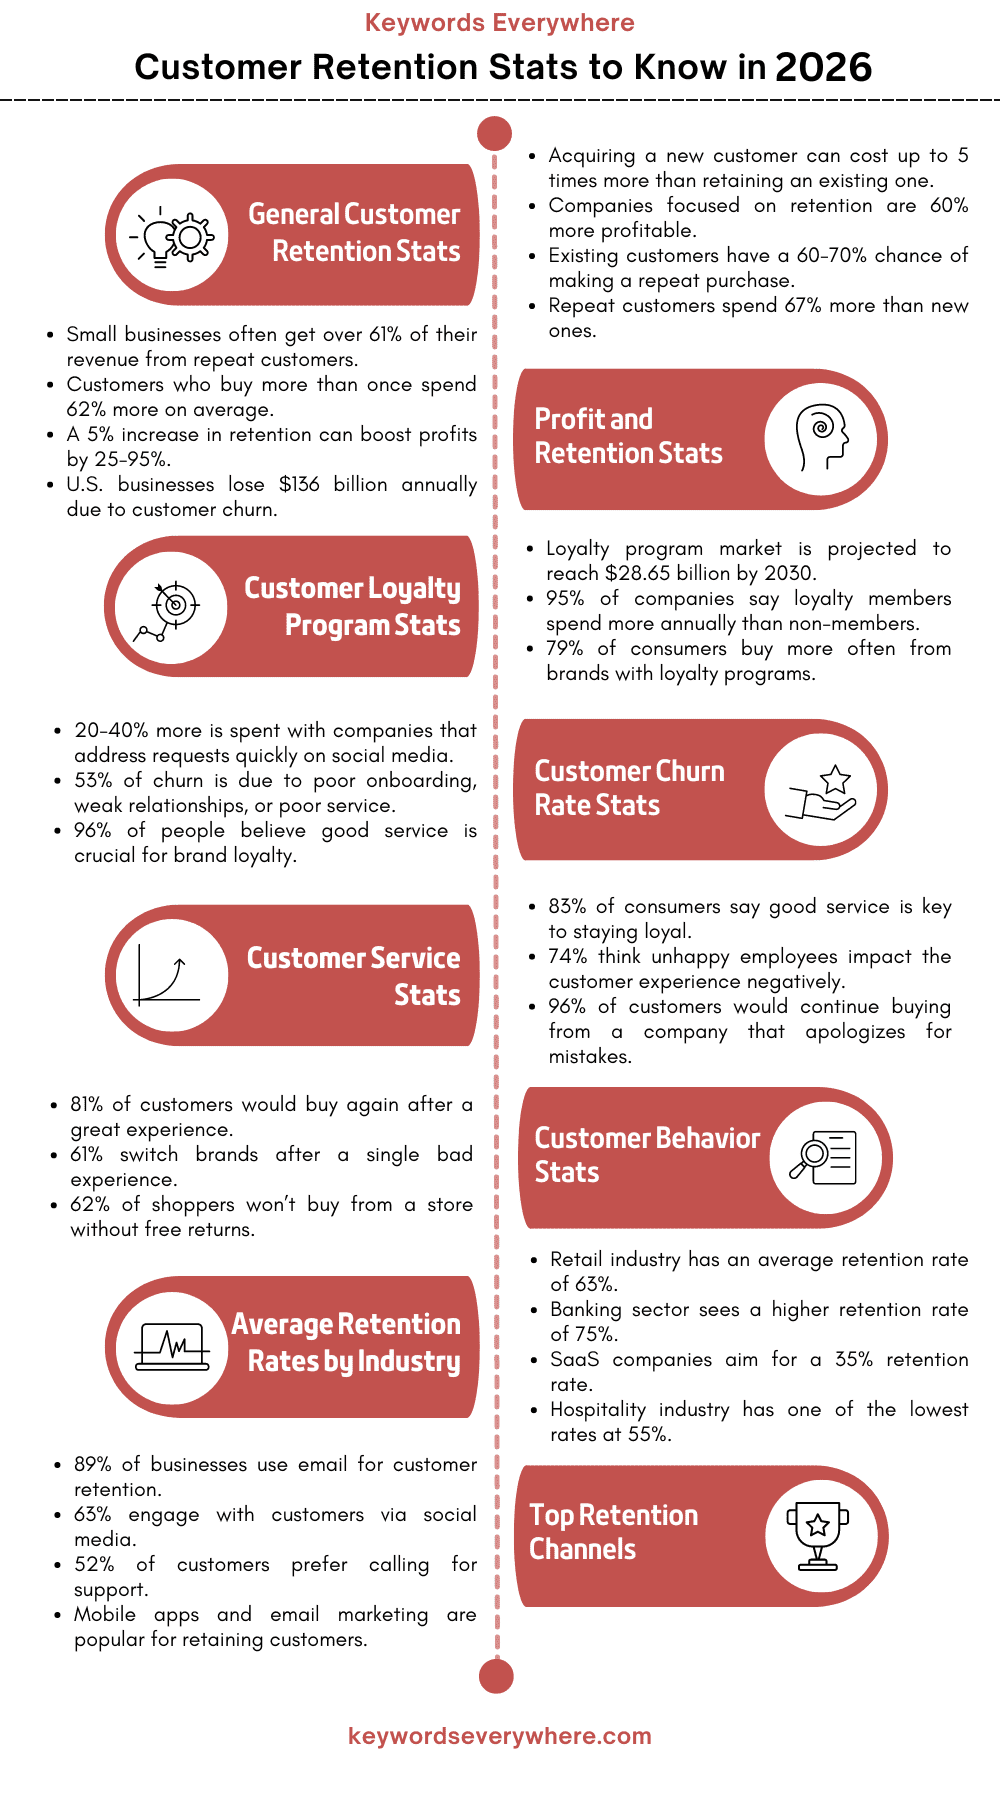
General Customer Retention Statistics
Keeping current customers happy and engaged is often cheaper and easier than finding new ones.
Here are some general stats on customer retention that show why CRR is so important for businesses:
1. Getting a new consumer can cost up to five times more than keeping an existing one. This means it’s often much cheaper to focus on keeping current customers happy.
2. Companies that focus on keeping their customers rather than getting new ones are 60% more profitable. This shows the clear benefits of prioritizing customer retention.
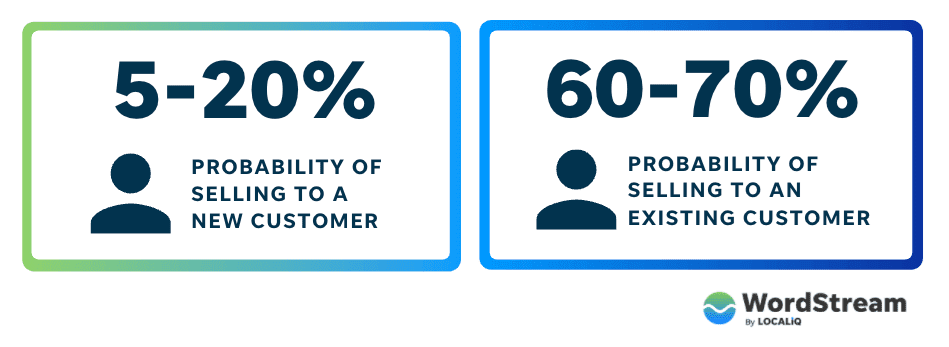
3. You have about 60-70% chance of selling to an existing buyer, compared to only 5-20% for a new one. Simply put, loyal customers are more likely to buy again.
Source
4. The top 10% of customers spend three times more than the other 90%. This shows the immense value of your best customers.
5. Customers who have bought from you before are 9 times more likely to make another purchase than those buying for the first time.
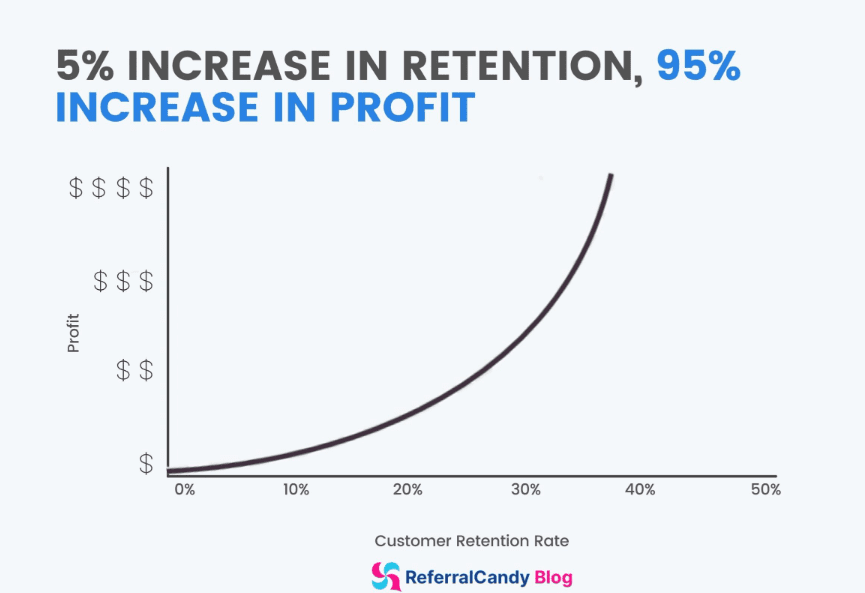
6. A 5% boost in customer retention can grow profits by 25-95%. This highlights how a small improvement in retention can have a big impact on profits.
Source
7. Repeat customers spend 67% more than new customers. This demonstrates the value of keeping customers coming back.
8. U.S. companies could save over $35 billion a year by focusing on keeping their current customers satisfied.
9. Shockingly, 44% of companies still don’t measure their customer retention rate. If you want to succeed, knowing your CRR is essential.
Profit and Customer Retention Statistics
Do you stop responding to customers once they’ve made a purchase?
If you’re ignoring their calls or emails after the sale, you could be facing higher customer churn and losing a lot of potential profit.
Keeping customers around is key to profitability and helps your brand grow steadily over time.
Let’s dive into some of the latest customer retention stats that show how focusing on loyalty can boost profits across different industries.
10. From 2017 to 2060, about $50 trillion is expected to be passed from one generation to another, marking the biggest wealth transfer ever.
11. For 61% of small businesses, more than half their revenue comes from repeat customers, making customer retention crucial.
12. A customer who buys from your online store for the first time has a 27% chance of buying again. After their second purchase, the chance jumps to 49%, and after a third purchase, it goes up to 62%.
13. The longer customers shop with you, the more they tend to spend. For instance, in the beauty and cosmetics industry, customers spend 30% more per order after six months and 45% more after 36 months.
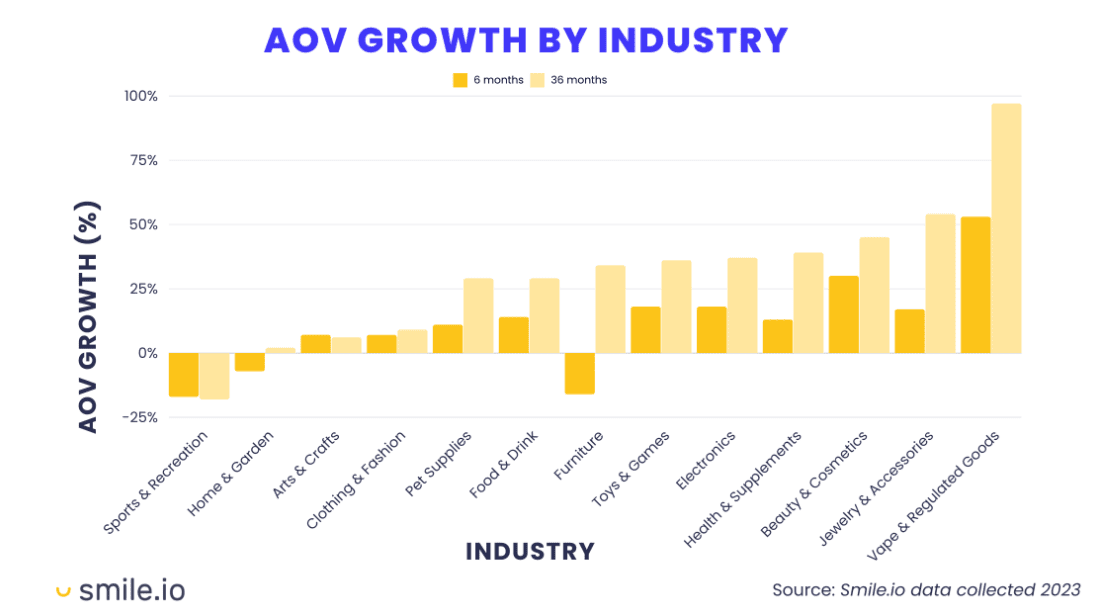
Source
14. U.S. companies lose $136.8 billion a year because customers switch to competitors. If you’re a brand, we highly suggest to perform a competitor gap analysis.
15. According to American Express, 33% of customers will consider leaving after just one bad experience.
16. Loyal shoppers are 5 times more likely to buy again and 5 times more likely to forgive. They are 4 times more likely to refer your business and 7 times more likely to try new products or services.
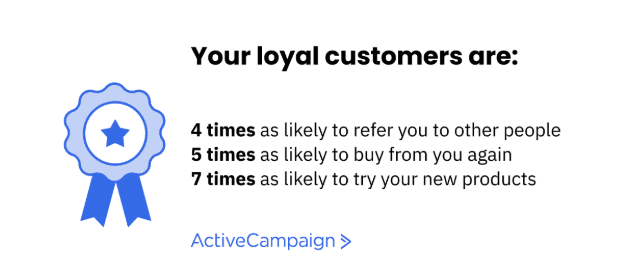
Source
17. Following the Pareto principle, studying the top 20% of your buyers can account for 80% of your sales.
18. When it comes to word-of-mouth, 60% of loyal customers will recommend their favorite brand to friends and family.
Customer Loyalty Program Statistics
A loyalty program can open the door to endless upsell opportunities and increased sales. These programs make customers feel valued and confident that the brand will be there for them.
This boosts brand recognition and encourages customers to talk about your business with others.
Check out the customer retention stats below to see how loyalty programs impact business success:
19. The global market for loyalty programs is forecasted to hit $28.65 billion by 2030.
20. Nearly all companies (95%) report that loyalty program members spend more each year than non-members, with 60% saying they spend two to three times more.
21. A whopping 79% of American consumers say they buy from brands more often if they’re in a loyalty program. About 70% of U.S. consumers in these programs also spend more time with the brand.
22. In 2022, U.S. consumers belonged to an average of 16.6 loyalty programs but actively used less than half of them.
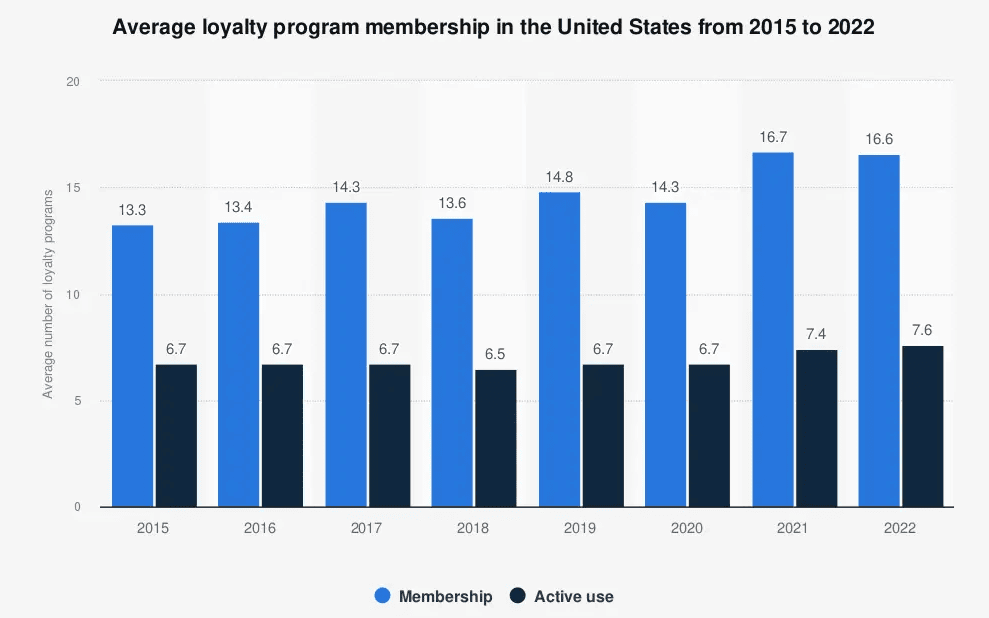
Source
23. Almost 70% of paid loyalty program members join for free shipping, and over 60% are motivated by instant discounts.
24. Loyalty points are working well—64% of program members shop more and spend more to earn more points, according to a study by Visa and Bond.
25. In the U.S., 68% of women and 59% of men belong to loyalty programs, with the highest participation among those aged 55 to 64.
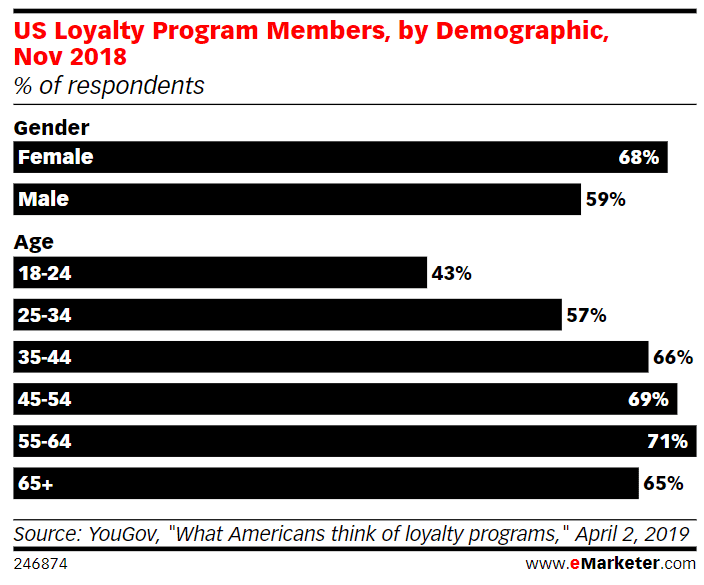
Source
26. 86% of loyal customers will recommend the brand to friends and family, and 66% will leave a positive online review after a good experience.
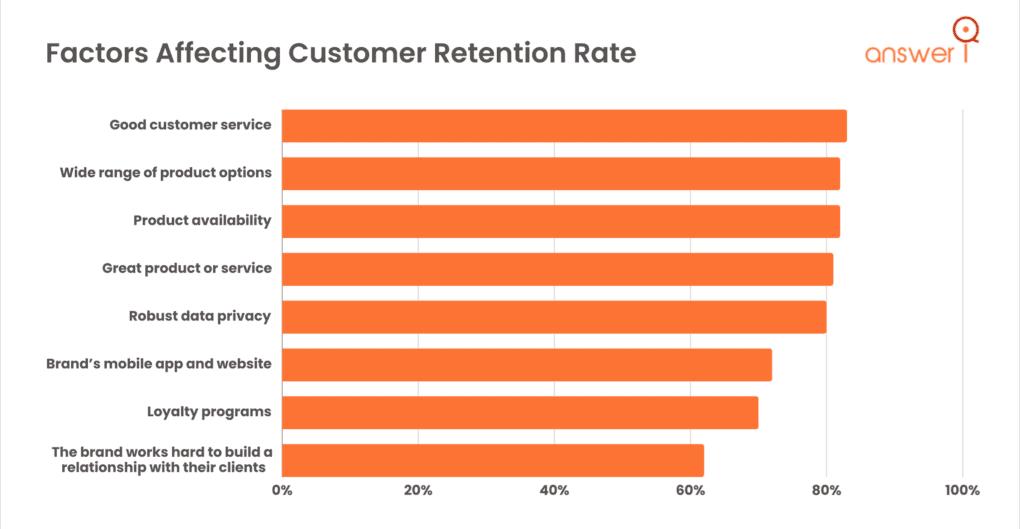
27. 74% of customers say product quality is the main reason they stay loyal, followed by good value for money.
28. It takes at least five purchases for 37% of buyers to consider themselves loyal to a brand.
29. One in four customers is willing to pay up to 10% more for excellent customer service in nearly every industry.
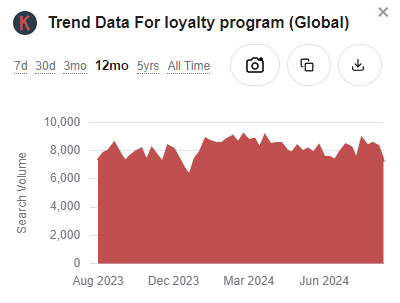
30. According to Keywords Everywhere, the trend data for loyalty programs has stayed steady over the past year, showing that companies are always looking for ways to turn customers into loyal customers.
Customer Churn Rate Statistics
Customer Churn Rate (CCR) is the opposite of customer retention rate. It shows the percentage of customers who stop using a product or service over a certain period.
A high churn rate means customers are unhappy and moving on to other options.
Here are some key stats about customer churn rate that you should be aware of:
31. Customers spend 20-40% more with companies that quickly address their requests on social media. Companies that ignore social media face a 15% higher churn rate compared to those that respond promptly.
32. Three main issues cause 53% of customer churn: Poor onboarding leads to 23% of churn, weak relationship-building causes 16%, and poor customer service accounts for 14%.
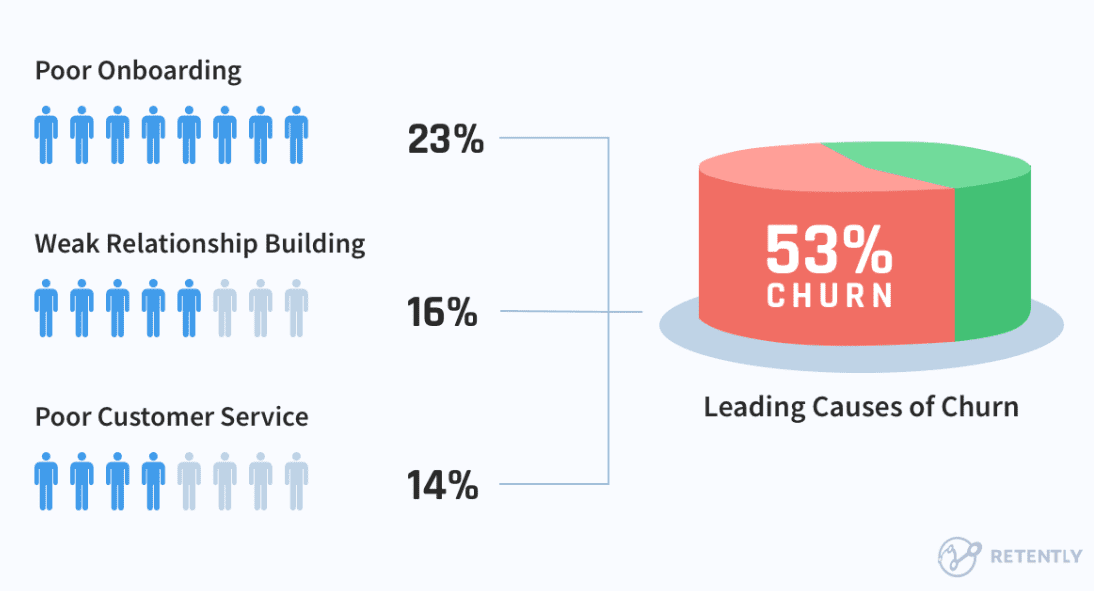
Source
33. A Microsoft study found that 96% of people believe customer service is crucial for their loyalty to a brand, and 56% have left a business because of bad customer service.
34. U.S. businesses lose $136 billion a year due to avoidable customer churn.
35. Zendesk reports that 66% of consumers have stopped doing business with a company because of poor customer service.
36. Companies can cut churn by 67% if they resolve customer problems during the first interaction and manage customer expectations effectively.
37. According to PWC, 32% of people will stop doing business with a company after just one negative experience, even if the company had previously provided great service.
Source
38. Nearly 48% of consumers have left a company’s website and bought elsewhere due to a poor experience, according to Accenture.
39. After a negative experience, 58% of customers won’t return to that company, making retargeting efforts ineffective if the user experience isn’t improved.
40. Only 1 in 26 unhappy buyers will complain, while the rest will churn without giving any feedback.
Customer Service Statistics
One of the key things that can affect whether customers stick with your business is how you handle customer service.
Check out the customer retention stats below to see why creating a positive experience is so crucial:
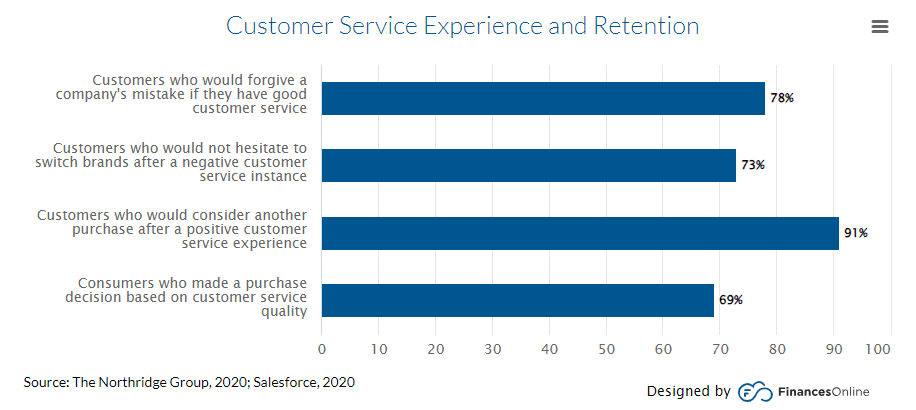
41. 83% of U.S. consumers say that good customer service is crucial for them to stay loyal to a brand.
42. Over 60% of customers believe that solving their issues quickly is one of the most important parts of good customer service. More than 40% also value having 24/7 support.
43. In a 2020 survey on customer loyalty, 94% of people said they’d stick with a company that offers excellent customer service. For companies that provide good service, 82% would recommend them to others, leading to an overall 88% recommendation rate for positive experiences.
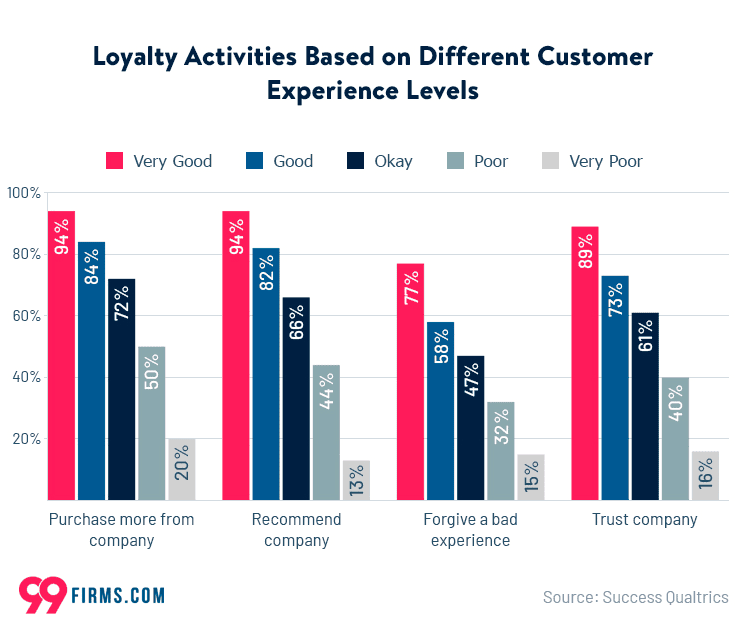
Source
44. About 44% of customers want businesses to ensure that their customer service teams can effectively and efficiently solve their problems.
45. A study by Cogito found that 74% of consumers think unhappy employees negatively impact the customer experience. 65% blamed slow response times, and 62% pointed to frustrated or low-energy employees as key issues.
46. Great customer service boosts the chances of customers buying again by 82% and increases word-of-mouth recommendations by 97% if the service is personalized and attentive.
47. Customer expectations are rising, with 32% wanting more responsive and empathetic service, especially Gen Z shoppers.
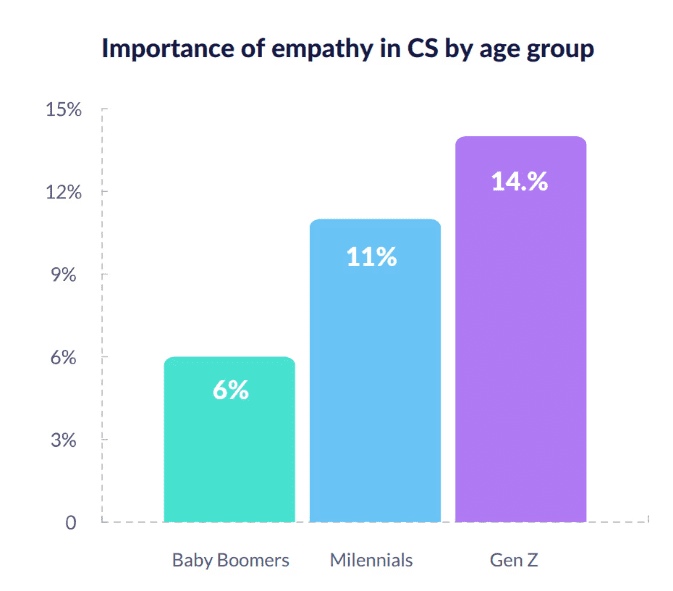
Source
48. Making returns difficult can drive away 84% of your customers.
49. Sometimes, a simple apology goes a long way—96% of customers say they’d continue buying from a company that apologizes when they make a mistake.
50. 75% of customers say quick responses are the most important part of a good customer experience, followed by consistent service across different channels (55%).
Customer Retention Behavior Statistics
Getting a grasp on customer behavior can reveal what really matters to people when deciding whether to stay with a company or move on to another.
The customer retention stats below highlights the top reasons why customers stay loyal or choose to leave:
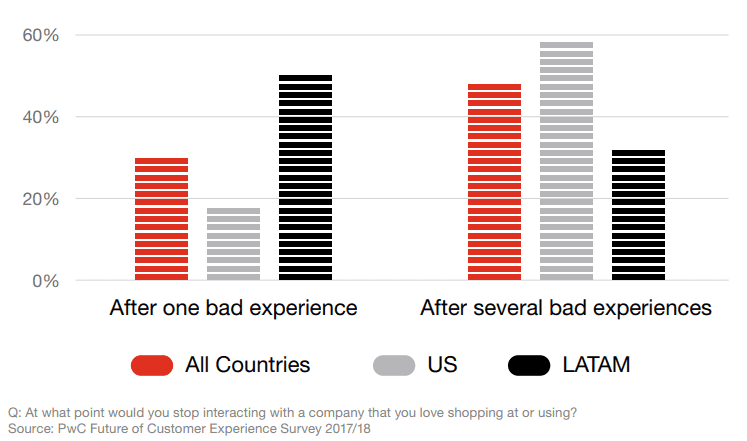
51. Shoppers can be tough to please. While 81% say they’d buy again after a great shopping experience, 61% would jump to a competitor after just one bad experience.
52. 33% of Americans would switch to another brand after just one poor customer service experience.
53. 73% of people wouldn’t think twice about switching brands after a negative experience with customer service.
Source
54. 74% of customers will likely move to another brand if the buying process feels too complicated.
55. 31% of consumers have switched brands just because the company wasn’t honest about how its product performs.
56. 62% of shoppers won’t buy from a store if it doesn’t offer free returns. And 84% won’t shop there again after a bad return experience.
57. 83% of U.S. consumers say good customer service is a top reason they stay loyal to a brand.
Source
58. Nearly 74% of customers are likely to switch brands after a poor call center experience.
59. 39% of customers admit they won’t spend their money on a business that doesn’t provide a personalized experience.
Average Customer Retention Rates by Industry
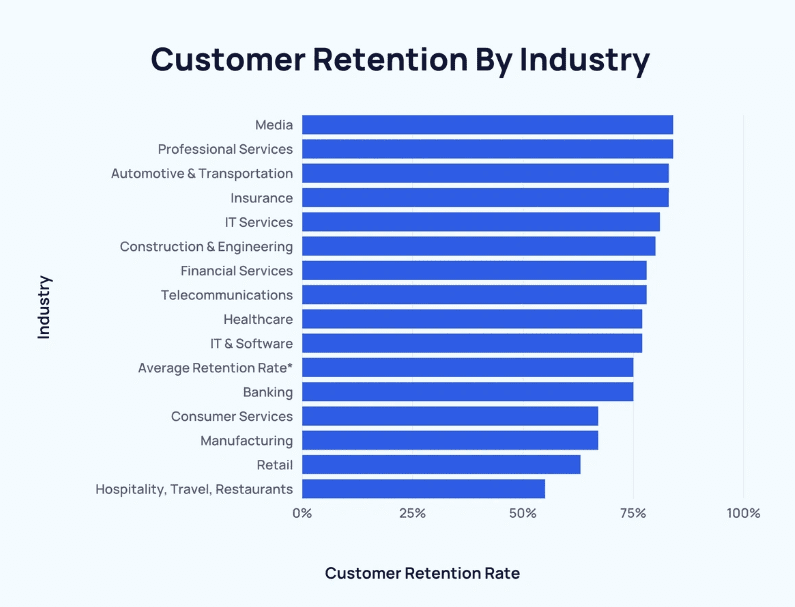
Customer retention rates can vary a lot between industries. What’s considered high in one field might be seen as low in another. Here are the latest customer retention rates for different industries:
60. In many industries, the top five companies keep about 94% of their customers.
Source
61. For insurance companies, the average customer retention rate is 84%. This 10% gap compared to the top companies shows a big loss in potential revenue.
62. The retail industry has a customer retention rate of 63%. As people return to their pre-pandemic shopping habits, retail is expected to be one of the fastest-growing sectors.
63. Banking has a high customer retention rate of 75%, mainly because people see their bank accounts as investments.
64. For SaaS companies, keeping around 35% of customers is considered good, according to a Mixpanel report.
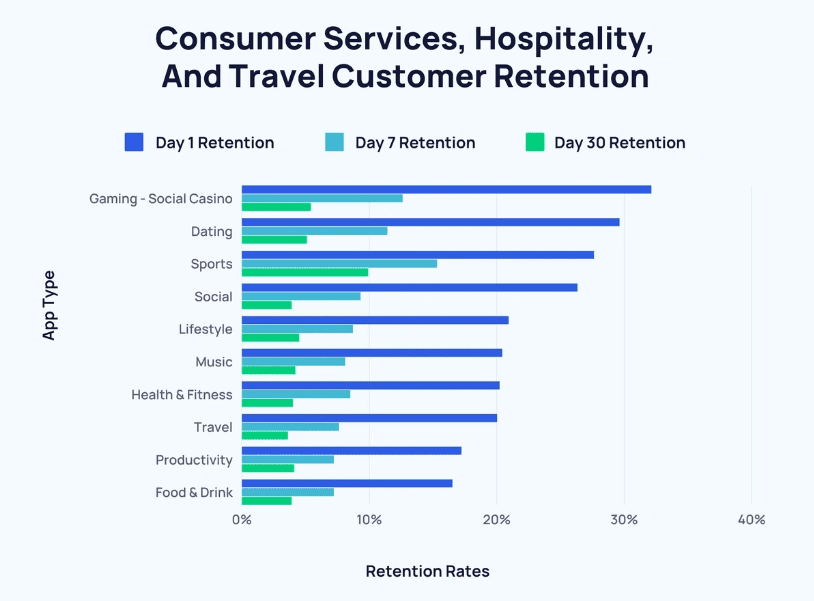
65. Hospitality had one of the lowest customer retention rates at 55% even before the pandemic. Today, loyalty points and discounts aren’t as effective in bringing back customers due to safety concerns and changing expectations.
Source
66. In many sectors, the average customer retention rate after two months is less than 20%, but for media companies, it’s over 25%. This is because media companies focus on attracting large audiences.
67. Fintech apps have a retention rate slightly below average at 37%. However, 73% of new users leave within the first week.
68. Education apps had the worst annual retention rate at just 4%. This was partly due to challenges like adjusting to remote learning and technical issues beyond the companies’ control.
Online Channel Use for Customer Retention
The last key to boosting customer retention is knowing the best ways to go about it—especially which channels to use. The stats below highlight the most important channels to focus on:
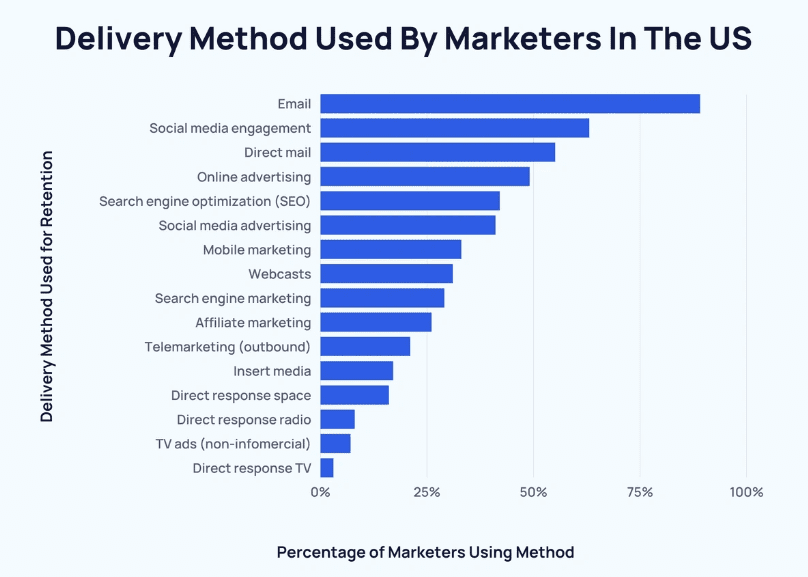
69. A 2015 survey in the U.S. found that email is the top choice for customer retention, used by 89% of businesses. Social media engagement (63%) and direct mail (55%) are the next most popular methods.
70. TV ads (not infomercials) and direct response TV are the least used, with just 7% and 3% of marketers opting for them.
Source
71. Over 52% of customers prefer calling brands when they need to reach out, while only 0.3% choose to write a letter.
72. Customers spend about 20% to 40% more with brands that answer their customer service needs on social media.
73. 50% of customers choose a customer service channel based on how fast they want a reply.
74. Price is important—78% of customers look for a fair price when deciding where to buy.
75. 53% of consumers say discounts and loyalty points encourage them to stick with a brand longer.
76. Most brands rely on mobile apps and email marketing for customer retention, with 44% and 52% of businesses using these methods, respectively.
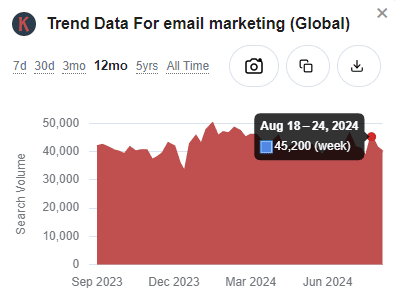
77. Supporting this, data from the Keywords Everywhere widget shows that interest in email marketing has stayed high and steady over the past year, indicating that more brands are turning to this channel to keep customers coming back.
Conclusion
These customer retention stats reveal a clear trend: The old approach of just getting new customers and then ignoring them is outdated.
Today, keeping your current customers happy is crucial. It’s cheaper to make existing customers happy than to find new ones. Plus, loyal customers tend to buy more often, spend more per purchase, and refer others to your business.
While it’s still important to attract new customers, putting some focus on great customer service and support will boost your customer retention rates and give you a better return on investment in the long run.