Online shopping has really taken off in recent years and shows no signs of slowing down.
With the internet and digital tools making it easy for businesses to sell without a physical store, the growth is expected to continue.
Shoppers love the convenience, wider product choices, and competitive pricing online shopping offers.
If you’re looking to start an online business or already have one, these stats will help you better understand the trends shaping the fast-moving world of eCommerce.
Let’s jump straight to the key online shopping stats you need to know for 2025 and beyond!


Online Shopping Stats: General
Let’s kick things off with some general online shopping stats that show how much the eCommerce world has grown and where it’s headed.
1. We’ll dive into how many people are shopping online, the rise in online stores, and which product categories are the most popular among shoppers.
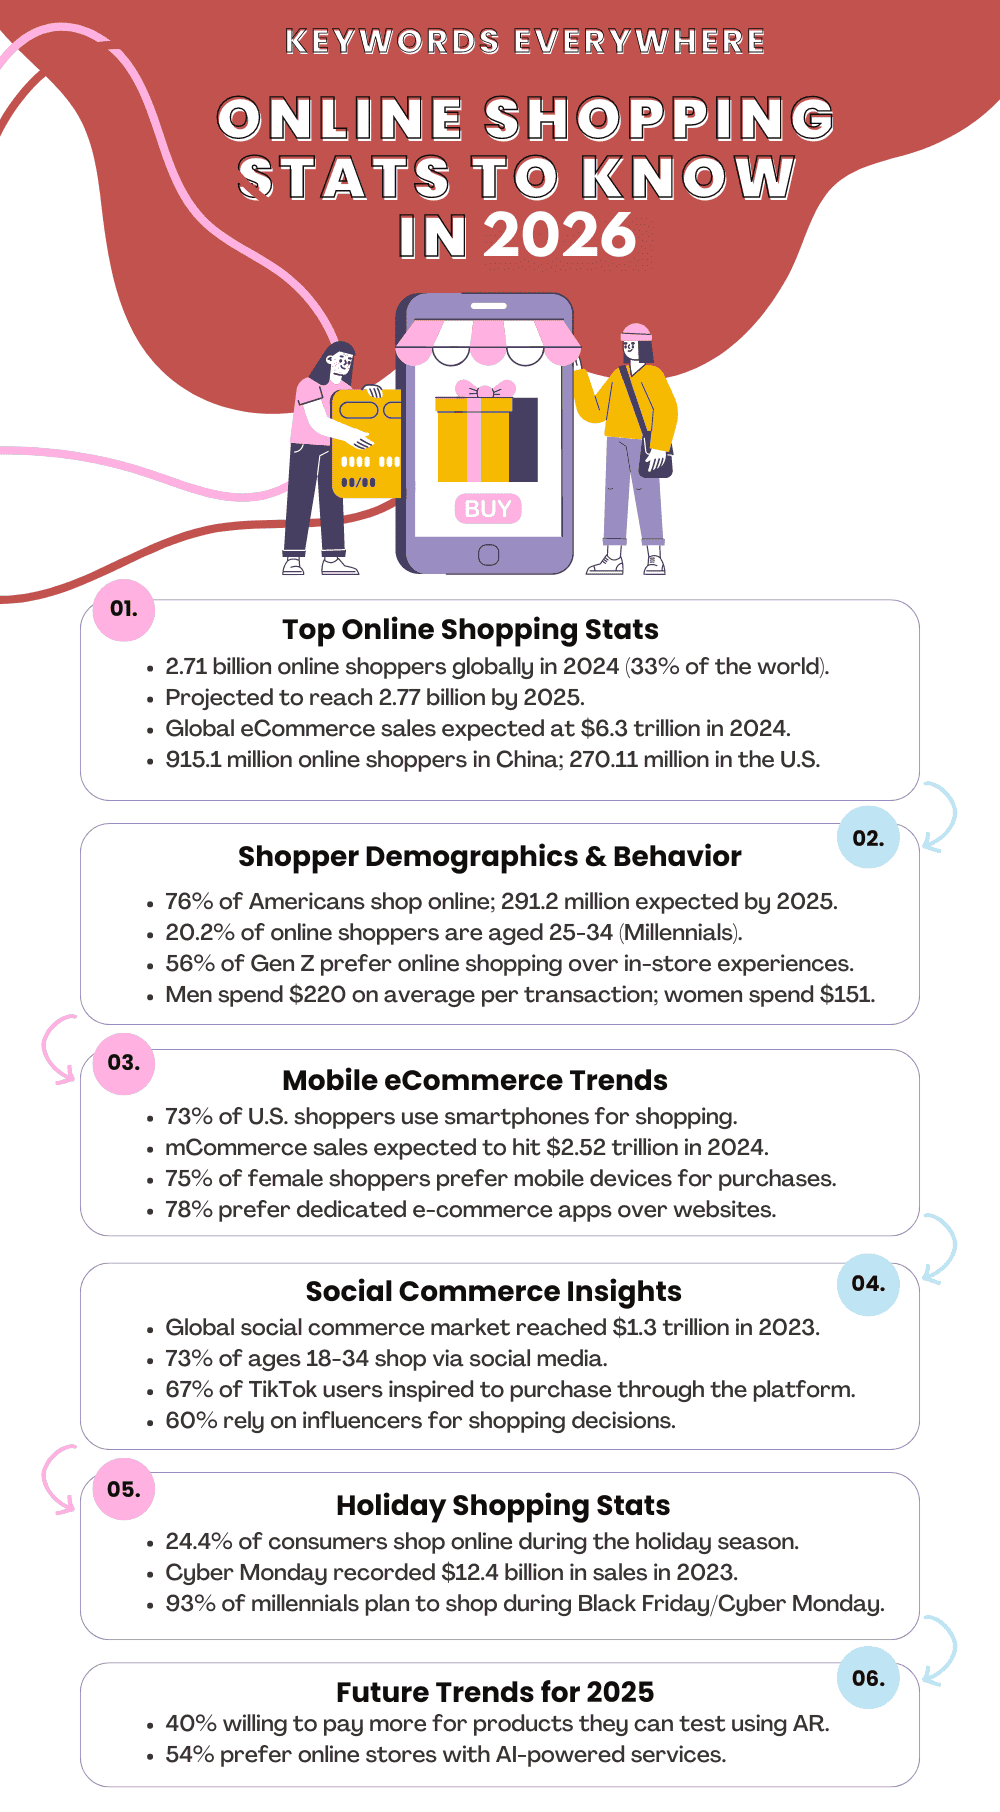
2. As of 2024, there are 2.71 billion online shoppers worldwide, which means about 33% of the global population shops online. This is up 2.7% from last year.
3. By 2025, the same number of shoppers is expected to rise to 2.77 billion, driven by the rise of internet access and the convenience of online shopping.
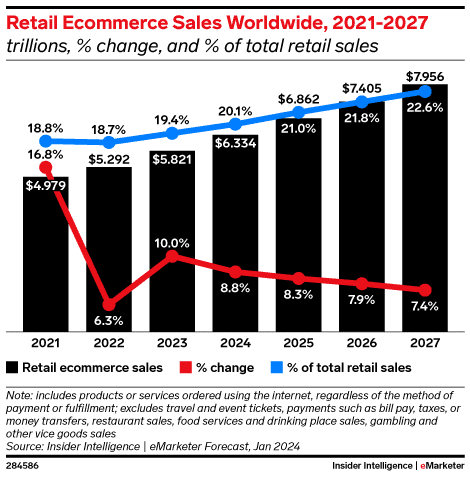
4. Global eCommerce sales are projected to strike $6.3 trillion in 2024, an 8.76% jump from 2023. This trend will continue, with a 7.8% annual growth rate pushing sales to $8 trillion by 2027.
Source
5. China leads the way with 915.1 million online shoppers, while the US follows with 270.11 million in 2024.
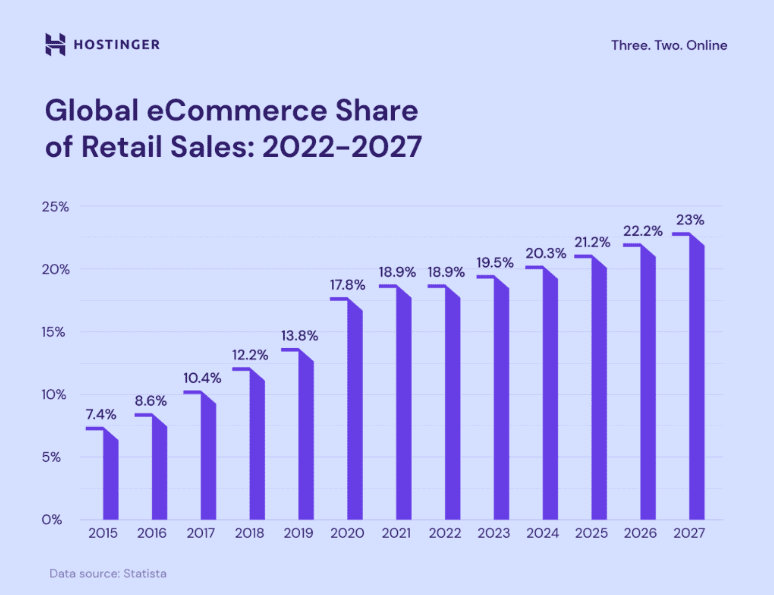
6. By 2027, 22.6% of all retail purchases will be made online, with online retail growing by about 0.32% each year since 2021.
7. In the US, eCommerce sales reached $291.6 billion in the second quarter of 2024, a 0.82% increase from the previous quarter and a 6.8% rise compared to the same time last year. This puts the country’s total online sales at $579.45 billion for the first half of 2024. Experts believe the sales will hit $1.26 trillion by the end of the year and climb to $1.72 trillion by 2027.
8. There are 26.6 million eCommerce websites worldwide in 2024, a 3.83% rise from last year, with 2,685 new sites launching daily. The majority of these online stores are powered by Shopify (28%) and Wix (19%).
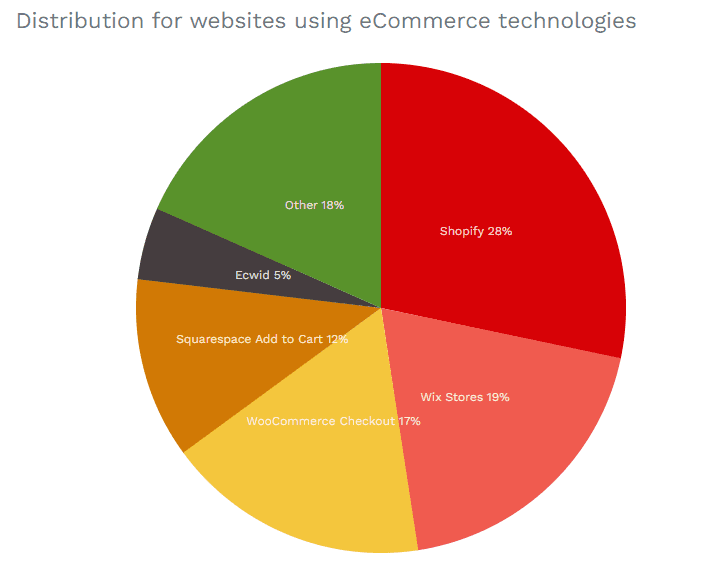
Source
9. When it comes to online shopping habits, 44% of people start their shopping journey on search engines, 41% go directly to stores like Amazon or a business’s website, and 14% prefer to browse on social media.
10. Interestingly, men are more likely to shop online, with 84.3% of men making purchases compared to 77% of women. The average online shopper is a man between 25 and 49 years old.
11. The top items people buy online are clothing and footwear, books, and electronics. In 2024, consumer electronics are expected to bring in $922.5 billion in sales, with fashion close behind at $760 billion, and the food and beverage sector raking in $708.8 billion.
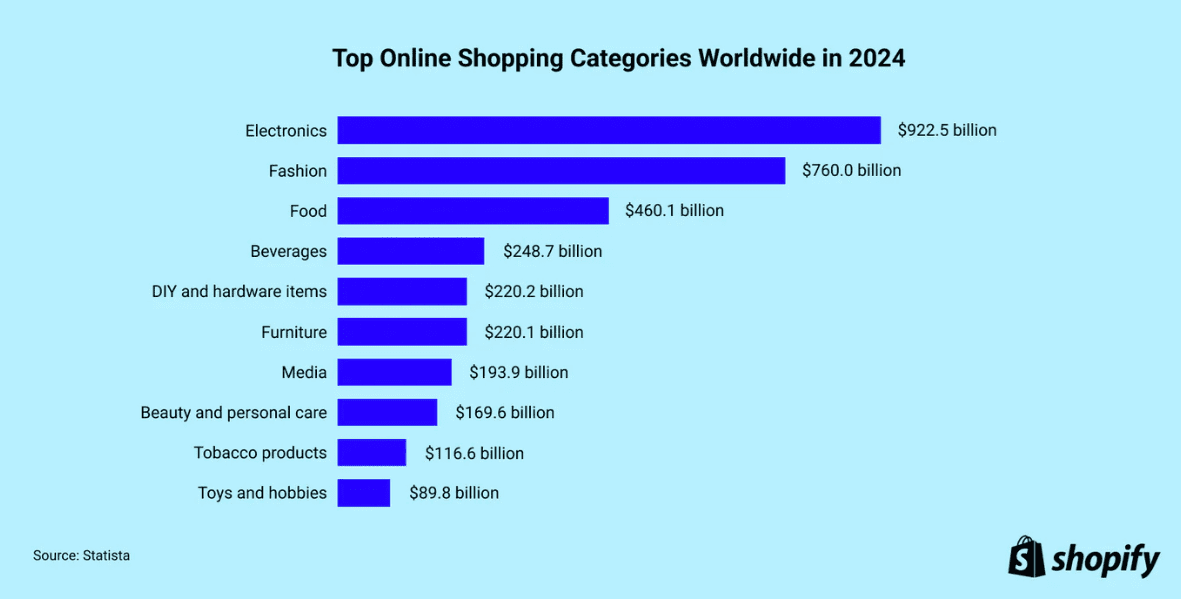
Source
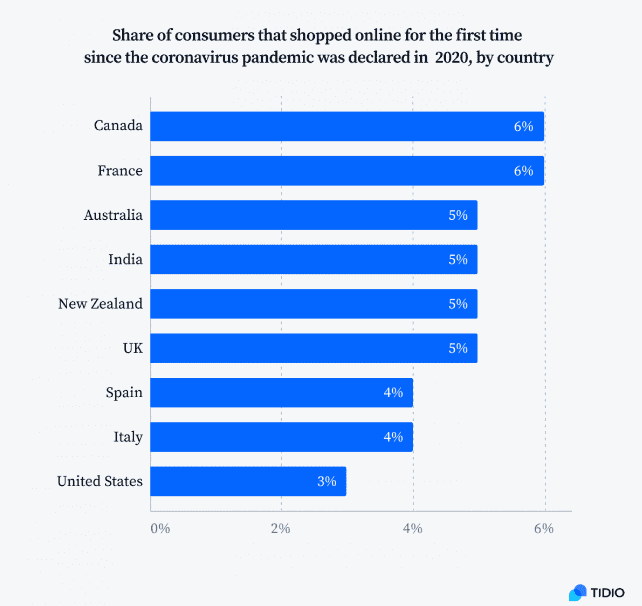
12. About 3% of Americans made their first online purchase because of COVID-19, and the interest in online grocery shopping surged from 36% before the pandemic to 55% during its early months.
Source
Online Shopping Stats: Demographics of Online Shoppers
Want to know who’s shopping online? Checking out some online shopper stats can give you a good sense of who’s buying what. Here’s a look at how different groups of people shop online:
13. 76% of Americans shop online, and this number is expected to grow to 291.2 million online shoppers in the U.S. by 2025.
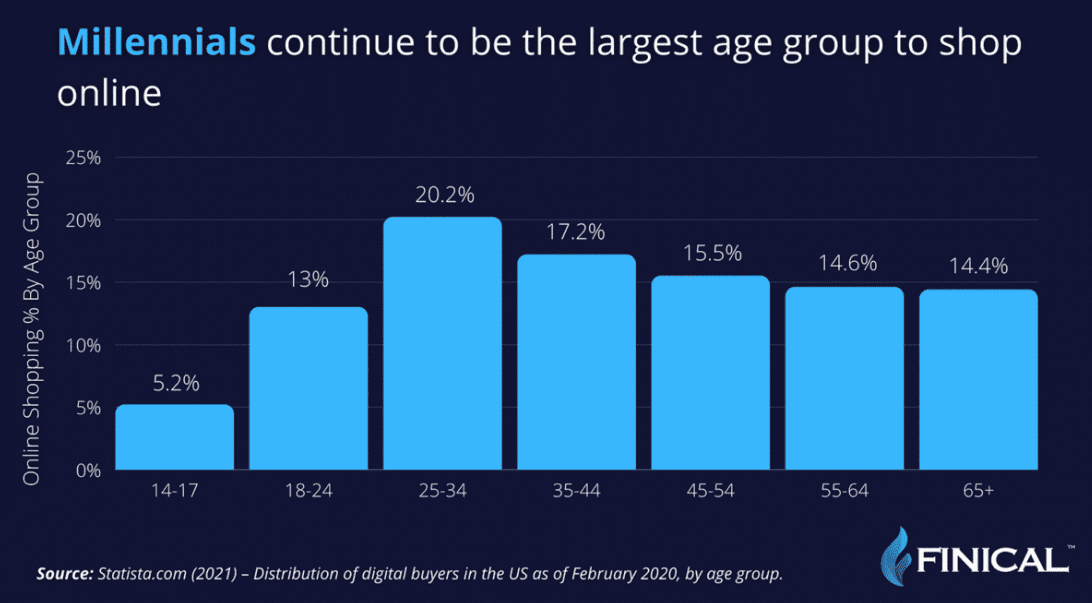
14. Millennials are the biggest age group for online shopping. About 20.2% of online shoppers are aged 25 to 34, and 17.2% are between 35 and 44.
15. More than 35% of Millennials say social media greatly influences their buying decisions. This digital marketing channel works best for people aged 26 to 42.
Source
16. 56% of Gen Z shoppers in the U.S. prefer the ease of online shopping over visiting stores.
17. Although Gen Z hasn’t reached their peak spending power yet, they have a significant impact, with their purchasing potential in the U.S. estimated at $450 billion.
18. 29% of Gen Z consumers are more likely to buy from companies with a strong social media presence.
19. About 45% of Gen Z shoppers compare prices across multiple online sites to find the best deals, while Gen X and Baby Boomers tend to stick to fewer stores.
20. According to a Hubspot report, most Gen X consumers prefer shopping in physical stores, but when they do shop online, 53% prefer big retailers like Amazon.
Source
21. 25% of Gen X shoppers like to buy directly from a company’s website, while only 13% purchase through social media apps.
22. Over 60% of Baby Boomers have shopped online, and 47% have been spending more online since COVID-19. In recent years, about 90% of Boomers have turned to online shopping for convenience.
23. When it comes to gender differences, 71% of women buy fashion and clothing online compared to 49% of men, while 49% of men are more interested in technology products versus 31% of women.
24. Even though men shop online less often, they spend an average of $220 per transaction, while women only spend about $151 per transaction.
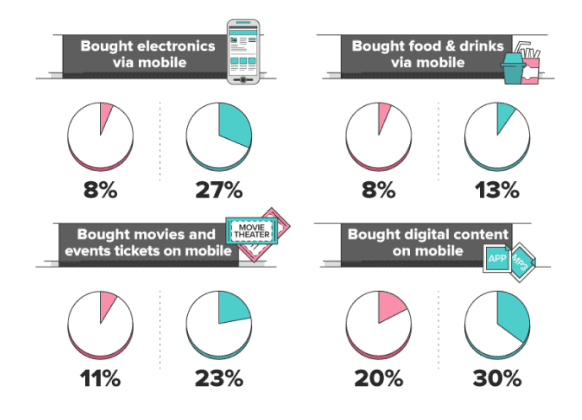
25. A study by Ecommerce Platforms looked at mobile shopping habits by gender across various product categories:
- Electronics bought on smartphones: Women 8% / Men 27%
- Food and drink purchased on smartphones: Women 8% / Men 13%
- Movie and event tickets bought on smartphones: Women 11% / Men 23%
- Digital content purchased on smartphones: Women 20% / Men 30%
Source
Online Shopping Stats: Consumer Behavior
Getting to know your customers’ shopping habits can help you improve your online store’s user experience, leading to more sales and loyal customers. This understanding is key for any eCommerce strategy, no matter what you sell.
Here are some important online shopping stats that show how consumers behave:
26. 62% of customers buy online once a week, while 29% do it 2-3 times a week. This trend is similar for both men and women. Among those who shop online once a week, 66% come from households earning less than $75,000 a year.
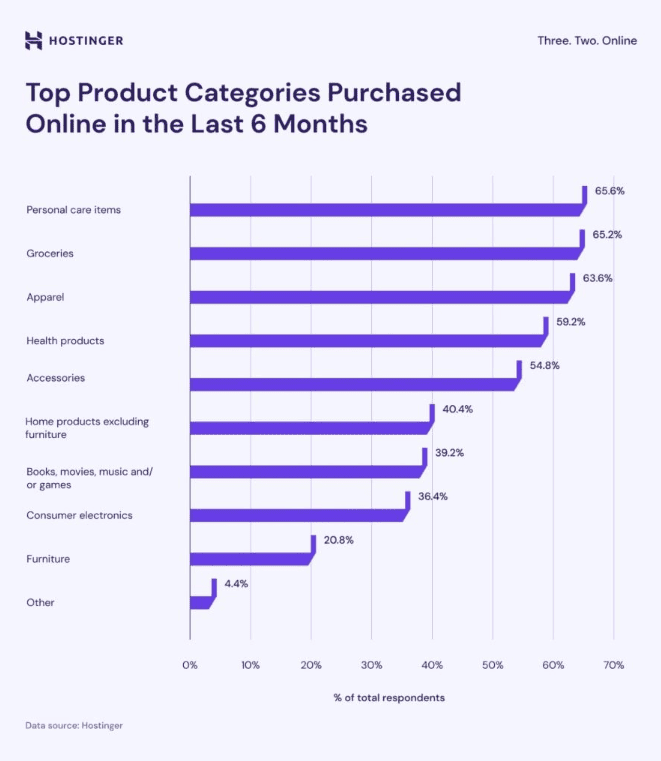
27. Personal care items like makeup, skincare, and hair products are the most popular online purchases, with 65.6% of customers buying them in the last six months. Groceries and apparel follow closely behind at 65.2% and 63.6%, respectively.
28. 59.2% of customers bought health products, like vitamins and supplements. 54.8% spent on accessories, such as shoes and bags, while 40.4% purchased home goods.
Source
29. Nine out of ten consumers see online reviews when deciding what to buy. About 54.7% read at least four reviews before making a purchase, and 44% read up to three reviews.
30. 59% of online shoppers use Google to find reviews, followed by 57% who use Amazon. Even when shopping in stores, 72% of consumers check online reviews on their mobile devices.
31. 52% of online shoppers have bought from international sites, mainly because of the ease of shipping and convenience.
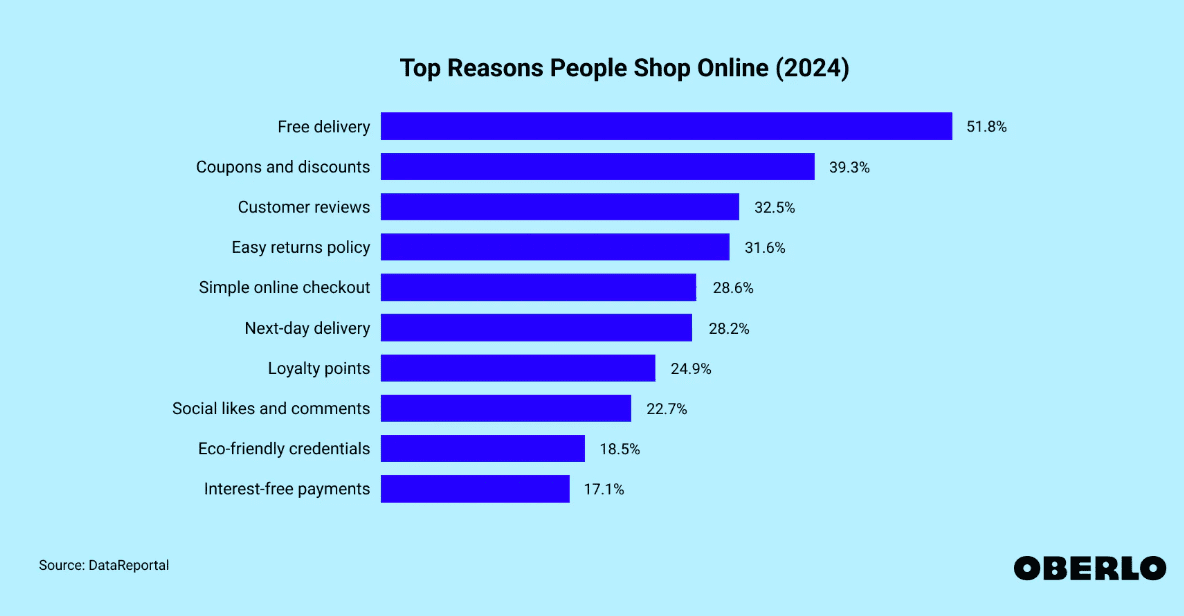
32. 50.6% of people shop online for free shipping. Coupons and discounts are the second biggest reason at 39.3%, and 33.2% appreciate the ease of returning items.
Source
33. About 70% of shopping carts are abandoned without a purchase, often due to extra costs like shipping fees or taxes.
34. The average checkout process on eCommerce sites has 5.08 steps, contributing to a 22% cart abandonment rate. It’s best to streamline this to just 3 steps to keep customers focused on shopping rather than filling out forms.
35. 40% of online shoppers in the U.S. have tried live commerce. This number is higher in Asian and Latin American countries but lower in Europe.
36. Over 60% of online shoppers prefer mobile-friendly sites. Plus, 84% said they’d install a mobile app if it offered better deals.
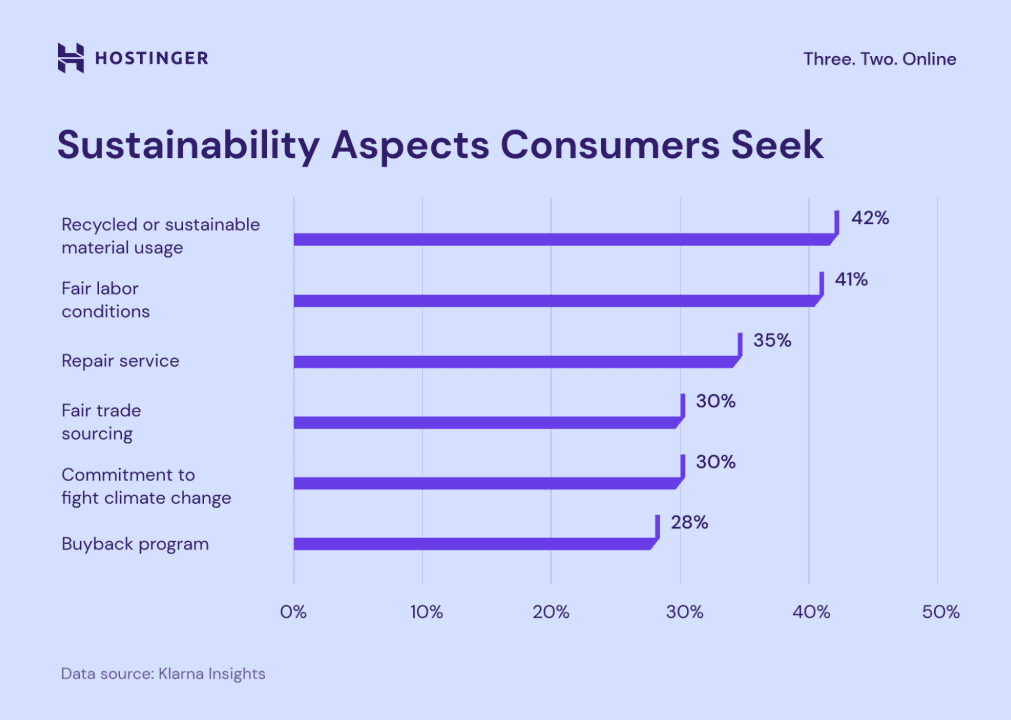
37. 42% of consumers consider sustainable materials the most important aspect of sustainability, followed by 41% who value fair labor conditions and 35% who look for repair services. This is especially true in the clothing sector, where 50% of online shoppers seek sustainable options.
Source
38. 24/7 availability, convenience, and discounts make online shopping the top choice for 56.6% of consumers. However, 44.4% still prefer to shop in-store for the experience of seeing and testing products.
Online Shopping Stats: Mobile Ecommerce
Mobile online shopping, or mobile commerce (m-commerce), is simply all about buying and selling products and services using mobile devices like phones and tablets.
It’s become super popular because it’s so convenient and easy to use.
Let’s dive into more insights about mobile commerce in this section of online shopping stats.
39. Smartphones are the top choice for online shopping worldwide. In the U.S., 73% of people use their smartphones to shop. In China, that number jumps to an impressive 92%, while in India, it’s 88%.
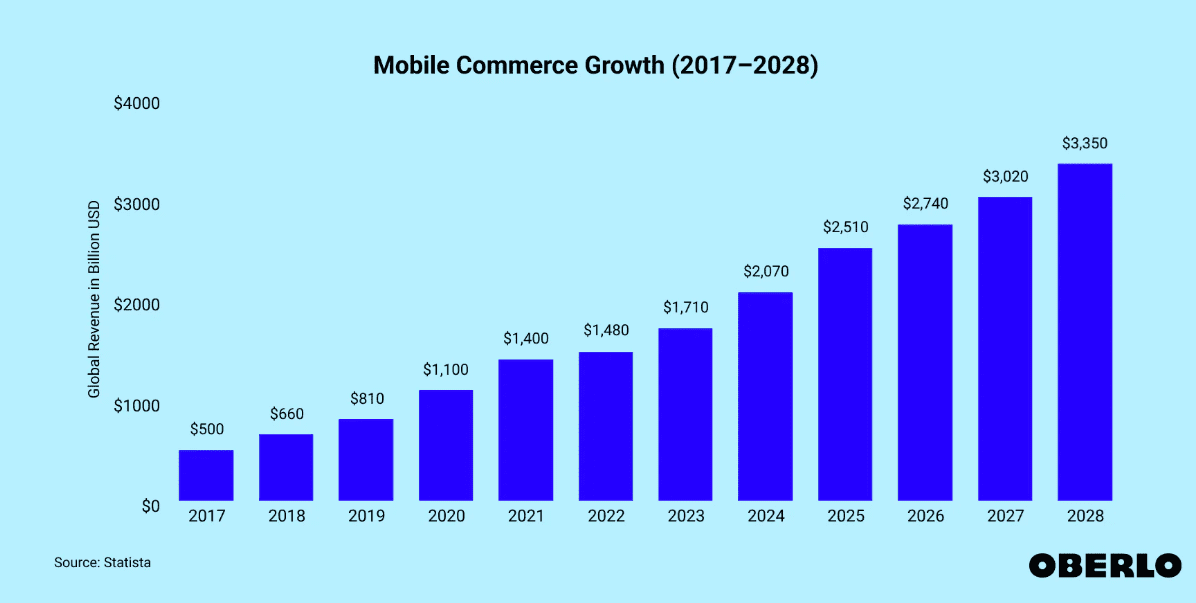
40. mCommerce sales are expected to reach $2.52 trillion in 2024, marking a 16.6% increase from last year’s sales of $2.16 trillion. Mobile commerce is growing even faster than the average annual growth rate of 15.3% predicted from 2018 to 2027.
Source
41. Tablets have the highest conversion rate on eCommerce sites at 3.1%, followed by desktops at 2.8%. Smartphones come in third with a conversion rate of 2.3%, which is very close to the overall eCommerce rate of 2.5%.
42. 75% of female shoppers prefer using mobile devices for purchases, compared to 63% of men. Men are more likely to shop on their computers, with 29% choosing that option compared to 18% of women.
43. In 2023, voice commerce saw a boost of $19.4 billion, showing a 400% growth in just two years. Experts expect this industry to grow by 54.63% this year, exceeding $30 billion.
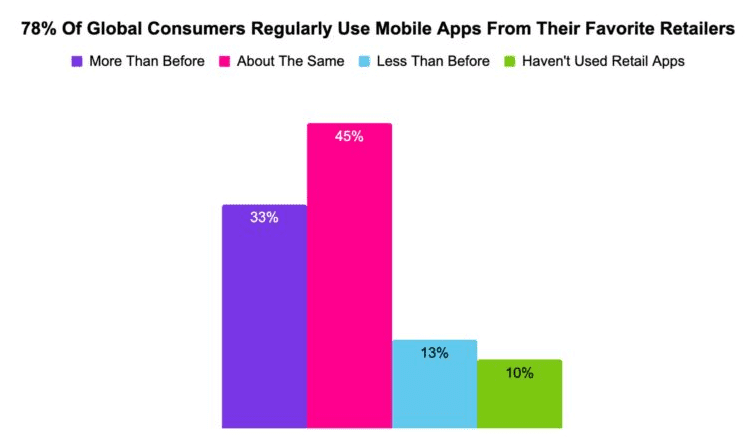
44. Nearly 78% of online buyers prefer using a dedicated eCommerce app for shopping instead of just visiting a mobile-friendly website.
Source
45. 67% of online buyers are more likely to shop from a mobile-friendly eCommerce site or app.
46. 61% of online buyers will leave a store if it’s not mobile-friendly, highlighting the importance of having mobile apps.
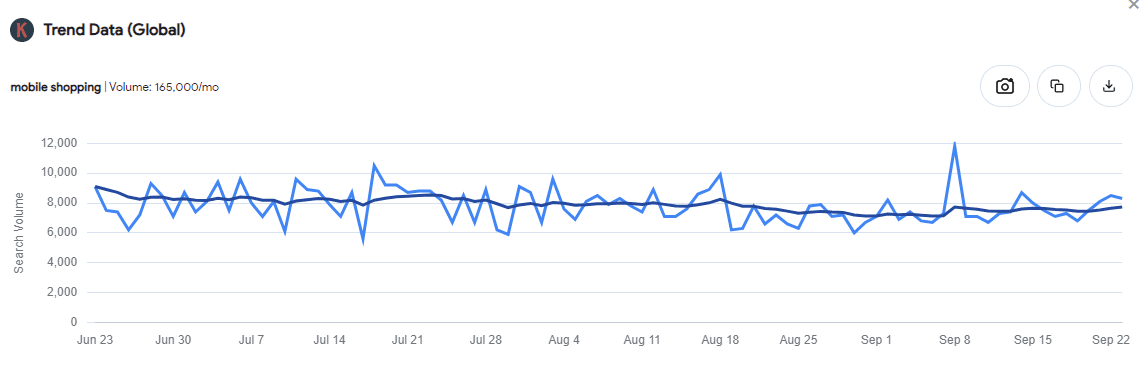
47. According to Keywords Everywhere, mobile shopping trends have remained strong over the past three months, with a high search volume of 165,000 searches per month.
Online Shopping Stats: Social Commerce
With 5 billion social media users around the world, these platforms are perfect for eCommerce. The Facebook Marketplace has been around for a while and generates a lot of sales.
Newer options like TikTok Shop are also seeing impressive transaction numbers. This shift shows that more people are turning to social media for their shopping needs!
Let’s take a closer look at social commerce in this section of online shopping stats.
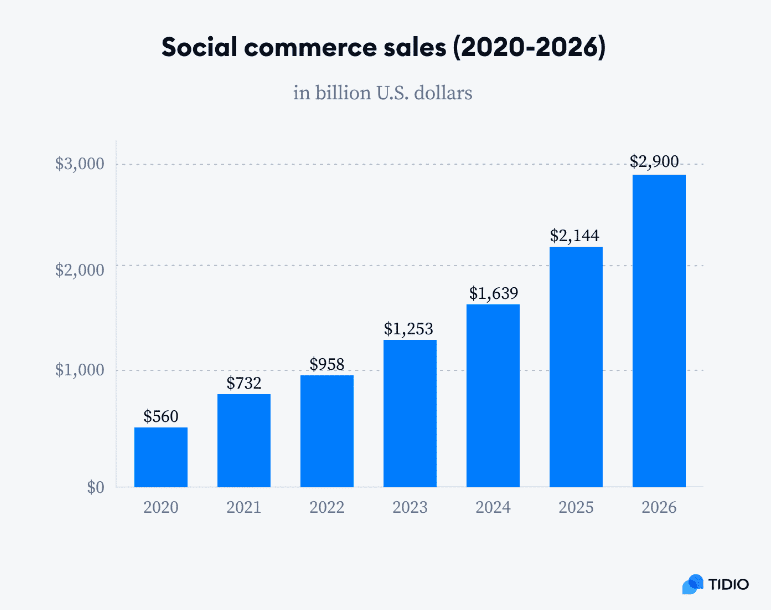
48. The global social commerce market reached $1.3 trillion in 2023. With a 30.7% annual growth rate, it’s expected to grow seven times larger in the next seven years.
Source
49. According to Statista, the social commerce sector is projected to grow at a 29% annual rate from 2022 to 2030, aiming for $8.5 trillion by the end of this period.
50. In 2023, the U.S. social commerce gross merchandise value (GMV) was around $64.8 billion. With an 18.2% growth rate, it could nearly double to almost $150 billion in just five years.
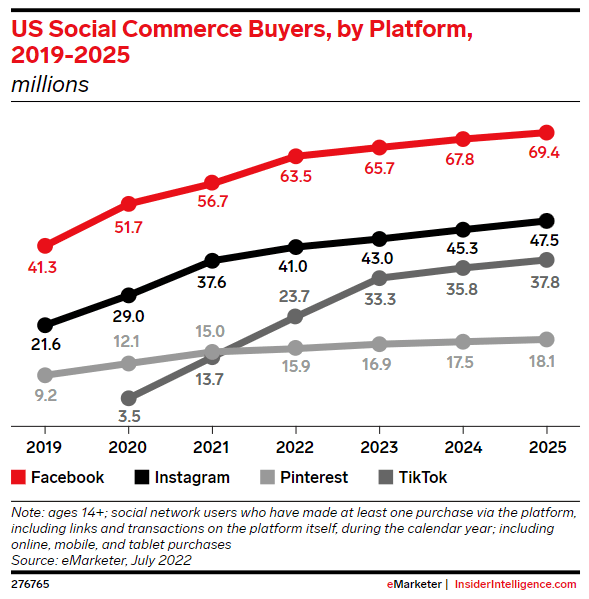
51. By 2024, 67.8 million people in the U.S. are expected to shop on Facebook, making it the most famous platform for social commerce. That’s 20% of the country’s population!
52. Instagram is also popular, with 45.3 million shoppers, while TikTok is close behind with 35.8 million expected shoppers.
53. Pinterest is emerging as a strong player, with 17.5 million people expected to shop there this year.
Source
54. People in the group of 18 to 34 are the most likely to shop through social media, with about 73% reporting they’ve made a purchase this way. In contrast, only about 25% of those aged 65 and older have shopped on social media.
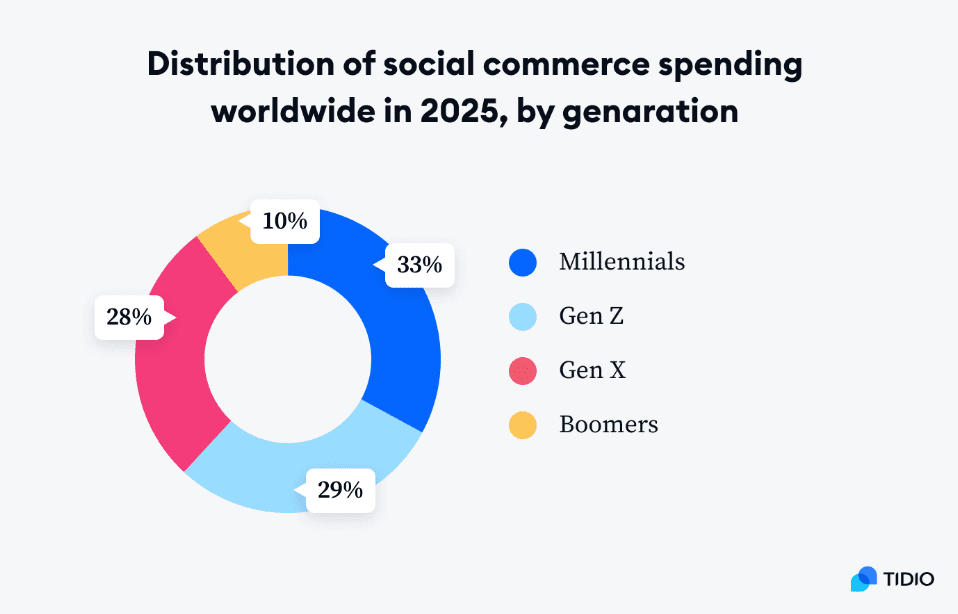
55. Predictions by Accenture suggest that by 2025, a third of global social media shopping spending will come from millennials, with Gen Z at 29% and Gen X at 28%.
Source
56. While consumer electronics are popular on eCommerce sites, the trend shifts to self-care products on social media. 20% of people said they purchased personal care items eight or more times in the past year.
57. Over 60% of online shoppers rely on influencers and their recommendations when deciding what to buy.
58. Shoppers on Pinterest spend, on average, 80% more than those on other platforms.
59. 80% of shoppers watched a YouTube video related to their planned purchase before buying.
60. 67% of TikTok users say the platform inspires them to make purchases, and 65% enjoy when creators showcase brands or products.
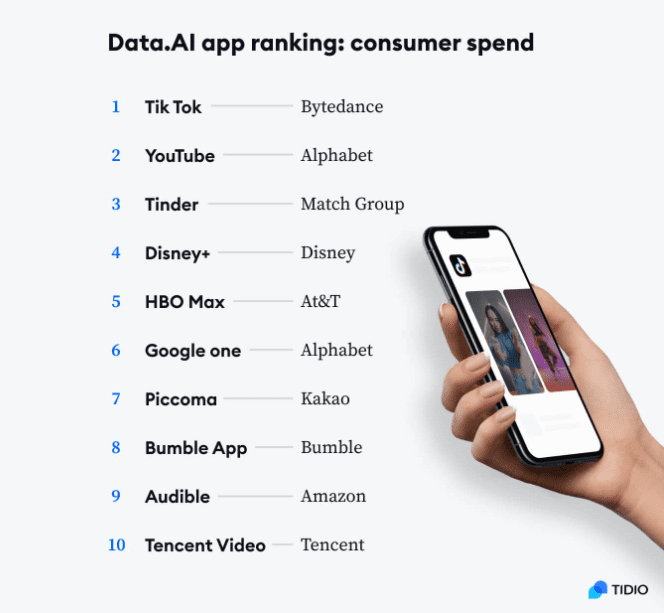
61. While TikTok may not have the most users, it is one of the most effective channels for social commerce, with global consumer spending on the platform exceeding $2.5 billion.
Source
Online Shopping Stats: Security and Fraud
Just like any other online activity, shopping online comes with security risks. While eCommerce businesses deal with major threats like payment fraud, shoppers are also worried about staying safe.
Here are some online shopping stats that show the security risks and common types of fraud in eCommerce:
62. 92% of American shoppers say security matters a lot when buying online. While 28% feel that online stores are being “overly cautious” about security, 83% are more likely to buy from a business they know has fraud protection in place.
63. 71% of people who spend between $260 and $520 online feel confident buying from overseas sellers. But only 37% of shoppers who spend $65 or less feel the same level of trust.
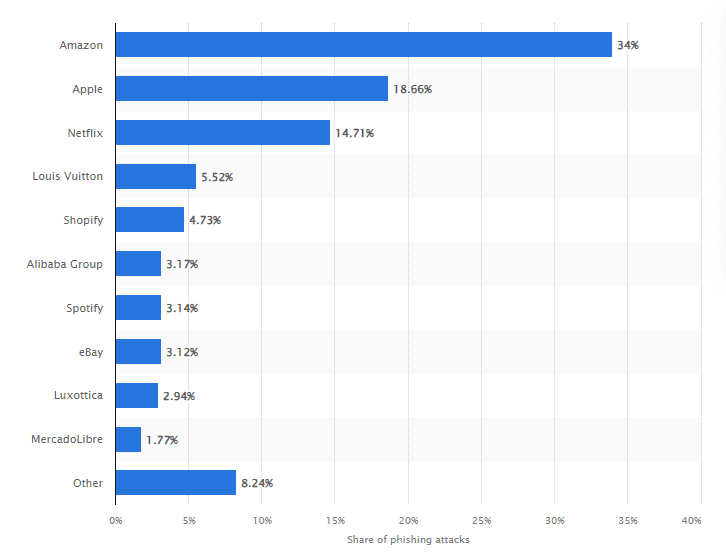
64. In 2021, nearly half (47.78%) of phishing attacks caught by Kaspersky Labs were pretending to be Apple. Another 21.48% pretended to be Amazon, 5.32% mimicked eBay, and 4.14% faked being Alibaba.
Source
65. The eCommerce industry may have lost around $48 billion in 2023 due to fraud. Globally, between 2023 and 2027, online payment fraud could cost over $343 billion.
66. Latin America has been hit the hardest by payment fraud, losing 4.2% of its revenue to scammers. In Europe, the loss is 3.1%, and in Asia-Pacific, it’s 2.9%.
67. Only 51% of brands are planning to use AI tools soon. Many hesitate because they worry about incorrect product suggestions (51%), misinformation (45%), and privacy concerns (40%).
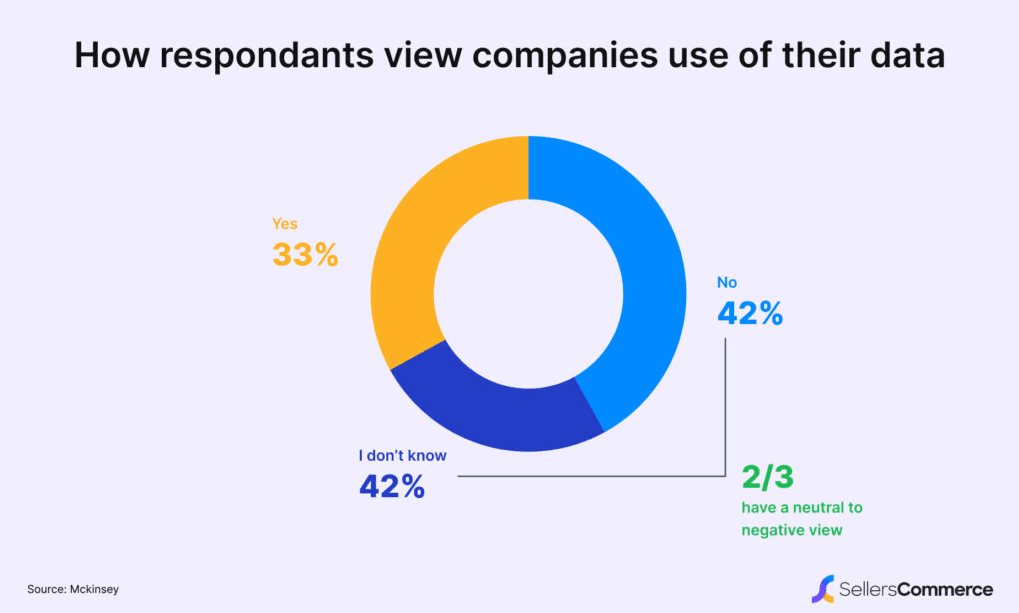
68. 33% of customers believe companies use their data responsibly. However, 42% think brands are taking advantage of their personal data, and 25% don’t have any opinion on the matter.
Source
Online Shopping Stats: Online Sales and Revenue
How much money does online shopping make? What portion of the population is involved in the eCommerce world?
These online shopping stats show the sales figures, revenue, and future trends of eCommerce:
69. In 2023, eCommerce made up 19.5% of total retail sales worldwide. Predictions say that by 2027, online sales will make up almost a quarter of global retail sales.
Source
70. Global eCommerce revenue is expected to go beyond $6.4 trillion by 2029, growing at an annual rate of 9.49% from 2024 to 2029.
71. By 2029, the average revenue per user in the eCommerce market is projected to reach $1,620, showing that online shoppers are spending more.
72. In the third quarter of 2023, U.S. retail eCommerce sales hit $271.7 billion. The U.S. eCommerce market is forecasted to grow by 11.2% from 2023 to 2027, while Europe will see a 9.3% increase, both higher than the global average growth rate of 0.7%.
73. Amazon dominates the U.S. eCommerce market with a 37.6% share, making it the largest player. Walmart comes in second with a 6.4% market share.
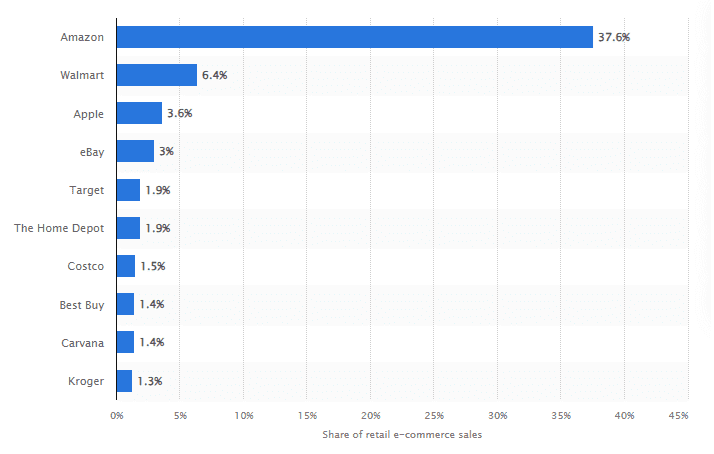
Source
74. Last year, top eCommerce companies spent $3.5 billion on advertising, with individual spending ranging from $41.3 million to $1.7 billion. Amazon led the way, spending $1.7 billion—over four times what Walmart spent.
75. Amazon is the most visited eCommerce website, averaging 2.84 billion monthly visits. The other two top websites are also American: Walmart and AliExpress, which saw the biggest growth in popularity with a 44% increase.
76. The subscription eCommerce market is expected to exceed $450 billion by 2025, a huge jump from just $15 billion in 2019.
77. Millennials lead the way in online delivery subscriptions, with 36% having at least one. The most popular subscription categories include groceries (41%), personal care products (38%), household items (34%), and clothing (32%).
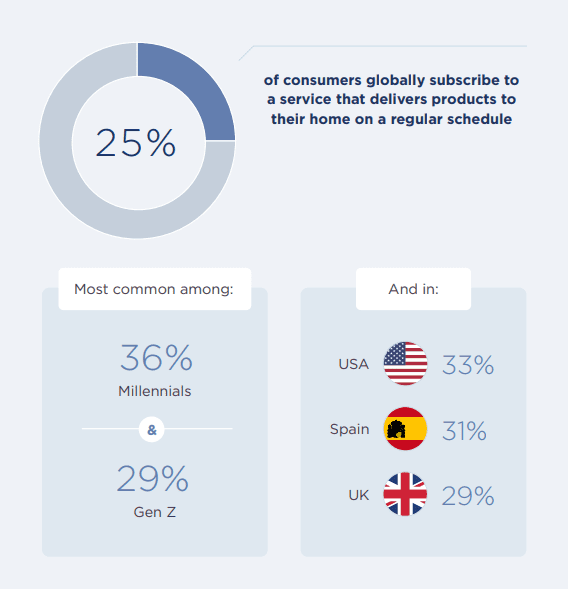
Source
78. Online shopping soared during the COVID-19 pandemic, with 61% of consumer spending happening online. Before the pandemic, it was only 45%.
79. Recommerce (consumer-to-consumer eCommerce) is all about buying and selling second-hand goods. This market is projected to reach $289.4 billion by 2027.
Online Shopping Stats: Black Friday and Cyber Monday
Festive decorations, family gatherings, baked goodies, and the hunt for the perfect gifts are what make the holidays so special. The holiday season also offers brands a fantastic chance to connect with shoppers and boost their online sales.
Check out these online shopping stats reveal the state of customers during holiday season:
80. The holiday season, especially Christmas, sees the highest online shopping activity, with 24.4% of consumers making purchases. Both men and women are nearly equally likely to shop online during this time.
81. The back-to-school (BTS) season is still a major sales event for retailers. In 2023, total BTS sales reached $41.5 billion, up from $36.9 billion in 2022, according to the National Retail Federation (NRF).
82. Online holiday spending grew slightly by 4.9% in 2023, reaching $222.1 billion compared to $211.7 billion last year. However, this growth still hasn’t matched the pre-pandemic levels of 2019.
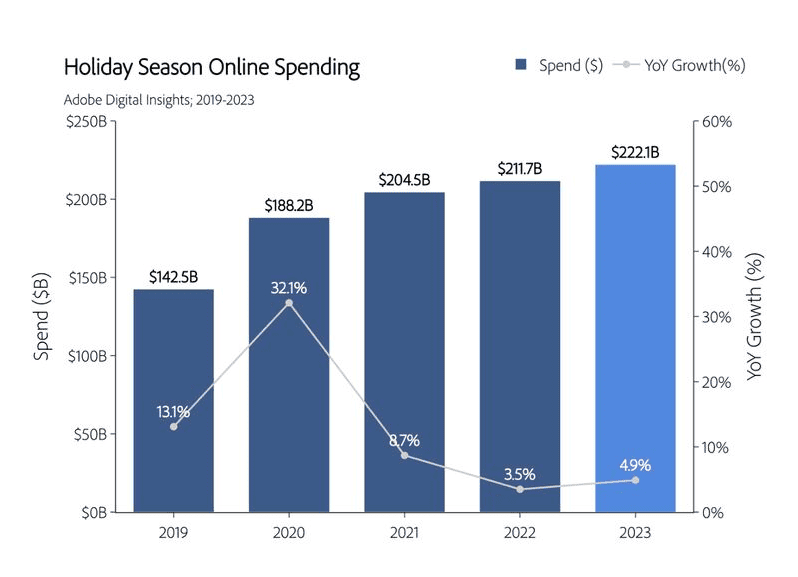
Source
83. Black Friday and Cyber Monday are the second most popular shopping events, with 20.4% of people participating. Interestingly, men (25%) are more likely to shop during these events than women (17%).
84. Cyber 5, the five days from Thanksgiving to Cyber Monday, stays the busiest shopping period of the season. It accounted for 17.1% of holiday revenue in 2023, bringing in $38 billion in sales, which is a 7.8% increase from last year.
Source
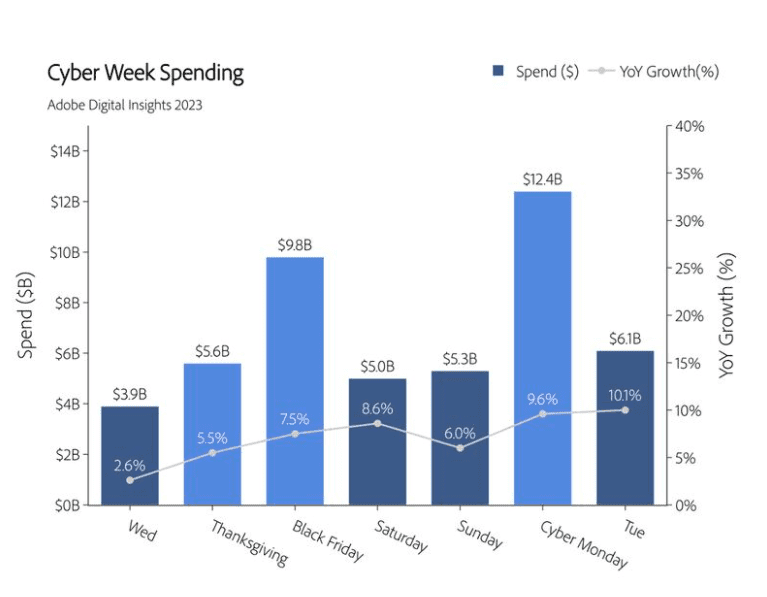
85. Cyber Monday was the top day for online sales during Cyber 5, making it the biggest online shopping day of the year so far, with $12.4 billion in sales.
86. TikTok launched TikTok Shop in 2023, achieving a record $61.2 million in sales during Black Friday week. YouTube also introduced an affiliate marketing program around the same time, allowing creators to promote products in their videos.
87. A huge 93% of millennials plan to buy products during Black Friday or Cyber Monday sales.
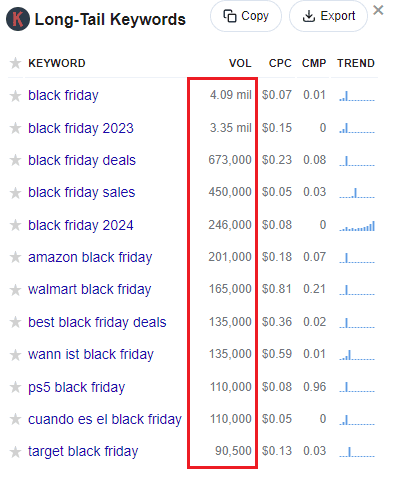
88. According to Keywords Everywhere, search terms related to Black Friday have a very high volume on Google, showing how eager consumers are to spend during the sale season.
89. In 2023, online shopping via mobile devices reached a record $113.5 billion, marking a 14.3% increase from 2022.
90. The Adobe Digital Insights report indicates that retailers offered double-digit discounts ranging from 10% to 30% to encourage more spending, with the biggest discounts on electronics, toys, computers, and clothing.
Online Shopping Stats: Challenges and Risks
eCommerce stores face a lot of challenges, and one of the biggest is cart abandonment. Many shoppers hesitate to complete their purchases due to trust issues and other concerns.
Below, we’ve shared some online shopping stats that show the key challenges that stop brands from boosting their sales:
91. Less than 2% of visits to eCommerce websites actually turn into purchases, and a whopping 80% of shopping carts are abandoned.
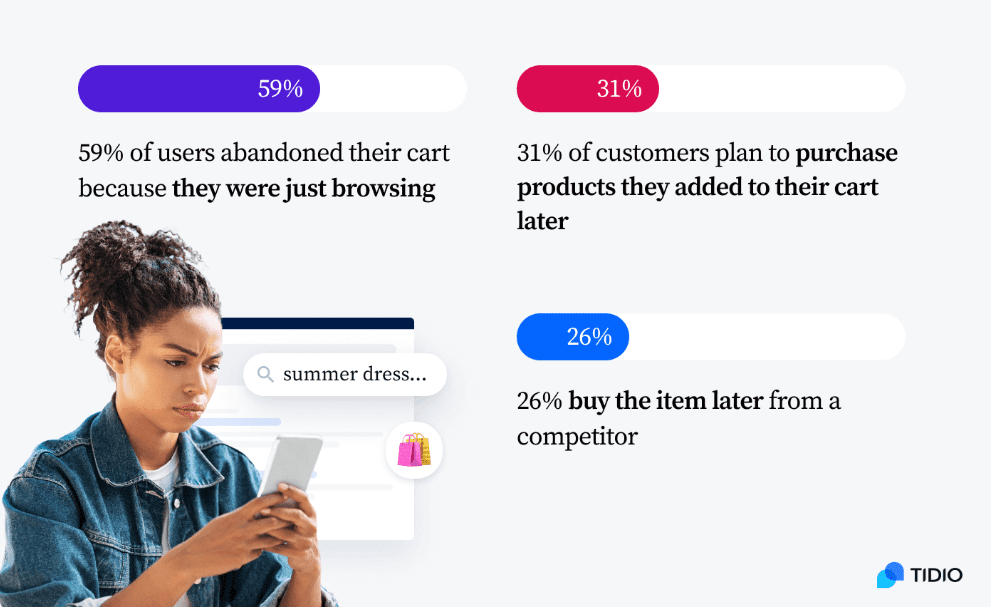
92. 59% of U.S. shoppers leave their carts behind because they’re just browsing and not ready to buy, while 31% plan to come back later. However, 26% end up purchasing from a competitor instead.
Source
93. The Caribbean has the highest cart abandonment rate at 92.2%, while the Asia-Pacific region has the lowest at 76.3%.
94. High prices are a big reason shoppers abandon carts, with 26% leaving to find a better deal. Another 23% simply changed their minds before completing the purchase.
95. Unexpected fees or taxes cause 16% of shoppers to abandon their carts, while 14% hold off for a sale or discount. Another 14% just become indecisive or change their mood.
96. Men are more concerned about high shipping costs and long delivery times, with 59% of them seeing these as issues compared to 41% of women. Also, 54% of men are bothered by a lack of customer reviews, compared to 46% of women.
97. By addressing cart abandonment issues, eCommerce businesses could recover about $260 billion in lost sales.
98. About 57% of B2B buyers abandon purchases because of long and inefficient checkout processes.
99. Returns are another big problem for retailers, costing them $743 billion every year. For every $1 billion in sales, $145 million is lost to returns.
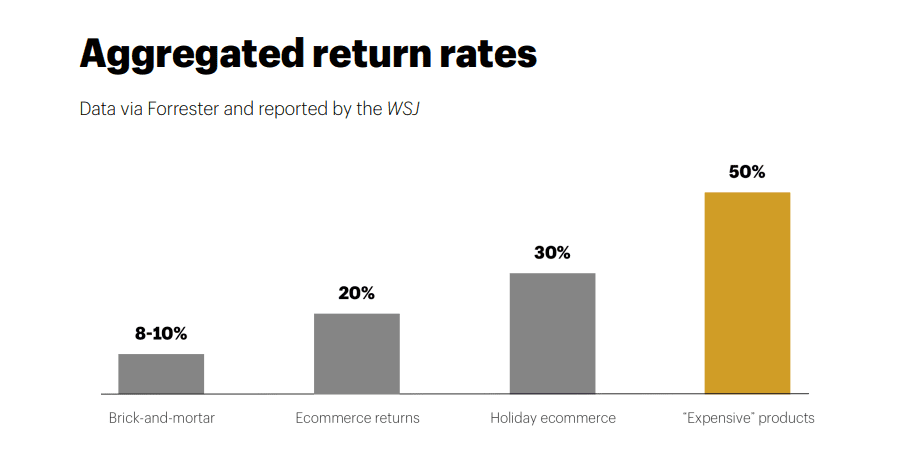
100. Return rates for online shopping can be 2 to 3 times higher than in physical stores. On average, about 20-30% of online purchases are returned. This happens because customers can’t try the products before buying, leading to more returns.
Source
101. Return fraud is also on the rise. For every $100 in returned items, retailers lose $13.70 to fraud, up from $10.40 last year.
102. More than 7 out of 10 retailers let customers return items in-store, even if the purchase was made online.
103. Around 70% of shoppers prefer to buy from retailers that offer easy self-service return options, like mail-ins or in-store returns.
Online Shopping Stats: Trends For 2026
Finally, let’s check out the online shopping trends and insights that will be super valuable for every online business in 2026:
104. Augmented Reality (AR) is shaping the future, with 40% of shoppers willing to pay more for products they can test using AR. In fact, over 90% of Americans already use or would consider using AR when shopping.
105. AR try-on tools could save $7.5 billion in product returns globally, as 38% of returns happen because items don’t fit. AR can help solve that problem before making a purchase.
Source
106. Automation is also helping brands grow. eCommerce businesses have seen an 80% increase in lead generation and a 45% boost in ROI by using automation.
107. Consumers love personalization, and AI is making it easier for businesses to deliver. In fact, 54% of shoppers prefer online stores that use AI-powered services.
108. When it comes to sustainability, 80% of people say they trust companies that share their sustainability data, while 40% feel uncomfortable buying from companies that aren’t actively working toward sustainability goals. As a business, having clear sustainability goals is a must.
Conclusion
The rise in online shoppers is fueling the fast growth of eCommerce. As more people prefer the convenience of shopping online, there are greater chances to succeed in this industry.
To help your online business stand out, it’s essential to understand how eCommerce works and stay up-to-date on the latest online shopping stats and market trends.
Focus on what influences customers’ buying decisions to lower cart abandonment and increase sales.
Most importantly, regularly check your store’s performance to identify areas for improvement and quickly adjust to what customers want.