The battle between iPhone and Android isn’t just about phones—it’s about how people choose to live, spend, and connect in a digital world.
Apple’s iOS is only found on iPhones, offering a closed and tightly controlled experience, while Android runs on everything from budget phones to high-end flagships across dozens of brands.
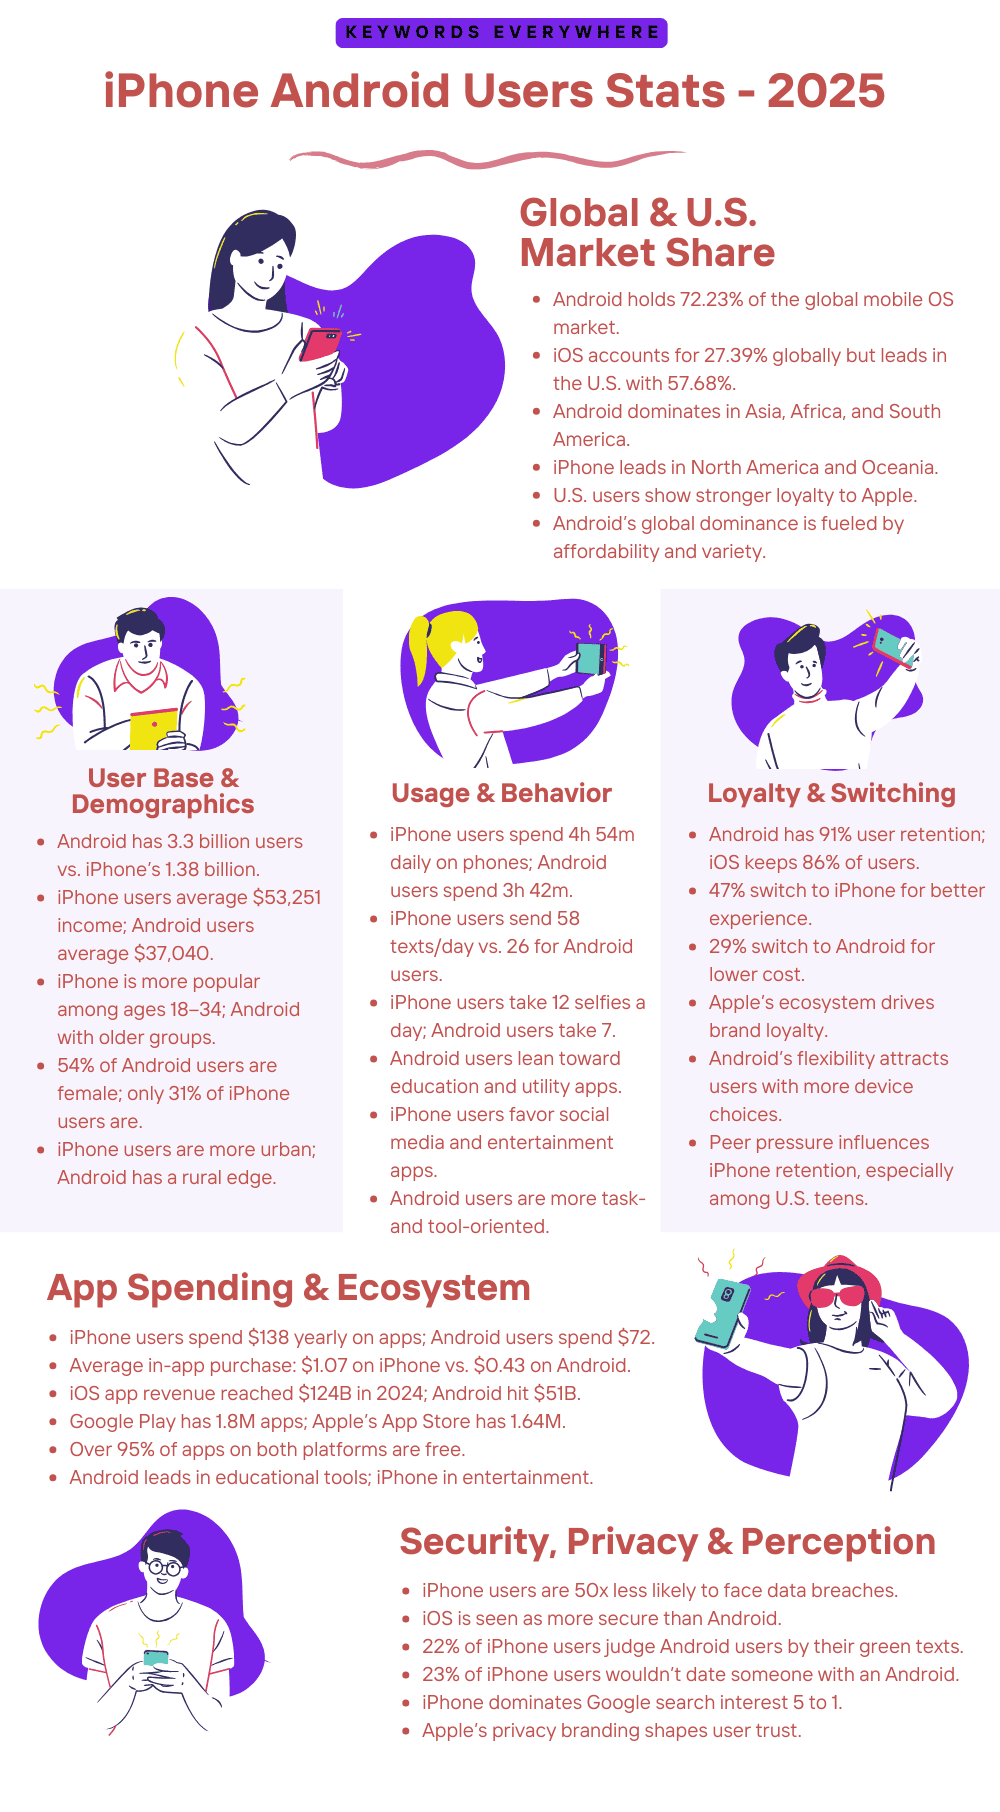
As of 2025, Android holds around 72% of the global market, while iPhones dominate in the U.S. with nearly 60% of users.
In this guide, we’ll break down the latest iPhone Android users stats, from market share and user numbers to sales, loyalty, and app spending trends.


Top iPhone Android Users Stats
When it comes to smartphones, the battle between iPhone and Android isn’t just about features or design—it’s about numbers, trends, and how people all over the world are choosing their devices.
Whether you’re a tech enthusiast or simply curious about who’s winning the mobile race, these top iPhone Android user stats will give you a clear look at how these two giants compare in 2025.
1. As of late 2024, Android dominates the global smartphone market with a 71.67% share, while iOS holds 27.73%.
2. In the United States, iOS leads with a 56.63% market share, while Android accounts for 43.07%.
3. As of 2024, the number of iPhone users globally is 1.46 billion, and the number of Android users is 3.9 billion.
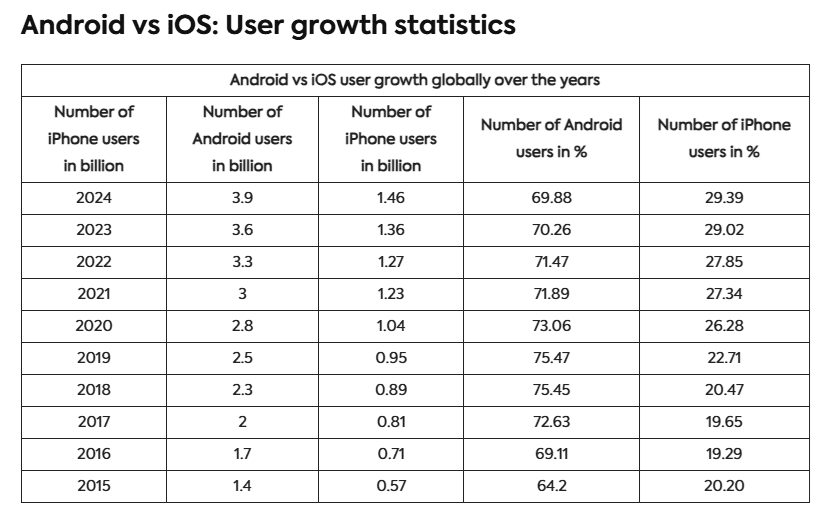
iPhone Android user growth
4. In 2023, Apple shipped over 234.6 million iPhones globally, while Samsung shipped 226.6 million units.
5. The majority of young users aged 18–34 prefer iPhones, while 41% in this age group use Android. However, this trend shifts with age as older generations favor Android over iPhones.
6. iPhone users have an average annual income of $53,251, compared to $37,040 for Android users.
7. Among female users, 31% prefer iPhones, while 54% opt for Android. Male users, on the other hand, prefer Android over iPhone.
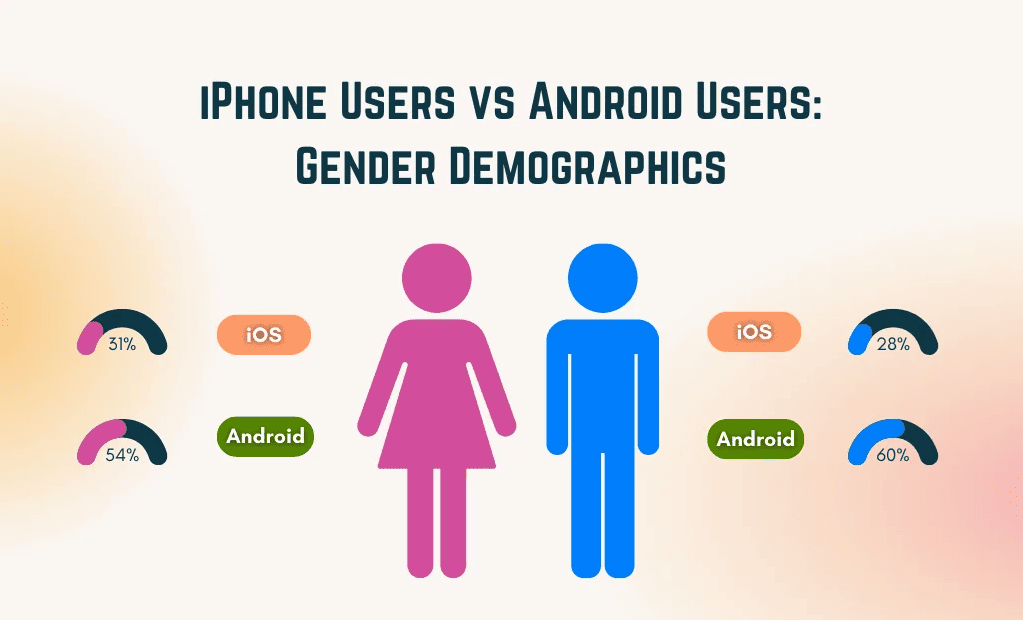
iPhone vs Android users by gender
8. iPhone users average 4 hours and 54 minutes of screen time, send 58 text messages, and take 12 selfies daily.
9. Android users average 3 hours and 42 minutes of screen time, send 26 text messages, and take 7 selfies daily.
10. Android users have a slightly higher customer retention rate at 91%, compared to 86% for iOS users.
11. iOS users spend an average of $1 per app, while Android users spend $0.47.
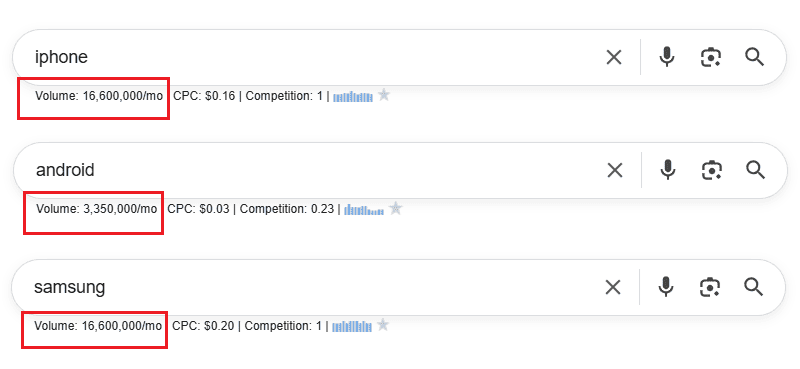
12. According to Keywords Everywhere, the term “iPhone” has a monthly search volume of 16,600,000, while “Android” sees a lower volume of 3,350,000. However, when you look at individual Android brands, terms like “Samsung” match iPhone with a search volume of 16,600,000.
Global iPhone vs Android Market Share
Across the world, millions of people rely on either an iPhone or an Android phone, but the share of users isn’t evenly split depending on where you look.
This section of iPhone Android users stats breaks down how much of the global smartphone market each platform holds, showing you where Android leads by a mile and where iPhones have carved out stronger ground:
13. As of early 2025, Android holds a strong lead globally with around 71.61% of the smartphone OS market, while iOS accounts for about 27.97%.
14. In India, Android dominates with a massive 95.21% market share, thanks to the wide range of affordable Android smartphones available.
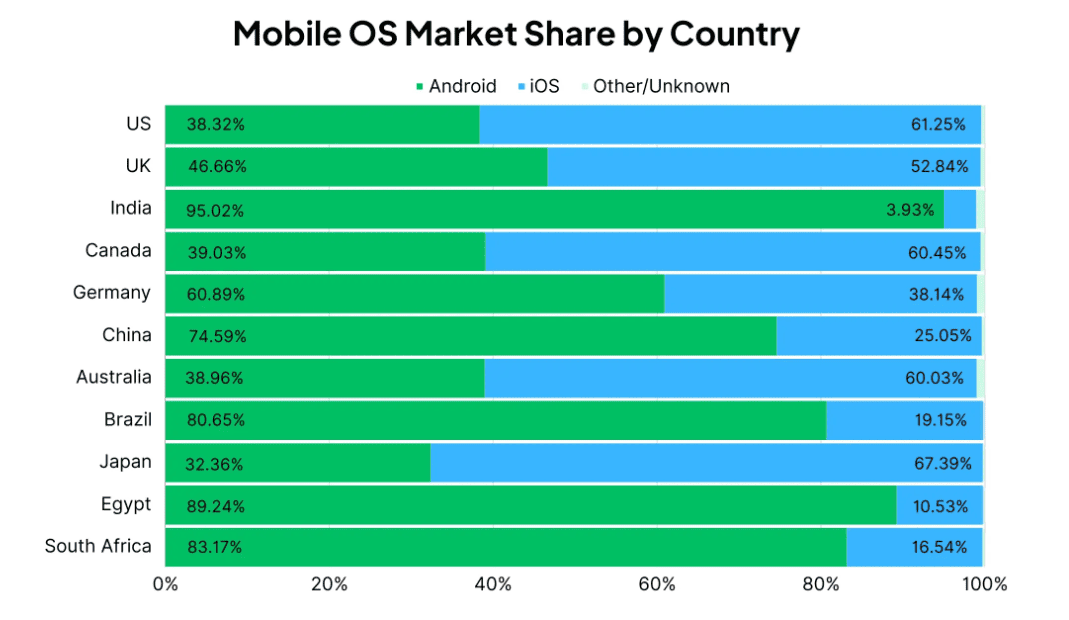
Mobile OS market share by country
15. In China, Android still leads with 77.85% of the market, even though Google services are banned—local brands like Huawei and Xiaomi play a major role.
16. Across Europe, Android holds around 65% of the market, although the numbers shift by country—for example, Germany leans more toward Android, while the UK is more evenly split.
17. On the whole, North America, Europe, and Oceania prefer iPhone/iOS, while Asia, Africa, and South America favor Android.
U.S. iPhone vs Android Market Share
In the United States, the competition between iPhone and Android plays out very differently than in the rest of the world, with certain states, age groups, and income levels showing clear preferences.
Here, we’ll explore who’s leading in the American market, how it has changed over time, and what those changes say about how Americans really feel about their phones.
18. As of April 2025, iPhone (iOS) holds a market share of 57.6% in the United States, and Android devices account for 42.4% of the U.S. smartphone market.
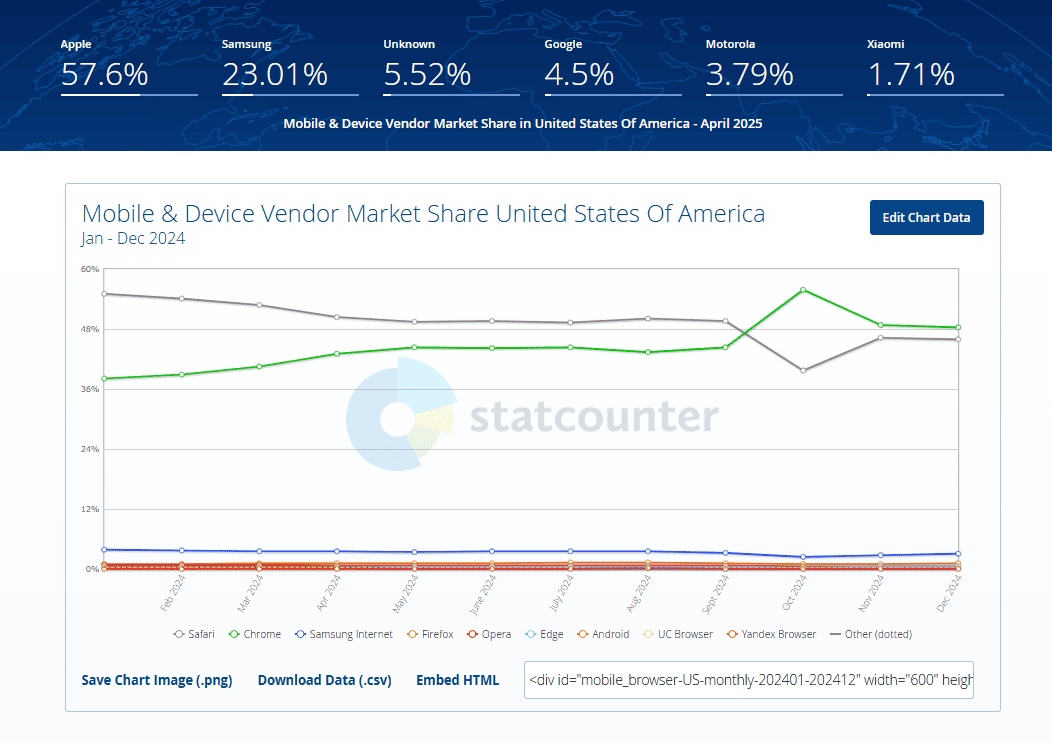
Mobile vender market share in the U.S.
19. Android reached its highest recorded market share in the U.S. at 46.42% in 2015, while iPhone held 50.85%. Since 2015, iPhone has consistently maintained a lead over Android in the U.S. market.
20. When it comes to leading smartphone manufacturers in the U.S., after the iPhone, Samsung holds the second position with 23.01%, and Google accounts for 4.5% of the market.
21. Motorola has 3.79% of the market share, and Xiaomi represents 1.71% of the U.S. smartphone market.
22. Approximately 133.4 million people in the U.S. own an Android smartphone, while iPhone users in the country total around 118.1 million.
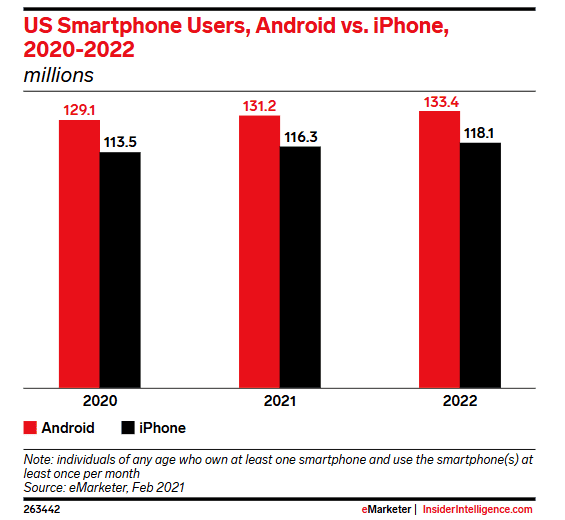
US smartphone users, iPhone vs Android
iPhone vs Android Smartphone Sales Data
Sales numbers can say a lot about what people want, what’s trending, and how consumer behavior shifts from year to year.
In this section of iPhone Android users stats, we’ll take a closer look at how many devices each platform is selling, which models are rising to the top, and how both iPhone and Android phones are performing in different parts of the world.
23. The global smartphone market grew by 7% in 2024, reaching 1.22 billion units, marking a rebound after two years of decline.
24. Apple shipped 234.6 million smartphones in 2023, just ahead of Samsung, which shipped 226.6 million. Xiaomi shipped 40.7 million smartphones in 2024, holding a 10.62% market share.
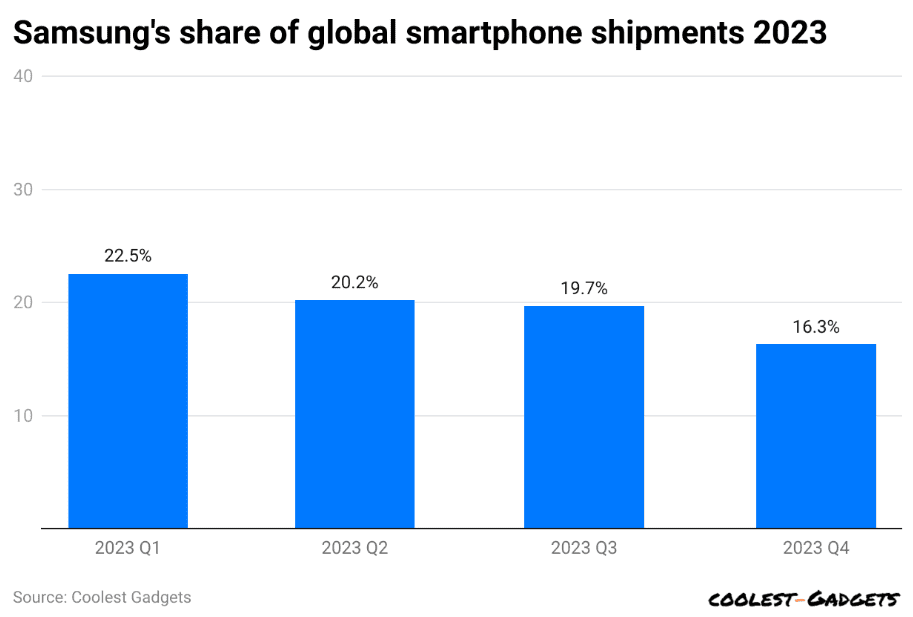
Samsung’s share of global smartphone shipments in 2023
25. In the U.S., Apple shipped 50.1 million iPhones in Q1 2024, a 9.6% decrease year-over-year. Samsung shipped 60.1 million smartphones globally in Q1 2024, maintaining a 20.8% market share.
26. The iPhone 15 led global sales in 2024, accounting for approximately 3% of the 1.22 billion smartphones shipped that year. The iPhone 15 Pro Max quickly became the second-most-shipped smartphone of the year.
27. Samsung’s Galaxy A15 4G was the top-selling Android smartphone in 2024, reflecting the strong demand for budget-friendly devices.
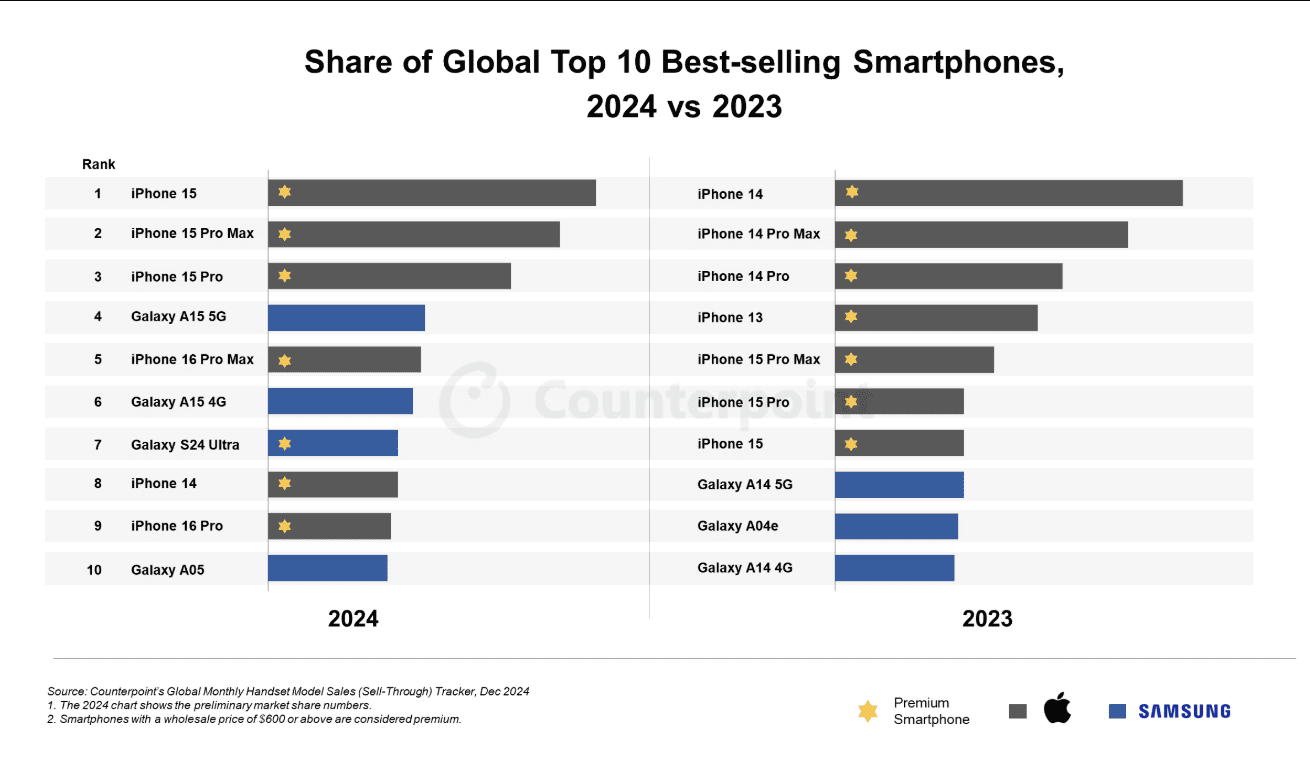
Top 10 best-selling smartphones worldwide (2024 vs 2023)
iPhone vs Android User Demographics
Understanding who uses iPhones and who prefers Android tells us more than just age or income—it shows us how different groups of people interact with technology.
This section of iPhone Android users stats breaks down the key demographic details like age, gender, income, and location of the two user bases in a practical and eye-opening way.
28. Younger adults in the U.S. lean heavily toward iPhones, with 58% of users aged 18–34 using iPhones and 41% using Android. As age increases, Android use rises, especially among those over 35.
29. Globally, Android dominates across all age groups, but especially with Gen Z and Millennials. About 57% of Gen Z and 55% of Millennials use Android, while just 31% and 35% use iPhones, respectively.
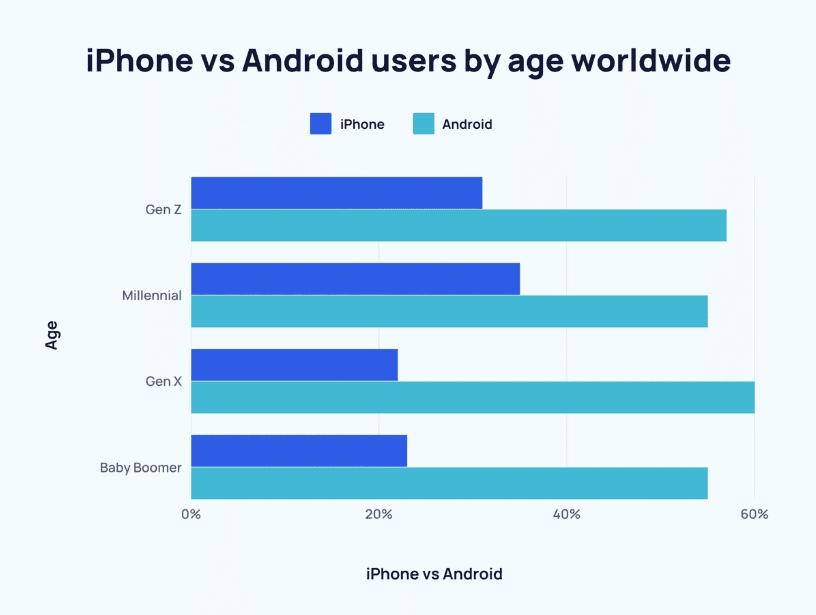
iPhone vs Android users by age
30. In the U.S., 31% of women and 28% of men use iPhones, while 54% of women and 60% of men use Android phones.
31. The average income for an iPhone user is around $53,251, while Android users average $37,040 per year, showing iPhone users generally fall into higher income brackets.
32. Educational background also varies—27% of iPhone users hold a graduate or Ph.D. degree, while only 8% of Android users do. Android users are more likely to have only some college education.
33. When it comes to geography, iPhone use is highest in North America (56.81%) and Oceania (54.29%), while Android dominates in Asia (79.22%), Africa (87.51%), and South America (85.32%).
iPhone vs Android User Behavior and Preferences
The way people use their smartphones can vary a lot depending on the platform they choose, from how often they use apps to how much they care about privacy or customization.
The following iPhone vs Android users statistics explore how user behavior differs between iPhone and Android fans:
34. iPhone users install an average of 40 apps on their devices, while Android users typically install around 25 apps.
35. Social media apps have a 95% penetration rate on both platforms, showing they’re a core part of mobile use regardless of the OS.
36. iPhone users average 4 hours and 54 minutes of screen time daily, while Android users average about 3 hours and 42 minutes.
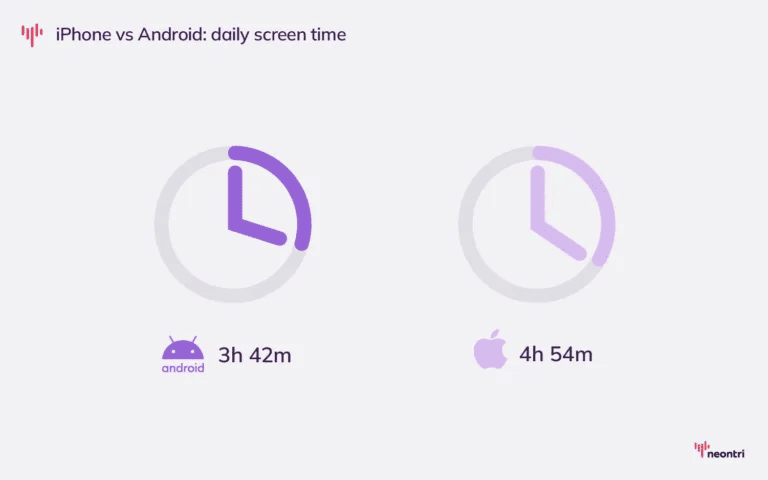
iPhone vs Android daily screen time
37. On a daily basis, iPhone users send around 58 text messages and take 12 selfies, while Android users send 26 messages and take 7 selfies.
38. iPhone users are 50 times less likely to experience a data breach compared to Android users, largely due to Apple’s stricter app vetting and security practices.
39. In 2024, iPhone users spent around $124 billion globally on apps, more than double Android users who spent $51 billion.
40. The average in-app purchase for iPhone users is $1.07, compared to just $0.43 for Android users.
41. About 22% of iPhone users admit to looking down on green-bubble texts (non-iMessage), and 23% say they would hesitate to date someone who uses Android.
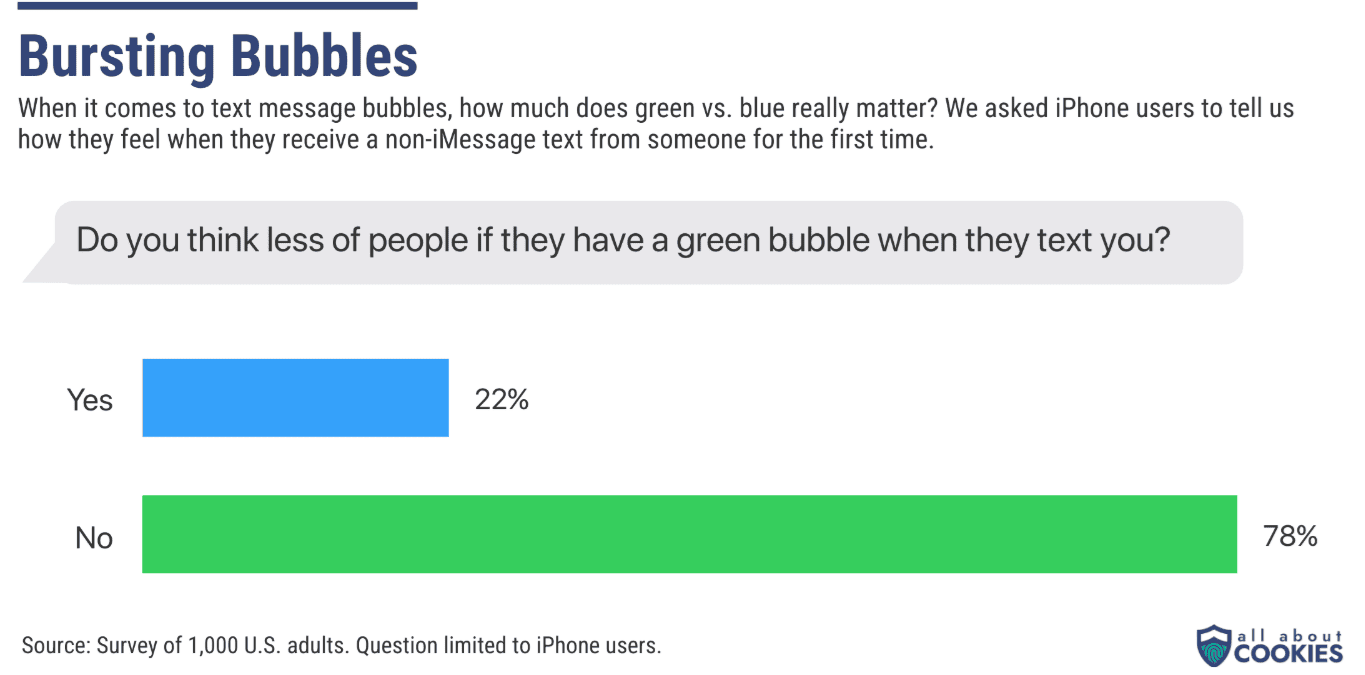
How much text message bubbles matter to iPhone users
42. Roughly 52% of Android users say they’ve been mocked or judged for their phone choice, and 30% have considered switching just to avoid negative attention.
43. Around 42% of iPhone users rely on third-party messaging apps like WhatsApp or Telegram to accommodate non-iOS users.
iPhone vs Android User Loyalty and Switching Rates
One of the biggest questions in the mobile world is how loyal users really are to their platform—and what makes someone switch.
In this section, we’ll dig into how often people move from iPhone to Android or vice versa, what keeps them loyal, and the reasons behind some of the most common platform changes.
44. In 2024, 11% of Android phone buyers had previously used an iPhone, which was the highest share recorded in the last five years.
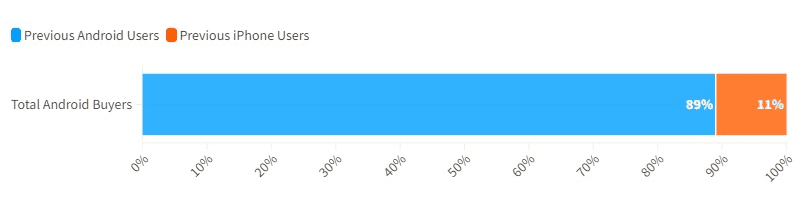
User switching from iPhone to Android
45. On the flip side, 18% of iPhone users had switched from Android, showing a slightly stronger pull toward Apple.
46. Android users have a retention rate between 89% and 91%, meaning most stick with the platform when upgrading. iPhone users have slightly lower retention, with rates ranging from 85% to 88%.
47. When switching from Android to iPhone, 47% of people said they made the move because the iPhone offered a better user experience.
48. Among those who switched from iPhone to Android, 29% said affordability was the main reason for their decision.
49. According to a 2024 survey by Consumer Intelligence Research Partners (CIRP), 57% of Android users said they kept their previous phone for less than two years before upgrading.
50. In comparison, only 34% of iPhone users said they upgraded within two years, suggesting iPhone users tend to hold on to their devices longer.
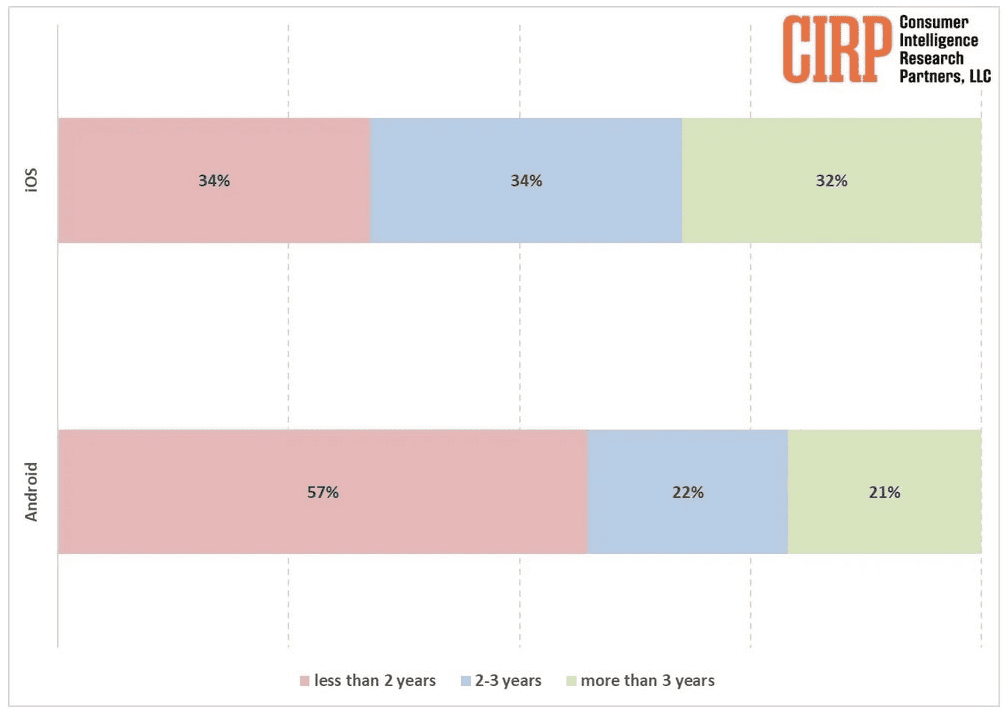
iPhone users hold on to their handsets longer than Android users
iPhone vs Android App Ecosystem
Apps are a huge part of the smartphone experience, and the number and quality of available apps can be a dealbreaker for many users.
The following iPhone vs Android stats will compare the App Store and Google Play to see which platform offers more variety, better quality, and what developers are focusing on in today’s fast-moving mobile world.
51. As of early 2025, the Google Play Store hosts approximately 1.8 million apps, down from 3.4 million in early 2024 due to the removal of low-quality or policy-violating apps.
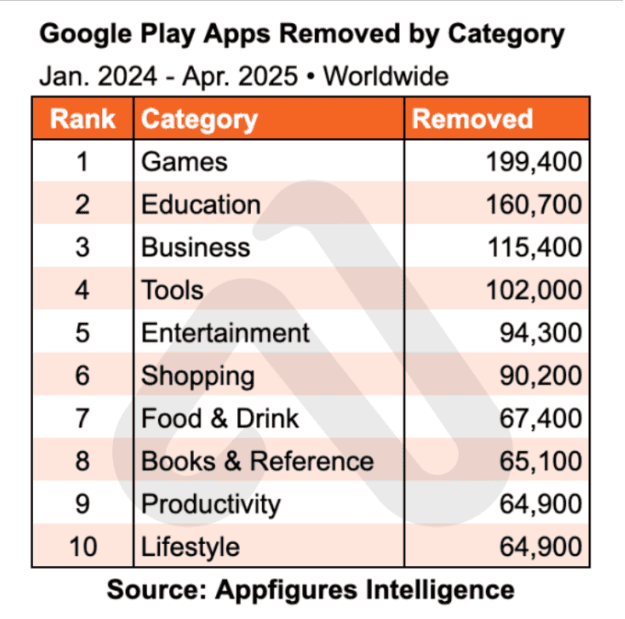
Google Play apps removed by category
52. The Apple App Store offers around 1.64 million apps, a slight increase from 1.6 million the year before.
53. In 2024, Android users downloaded around 81.4 billion apps from Google Play, a 2.6% decline from the year before. iPhone users downloaded about 28.3 billion apps from the App Store in 2024, a slight 1.1% decrease year-over-year.
54. On the Google Play Store, 96.98% of apps are free, and only 3.02% are paid.
55. In the Apple App Store, 95.2% of apps are free, while 4.8% are paid, showing a slightly higher percentage of premium apps than Android.
56. On iOS, entertainment apps lead the download charts, followed closely by social networking and productivity apps.
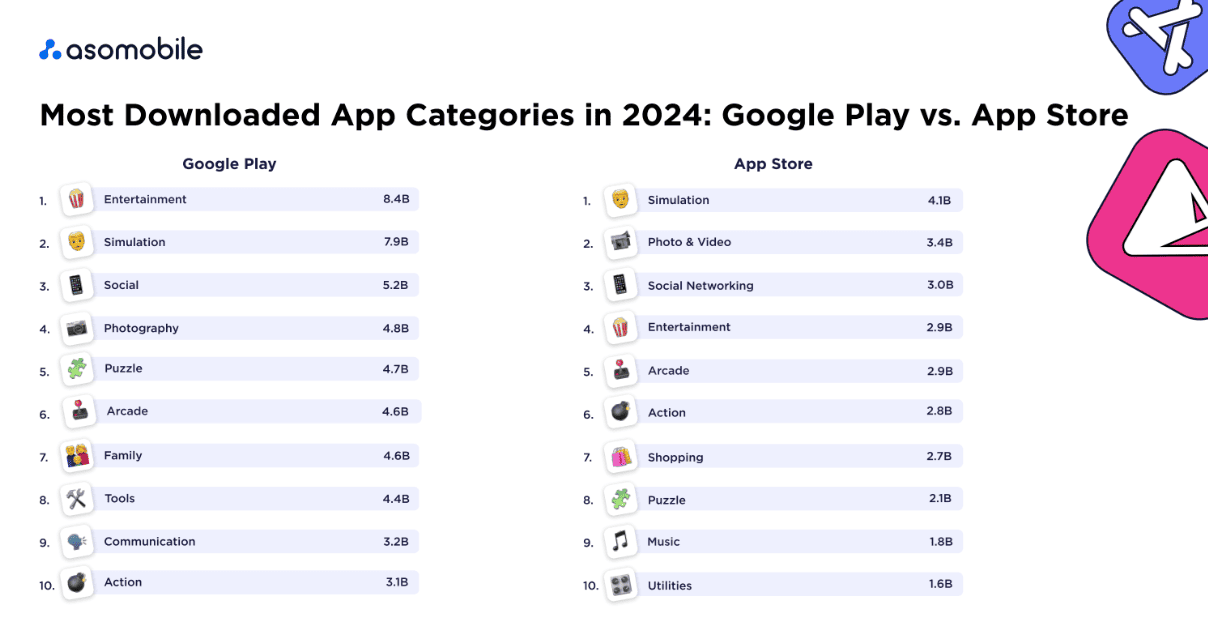
Most downloaded app categories in 2024
57. On Android, education is the top app category in terms of volume, with games and business apps also making up large portions of the app library.
58. On the App Store, apps like YouTube, TikTok, and Instagram consistently rank at the top in terms of downloads and user engagement
59. On Google Play, TikTok, Facebook, and WhatsApp are among the most downloaded apps globally.
iPhone vs Android App Spending and Revenue Comparison
Spending habits in mobile apps reveal a lot about how users engage with their devices, and the difference between iPhone and Android in this area is striking.
This section looks at how much money users spend on apps, how revenue breaks down between platforms, and what these trends mean for developers, marketers, and everyday users alike.
60. In 2024, iPhone users spent around $124 billion on apps through the App Store, which made up over 68% of global app spending.
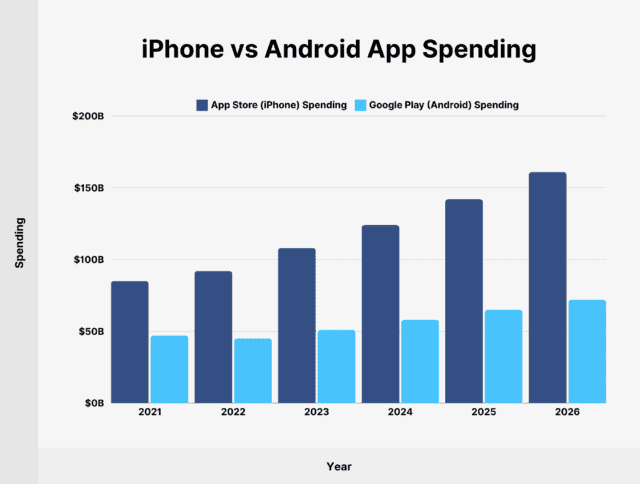
iPhone vs Android app spending
61. Android users spent about $51 billion on Google Play during the same period, which accounted for just under 32% of the total.
62. The average iPhone user spends $138 per year on apps, while Android users average about $72 per year.
63. iPhone users spend an average of $12.77 per app, compared to $6.19 per app on Android.
64. When it comes to in-app purchases, iPhone users spend $1.07 per transaction on average, while Android users average just $0.43.
65. In 2023, iOS apps brought in around $90 billion from gaming apps alone, while Android apps made around $80 billion, with gaming being the top category for both platforms.
66. iPhone apps also pulled in about $50 billion from subscription services like Apple Music and YouTube, far outpacing Android’s performance in the same space.
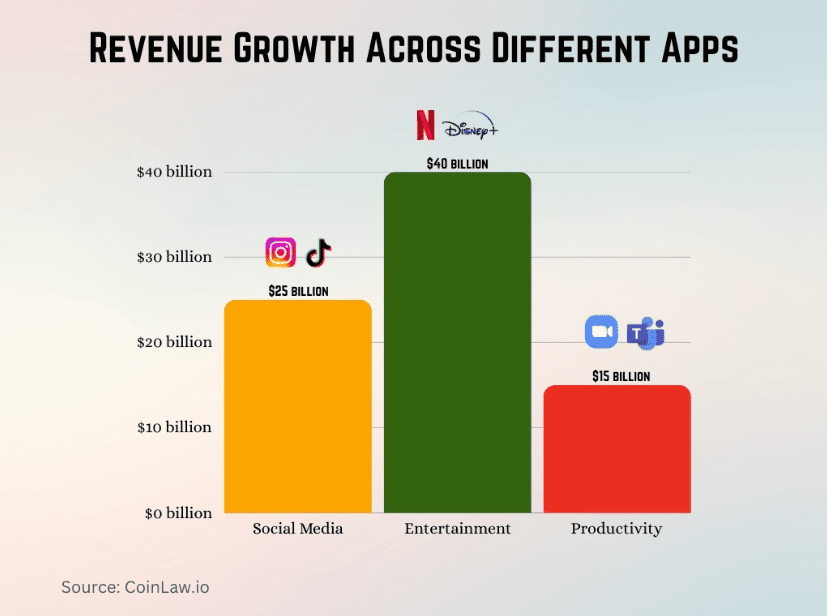
Revenue growth across different apps
67. Regionally, the Asia-Pacific region contributed 50% of all global app revenue, led by countries like China and Japan.
68. North America followed with 30% of total app revenue, thanks largely to strong iOS spending in the U.S.
69. Europe added around $70 billion in app revenue in 2023, which was a 15% increase from the year before.
Conclusion
You’ve now seen the latest iPhone Android users stats—and the differences are clearer than ever.
While Android dominates globally thanks to its variety and affordability, iPhones continue to win in places like North America and among users who value design, privacy, and premium experiences.
iPhone users also spend more on apps, even though Android reaches more people.
The battle between the two isn’t slowing down anytime soon, and the future could shift depending on innovation, pricing, and user habits.