Even if you don’t always read your emails, you most likely have the default email app installed on your phone. That’s because email remains one of the most popular forms of communication even today.
For businesses, it serves an even greater purpose — email marketing. Businesses can use emails to reach out to their customers and potential clients, build relationships, and ultimately drive sales. But with the rise of social media and other digital marketing tactics, is email still relevant?
The answer is yes. Below, we look at some email marketing stats to prove this.


General Email Marketing Stats
Email marketing simply means using emails to promote products or services. Before social media, influencers, and content even existed, email marketing was already being used. Today, it still proves to be an effective strategy for businesses of all sizes.
Here are some general email marketing statistics to give you an idea of its impact.
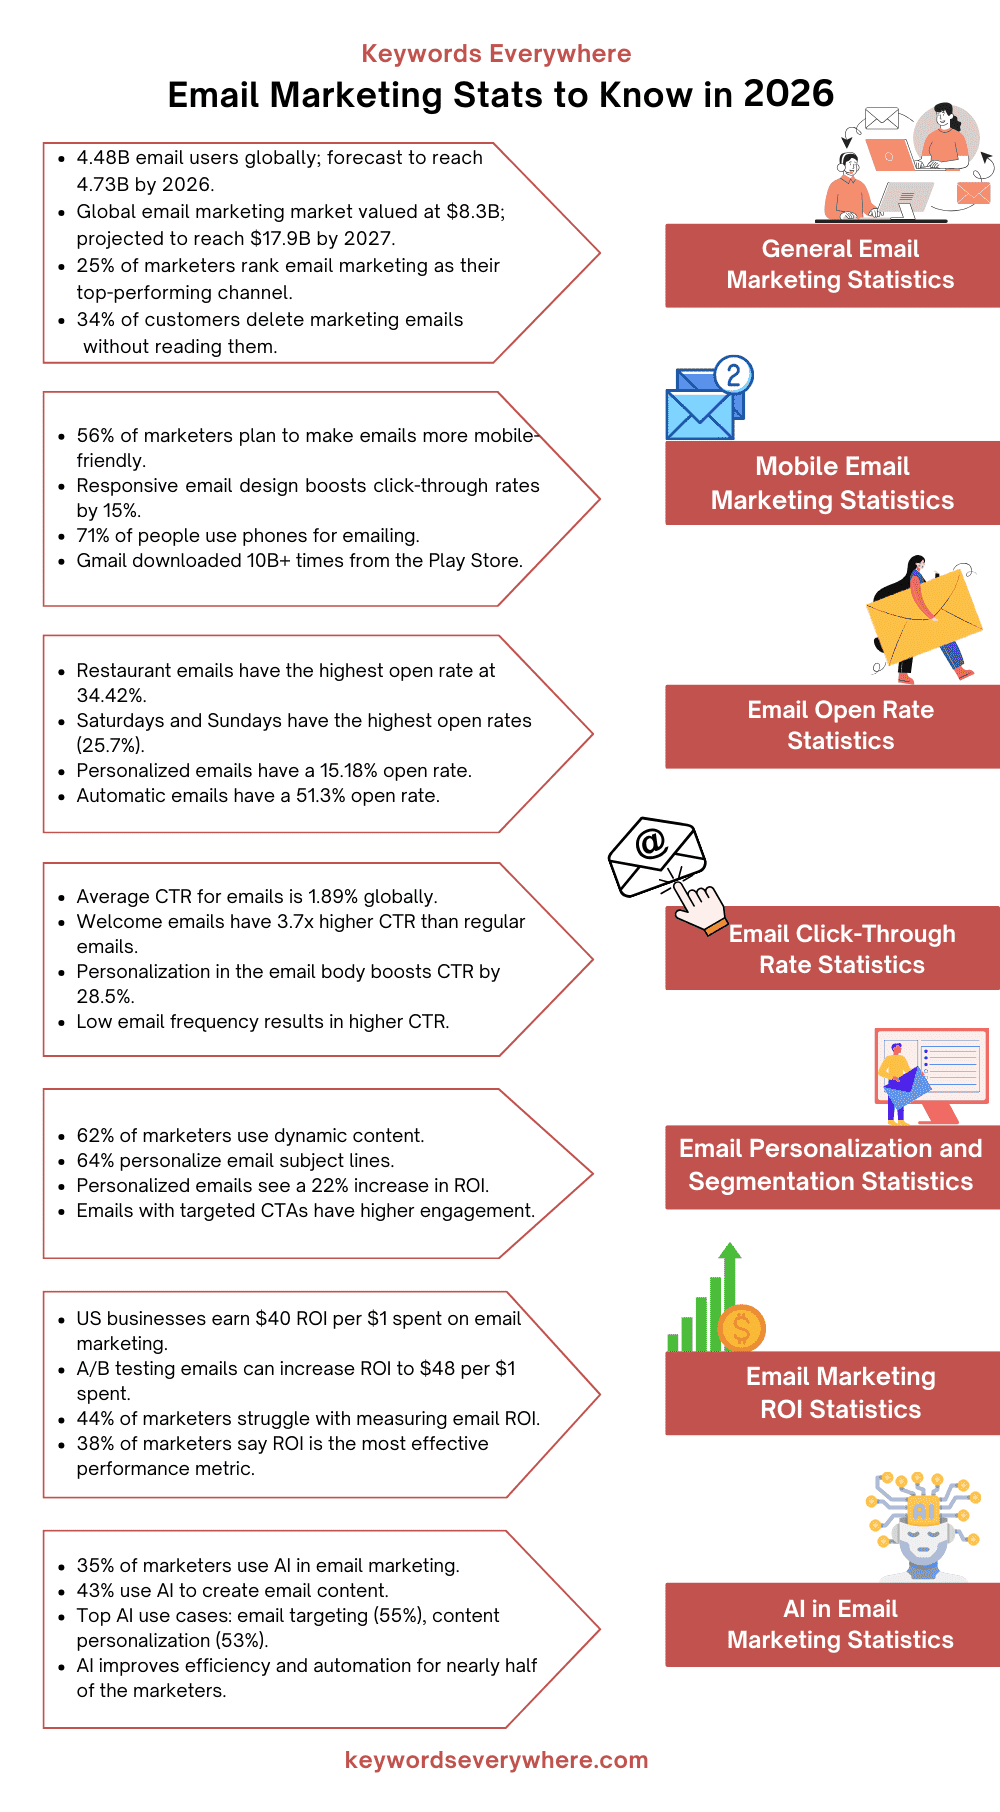
1. There are 4.48 billion email users in the world, and the number is forecasted to increase to 4.73 billion by 2026.
2. The highest number of emails are sent in the US every day.
3. The global email marketing market is valued at $8.3 billion.
4. Statista forecasts that the market’s total value will reach $17.9 billion by 2027 at a compound annual growth rate (CAGR) of 13.3% between 2020 and 2027.
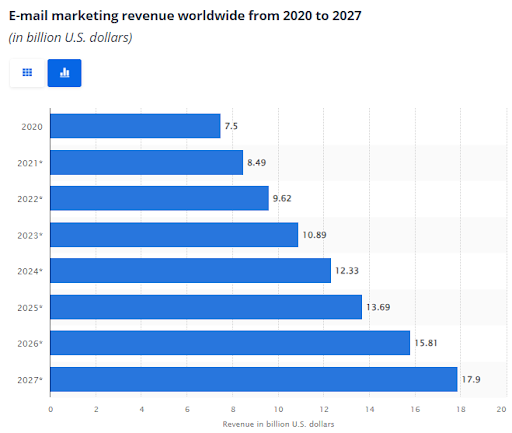
Source
5. According to 45% of email marketers, the most difficult objective to achieve with this marketing channel is maintaining an engaged list. On the other hand, 22% of responding marketers said that mobile optimization is the biggest challenge when it comes to email marketing.
6. In a survey, 16% of marketers said that product awareness was the key objective of email marketing, whereas 14.6% of marketers regarded retention as the top objective.
7. 66.7% of email marketers saw an inbox placement rate, the rate at which emails are successfully delivered to the inbox between 50% and 70%. Meanwhile, 33.3% of email marketers had an inbox placement rate above 70%.
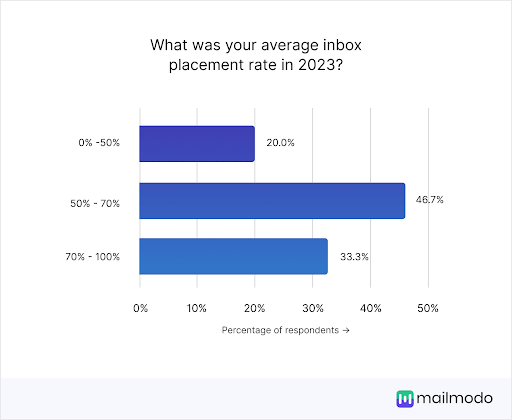
Source
8. Spam messages made up 46.8% of all email traffic in 2023. The highest spam traffic was generated by Russia, accounting for 31.5% of global spam traffic.
9. In a Mail Modo survey, 25% of marketers said that email marketing was their top-performing marketing channel. The second-best marketing channel was organic search at 19.7%, indicating a large gap between the two.
10. 34% of customers say they ignore or delete marketing emails from brands about half of the time without even reading them, while 15% say they always delete them. Meanwhile, 5% of customers say they never ignore or delete emails from brands without reading them.
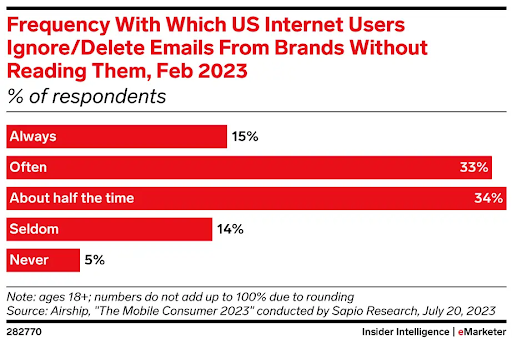
Source
11. 40% of marketers send 1 to 4 emails to their subscribers per month, while 33.6% send 5 to 8 emails per month.
12. While 16.8% of email marketers send newsletters to their subscribers, 15.3% send promotional emails, and 11.6% send lead nurturing emails.
13. 35% of marketers say that Tuesday is the best day to send emails, while 3.3% found Sunday to be the best day to send emails.
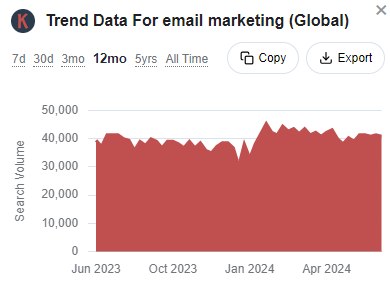
14. The Keywords Everywhere trend data for the term ‘’email marketing’’ shows that the query remains popular throughout the year. So, there’s always a sufficient number of organic queries around email marketing, hinting at the channel’s widespread year-round use.
Mobile Email Marketing Stats
Since most people now use their phones to access the web, they also check their email on their phones. Here are some statistics on mobile email marketing.
15. Nearly 56% of marketers report that they plan to make their email campaigns more mobile-friendly by using mobile-based designs, while 52% say they plan to include personalization in their emails.
16. Responsive email design can increase the click-through rates for emails on mobile phones by 15%.
17. In a survey, most marketers reported that 40% to 60% of their email engagement was from mobile devices.
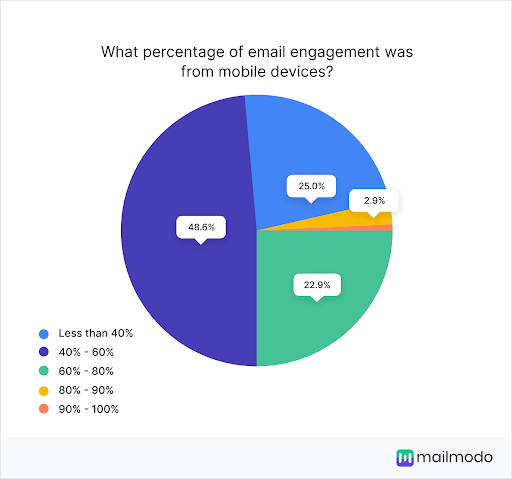
Source
18. Gmail has been downloaded over 10 billion times from the Play Store.
19. In a Statista survey, nearly 71% of respondents said they use their phones for emailing, which is the second most common use case for mobile phones after chatting or sending messages.
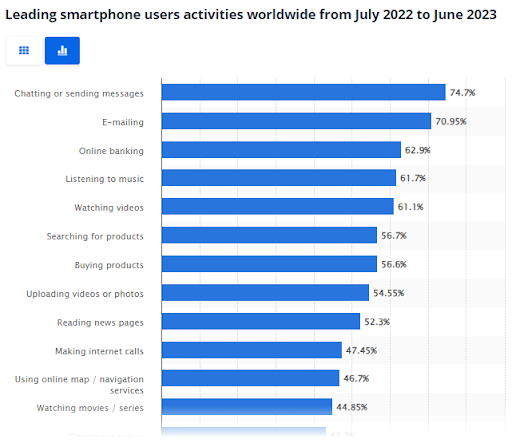
Source
Email Open Rate Stats
In email marketing, the open rate is the percentage of recipients who open an email. Ideally, you want the open rate to be as high as possible to ensure that your message is being seen and potentially acted upon.
Here are some statistics you should know about email open rates.
20. The highest email open rate is in the restaurant sector, with 34.42% of emails being opened. Political emails are in second place with an open rate of 34.07%, while agriculture emails have a 31.69% open rate.
21. Norway has the highest email open rate of 33.5%, followed by Greece with 31.77%, Kuwait with 31.17%, and Costa Rica with 29.12%.
22. The best days to send emails are Saturdays and Sundays since the open rate is 25.7% on both these days. Fridays have an open rate of 25.15%, followed by Thursdays with an open rate of 23.3%.
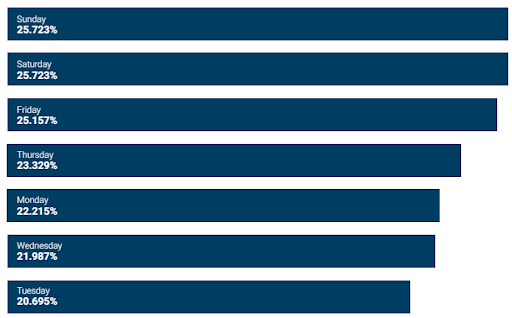
Source
23. Personalization is really important in email marketing because personalized emails have an open rate of 15.18%.
24. Automatic emails also tend to get opened a lot, as they have an open rate of 51.3%.
25. Geographically, Oceania has the highest open rate of 37.9%, followed by North America with 31.02%, and Europe with 30.6%.
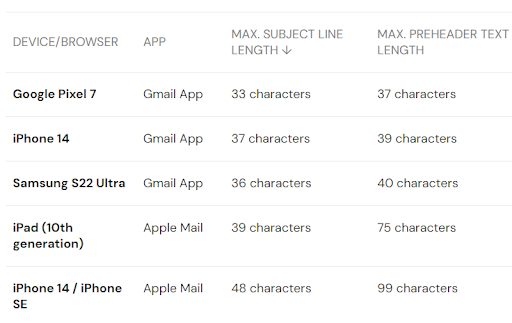
26. The top-performing emails have around 43 characters in the subject line.
27. In iPhone’s default email app, only 48 characters of the subject line are visible. In comparison, the Gmail app shows the first 37 characters without opening the email.
Source
28. According to 30% of marketers from across the globe, their email campaigns have an open rate of between 10% and 20%. Another 57.8% of marketers say that their emails’ open rates are between 20% and 50%.
29. Around 67% of marketers reported seeing an increase in the open rate of their emails between 2021 and 2022, while 23% of marketers saw no change.
30. In terms of email service providers, GetResponse ranks the highest, with 86.5% of emails sent that reached their recipients’ inboxes. MailChimp was in second place, as 80.66% of the emails sent by MailChimp reached their destination.
31. Marketing emails sent by the clothing sector have the highest delivery status (i.e. it reached the recipient) at 86.7%, followed by the dating industry emails at 81.5%.
Email Click-Through Rate Stats
The click-through rate (CTR) of an email is the percentage of recipients who clicked on a link or clicked through to the website. For example, if you sent an email to 100 people and 20 of them clicked on the link, then your CTR would be 20%. The following statistics will provide a better understanding of the average CTR for email campaigns.
32. On average, the click-through rate for emails is 1.89% worldwide. In North America, it is 2.96%.
33. Welcome emails have a higher click-through rate (3.7x) compared to regular emails. It’s most likely because welcome emails tend to have a higher level of engagement as they are sent right after someone subscribes to your email list.
34. Marketing emails have a click-through rate of 7.41% in Canada, which is the highest among all large countries selected in a data set.
35. Marketers who use personalization in the email body can expect to see a 28.5% increase in click-through rates.
36. The email click-through rate is the highest on the weekends, reaching 2.59% on Sundays and 2.58% on Saturdays. The lowest click-through rate is on Tuesdays at just 1.88%.
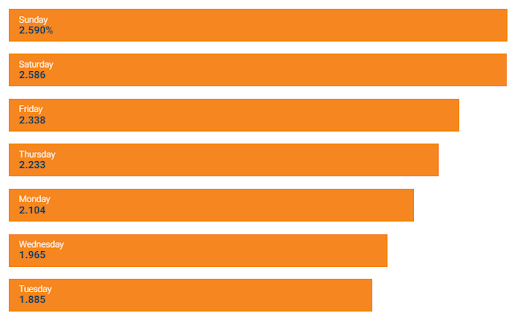
Source
37. Low email-sending frequency results in a higher click-through rate. Marketers who send 1 email newsletter a week see an open rate of 3.44%, compared to 2.75% for 2 newsletters a week and 2.4% for 3 or more emails a week.
38. The insurance industry has the highest email click-through rate at 8.20%. The manufacturing industry is in second place with 5.97%, consulting with 5.72%, government with 5.6%, and media with 4.59%. On the contrary, the gaming industry has the lowest click-through rate of 0.39%.
39. Automatic emails have a click-through rate of 5.7%, non-personalized emails of 2.4%, and personalized emails of 2.0%.
Email Personalization and Segmentation Stats
Email segmentation means dividing your email subscribers into smaller groups based on specific criteria such as demographics or interests. Segmentation allows better personalization since you can tailor the message to the specific group. Here are some helpful email segmentation statistics.
40. Around 62% of marketers use dynamic content in their emails, which means they personalize the content based on subscriber data.
41. 64% of marketers personalize the email subject lines to match the subscriber’s interests.
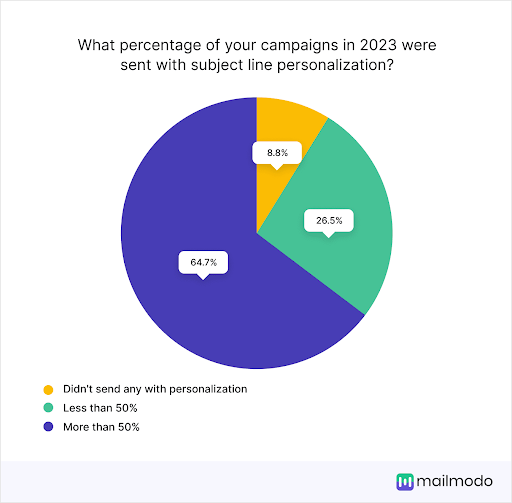
Source
42. In a survey, 55% of customers reported that an enjoyable brand experience would include targeted discounts and promotions.
43. Gartner reports that 53% of consumers prefer emails with an anniversary or birthday mention.
44. Emails sent using send time optimization (STO) have seen anywhere from 5% to 10% increase in open rates and click-through rates.
45. Brands that use dynamic content in their email marketing campaigns see a 22% increase in return on investment (ROI) compared to those that don’t. While the former gets $44 for every dollar spent, the latter gets $36.
46. 23.6% of marketers report that actionable CTAs work best for them, while 21.8% say that ones with offers work the best.

Source
Email Unsubscribe Rate Stats
Someone is said to have unsubscribed when they opt out of receiving any further emails from a brand. People unsubscribe from your email list for various reasons, including not finding the content relevant or interesting. The following statistics shed more light on this.
47. The gaming industry has the highest unsubscribe rate at 3.48%, followed by the mobile sector at 2.86% and real estate at 1.79%. In comparison, the legal sector has the lowest unsubscribe rate of 0.10%.
48. Most people (0.19%) unsubscribe from emails on Thursdays. However, there’s not much of a difference between the unsubscribe rates of each weekday, with Saturday having the lowest (0.159%).
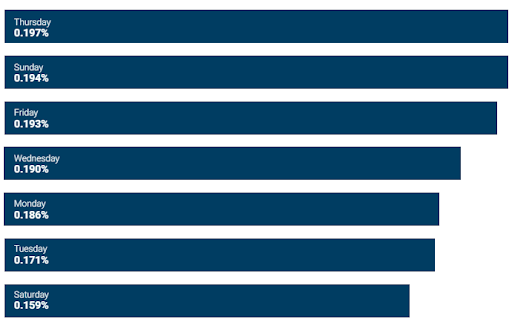
Source
49. In a 2023 survey, 64.3% of the recipients aged between 55 and 64 reported habitually opting out of mailing lists, while 53% of people aged between 18 and 24 said they did the same.
Email Marketing ROI Stats
Regardless of the marketing channel, businesses are always on the lookout for a good return on investment (ROI). Email marketing consistently proves to be one of the most cost-effective ways to reach and engage with customers. These statistics highlight just how effective email marketing can be.
50. On average, US businesses get an ROI of $40 for every dollar spent on email marketing. In comparison, EU brands get an ROI of $43.
51. On average, US merchants earn $6.86 for every subscriber in their mailing list, indicating that a larger mailing list could lead to higher returns.
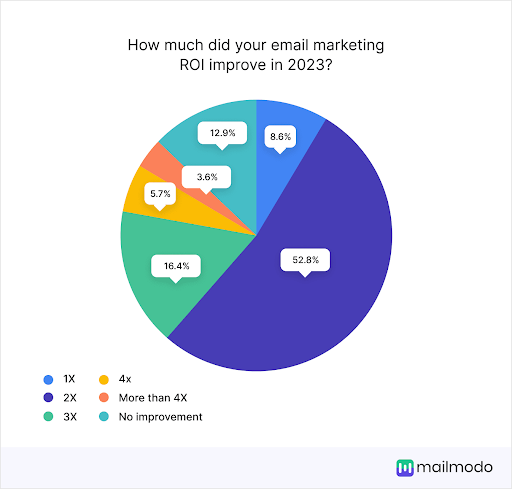
52. In 2023, nearly 53% of marketers said that their email marketing ROI improved by 2x, while 5.7% said it increased by 4x, showing that email marketing continues to be a successful strategy for businesses.
Source
53. Businesses that use A/B testing (comparing two versions of an email to see which performs better) in their email marketing campaigns see a higher ROI of $48 for every $1 they spend compared to $35 for brands that do not use A/B testing.
54. 49% of marketers say that the most important test they can perform is on email messages, while 36% say they A/B test subject lines. Other elements that marketers test include content, personalization, timing and frequency, call-to-actions, and landing pages.
55. About 44% of markers say that they struggle with measuring email ROI and performance.
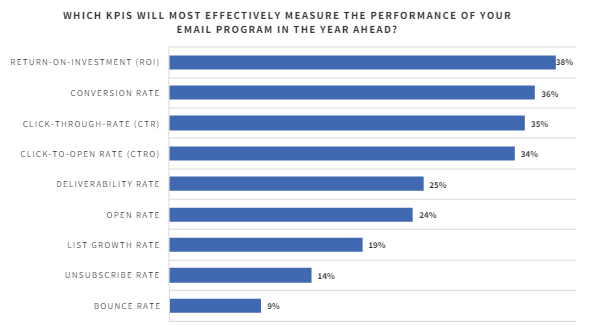
56. 38% of email marketers say that ROI is the most effective way to measure the performance of the email campaign, making it the highest-rated metric. In second place is conversion rate with 36% of marketers saying it is the most effective metric.
Source
AI in Email Marketing Stats
Our email marketing stats won’t be complete without discussing the impact of AI in this field. Marketers use AI to automate and personalize email campaigns, optimize subject lines, analyze customer data, predict customer behavior and buying patterns, and much more.
Here are some statistics on AI in email marketing.
57. 35% of marketers use AI to some extent in email marketing, while 33% plan to implement AI in the future.
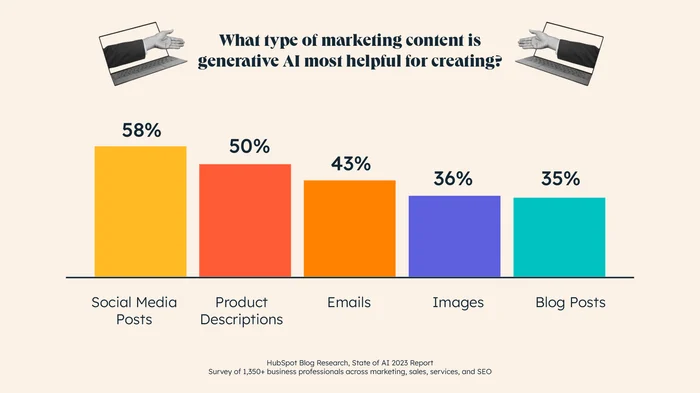
58. According to HubSpot, 43% of marketers use AI to create content for their emails. In the same report, 22% of marketers said they use AI to get inspiration and ideas, which could be for email marketing, too.
Source
59. In another survey, 48% of marketers said that they have begun using AI in email marketing.
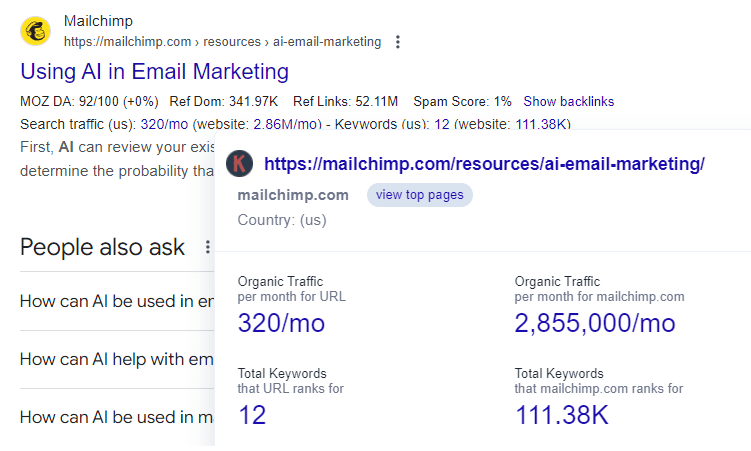
60. According to Keywords Everywhere, the top result for the term ‘’AI email marketing tools’’ gets 320 organic visits per month, which shows that marketers are interested in the idea of implementing AI tools in their email marketing campaigns.
61. For those who are not using AI in email marketing, 41.2% say the top reason is their concern about content quality, while 19% say they are not certain of AI’s effectiveness.
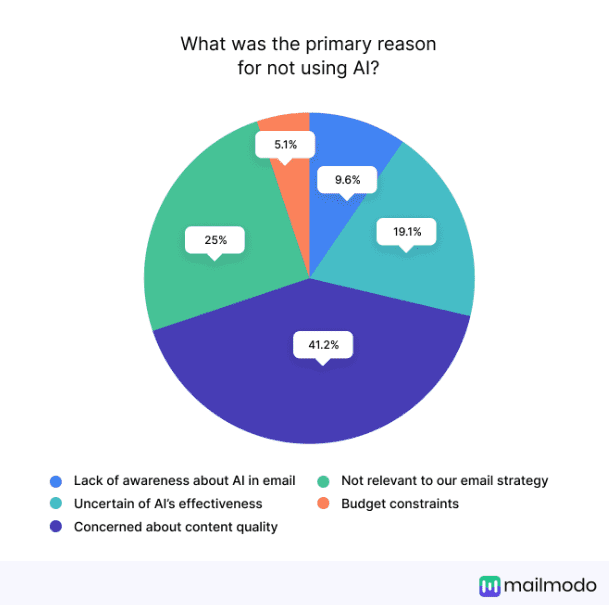
Reasons for not using AI
Source
62. For email marketers, the top three AI use cases are email targeting (55%), content personalization (53%), and email subject line optimization (44%).
63. Nearly half of the marketers say that the most significant benefits of using AI in email marketing are high efficiency and automation. 20% say AI improves personalization, while 15.8% say it enhances campaign optimization.
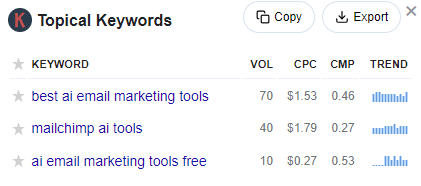
64. The cost-per-click (CPC) of keywords related to AI email marketing tools is over $1.15 on average, indicating a high level of competition and interest in this area.
Conclusion
These email marketing stats show that email is not going anywhere. In fact, it’s only becoming more central to marketing strategies, and AI is playing an increasingly important role in its success.
Marketers are also turning to personalization to engage their customers and maximize the ROI of their emails. Visuals, such as images and videos, also play a significant role in creating engaging email content.
It’s best to A/B test all email elements, from subject lines to visuals, to find out what evokes the best response from your audience. As for AI, it could be just what you need to take your email marketing campaigns to the next level but don’t overlook human creativity and intuition in the process.