Imagine trying to go a day without your smartphone. It sounds tough, right? That’s because our phones have become a big part of our daily lives.
They’re like mini digital hubs that we use for everything—from checking the news in the morning to streaming our favorite shows at night.
This widespread use of smartphones has opened up a big opportunity for businesses to connect with people directly through their phones. This is what we call mobile marketing.
In this article, we’ll look at the latest mobile marketing stats and see why they matter for your business in 2025 & beyond.


What is Mobile Marketing?
Before we dive into mobile marketing stats, let’s first answer a simple question: What is mobile marketing?
Mobile marketing is all about reaching people on their mobile devices. It can appear in different ways, but the key is that it’s made for phones and tablets.
For instance, an ad that pops up while you’re playing a game on your phone is a type of mobile marketing.
Mobile marketing is crucial because more and more people are using their phones or tablets to browse the web instead of computers. In fact, more than half of all internet traffic now comes from mobile devices.
If you don’t have a solid mobile marketing strategy for your business, you’re missing out on a huge number of potential customers. So, let’s explore some important mobile marketing stats.
Top Mobile Marketing Statistics
Let’s dive into the top mobile marketing stats and see how they impact internet traffic. This will help us grasp why mobile marketing is so important in 2024.
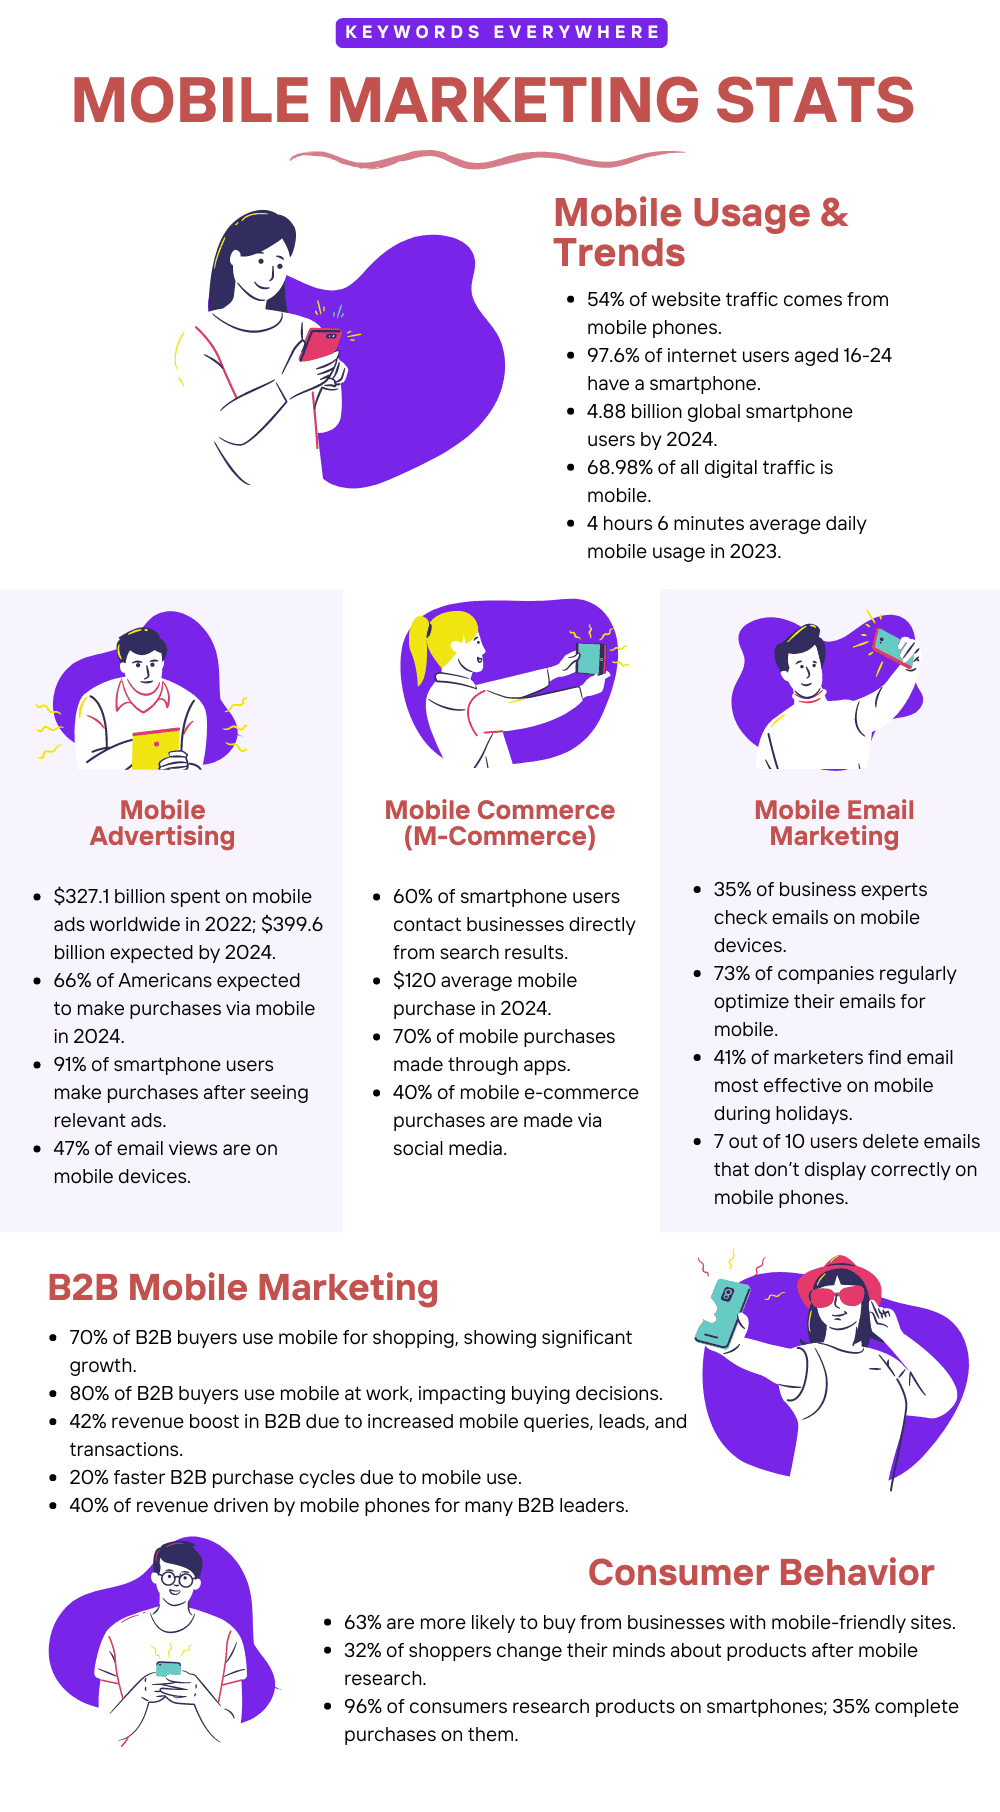
1. 54% of website traffic now comes from mobile phones, beating desktop users. If your site isn’t mobile-friendly, you could be missing out on many potential leads.
2. 97.6% of internet users aged 16-24 have a smartphone. Even though 90% of people use laptops, desktops, or tablets to go online, an impressive 98.1% access the internet on their phones.
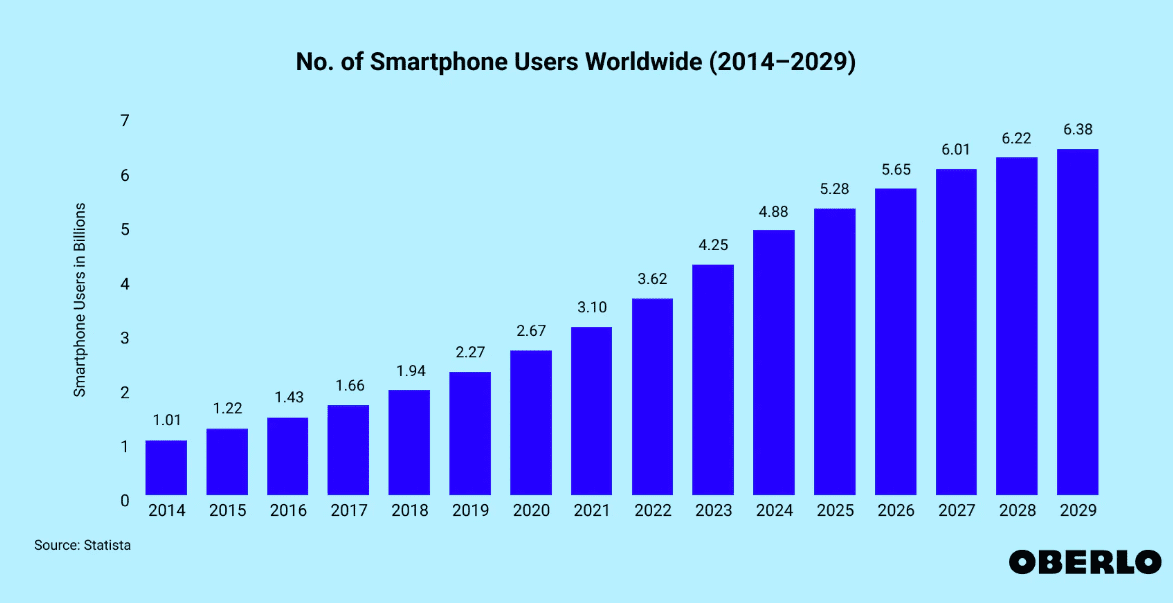
3. By 2026, there are expected to be 5.65 billion smartphone users worldwide, a 14.9% increase from the previous year. That’s almost five times the number of users from 2014.
Source
4. Mobile advertising spending was set to hit a record $327.1 billion worldwide in 2022, a 17.2% increase from the previous year. By 2024, this number is expected to reach nearly $399.6 billion.
5. In 2024, 66% of Americans are expected to make at least one purchase using their mobile devices.
6. In the U.S., mobile made up 48% of business-to-business marketing in 2022, and it’s expected to top 50% by the end of 2024.
7. By 2028, 70% of all digital ad spending will come from mobile.
8. $255.8 billion of social media ad spending is projected to be from mobile by 2028.
9. Mobile advertising spending is expected to exceed $413 billion by 2024. Mobile retail ecommerce sales are forecasted to go beyond $710 billion by 2025.
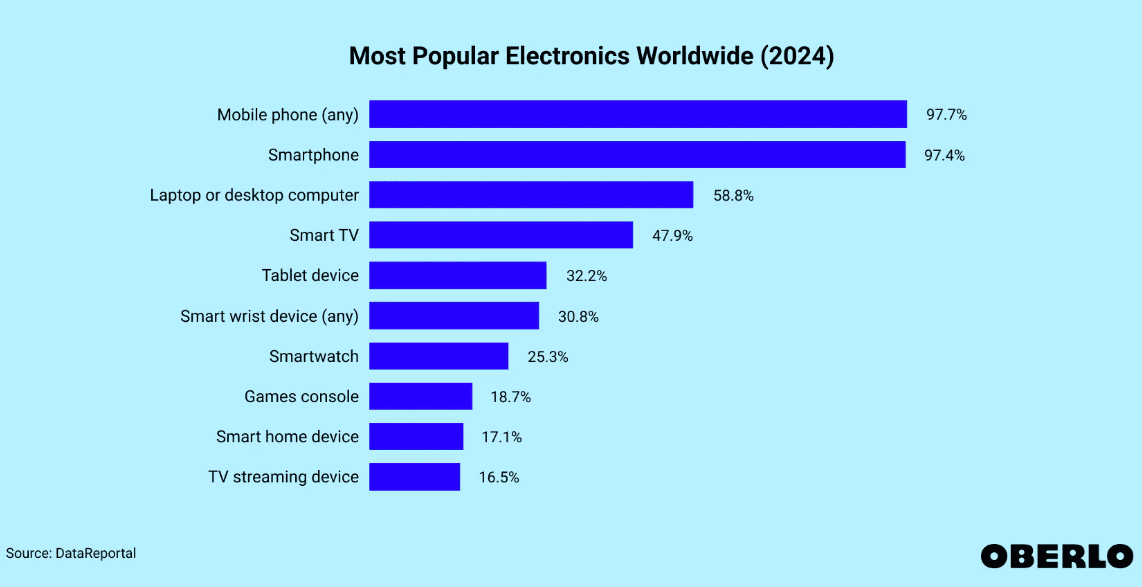
10. Mobile phones are the most popular electronics globally, with nearly 97.7% of consumers owning one.
Source
11. In 2023, users spent an average of 4 hours and 6 minutes a day on their mobile phones, with even higher usage in countries like Indonesia, Brazil, Saudi Arabia, Singapore, and South Korea.
12. Mobile marketing is perfect for targeting millennials and Gen X, with 9 out of 10 in these age groups owning a smartphone.
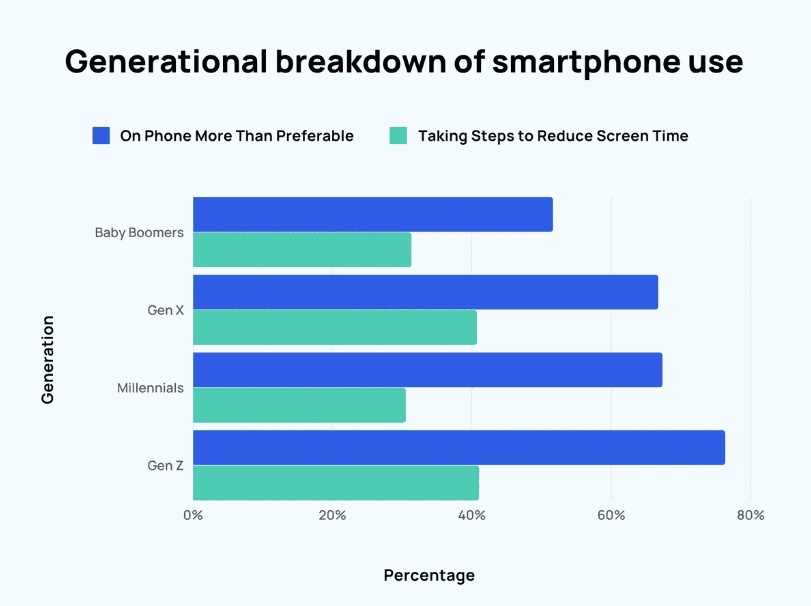
13. About 3 out of 4 Gen Z people say they spend more time on their smartphones than they want to each day. In contrast, just over half of Baby Boomers feel the same. Notably, 24% of Gen Z believe smartphone overuse has become a problem in their lives.
Source
Mobile Usage, Market Share, & Traffic Statistics
Before you create your mobile marketing plan, it’s important to understand how people use mobile devices, their market share, and traffic trends.
These mobile marketing stats will help you get a clear picture of the market and how mobile usage plays a role.
14. Mobile traffic now makes up 68.98% of all digital traffic. Desktops account for about 29.4%, while tablets are a small 1.62%.
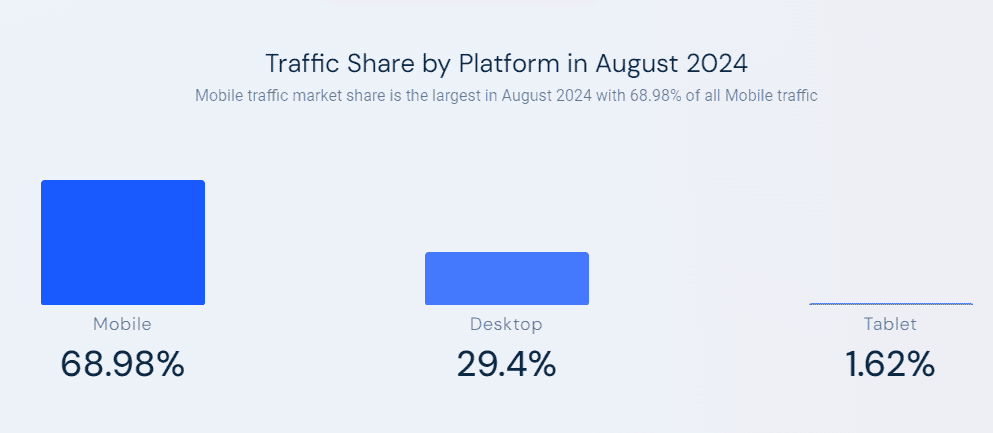
Source
15. In the second quarter of 2024, Samsung led the global smartphone market in shipments, followed by Apple. Xiaomi holds the third spot with nearly 15% of the market.
16. The most popular smartphone app is YouTube, used by 88% of users. Facebook, LinkedIn, and Instagram follow behind.
17. The top 10 countries for smartphone users each have over 70 million active users. China leads with nearly 1.5 times more users than any other country. The US has the highest proportion of its population using smartphones, at 81.6%.
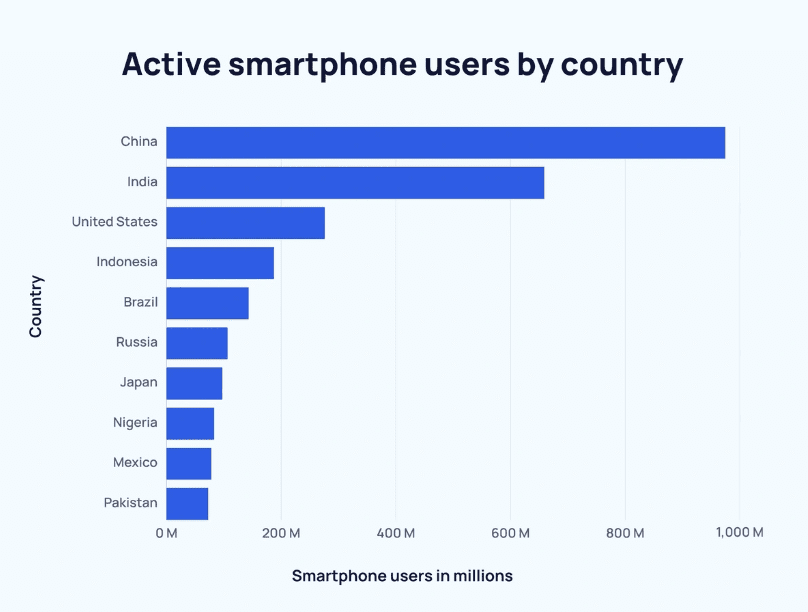
Source
18. The US also leads in mobile advertising spending. China was the second-largest market in 2020, worth $72.2 billion. Other notable markets include Thailand (with a 46% annual growth) and India (at 42%).
19. 80% of men in the US own a smartphone, compared to 75% of women. Women slightly outpace men in owning non-smartphone cell phones by 3%.
20. 94% of the youngest adults (ages 18-29) use smartphones, followed by 89% of 30-49-year-olds, 73% of 50-64-year-olds, and 46% of those aged 65 and up.
21. By 2024, the number of smartphones worldwide is set to top 7 billion. By 2025, 72% of internet users are predicted to use only mobile devices to go online.
22. The two main mobile operating systems are Android and iOS. As of August 2024, Android has 71.67% of the market, while iOS holds 27.73%.
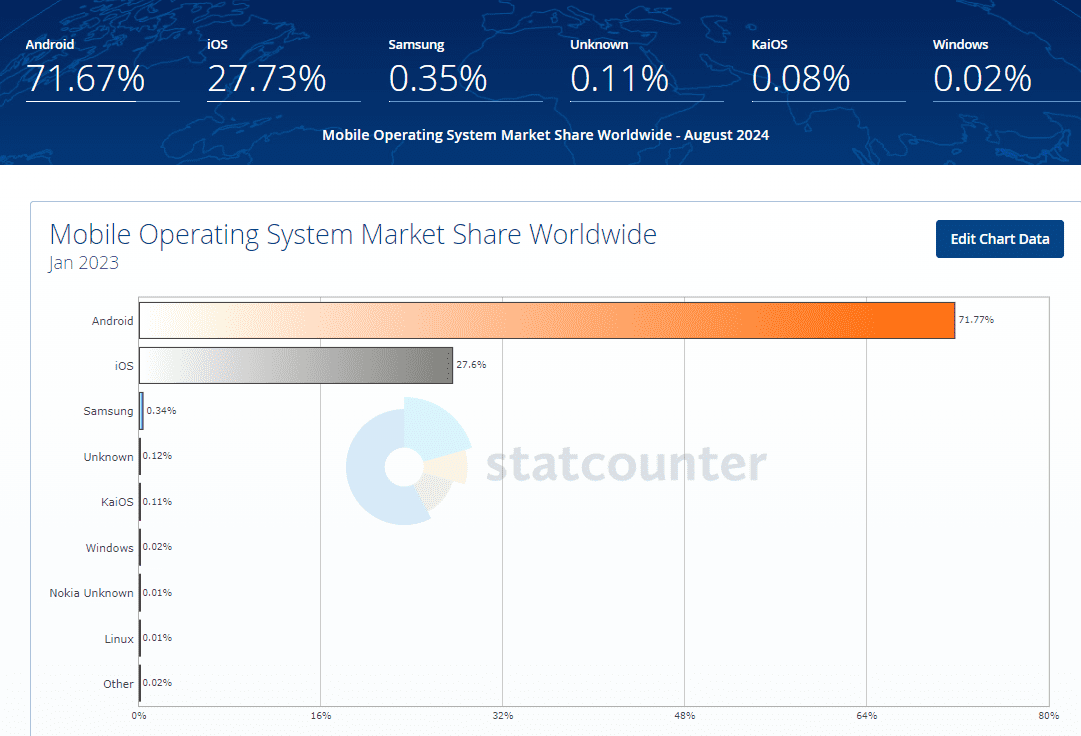
Source
23. In the US, 63% of Google searches are done on mobile devices, with 96% of those searches using Google.
24. 52% of Pay-Per-Click (PPC) ads clicks come from mobile. Not optimizing for mobile could mean missing out on potential business conversions.
25. 47% of people prefer to read emails on smartphones or tablets. 41% of email views (and 75% of Gmail views) come from mobile devices.
Mobile Advertising Statistics
Mobile ads can be a game-changer for your marketing strategy, but if not targeted properly, they can end up costing you more than they should.
Here are some key mobile marketing stats that shed light on ad spending, how consumers react to mobile ads, ad budgets, and more.
26. In 2025, mobile ad spending in the U.S. is predicted to reach $235.67 billion, marking a 12% increase from the previous year.
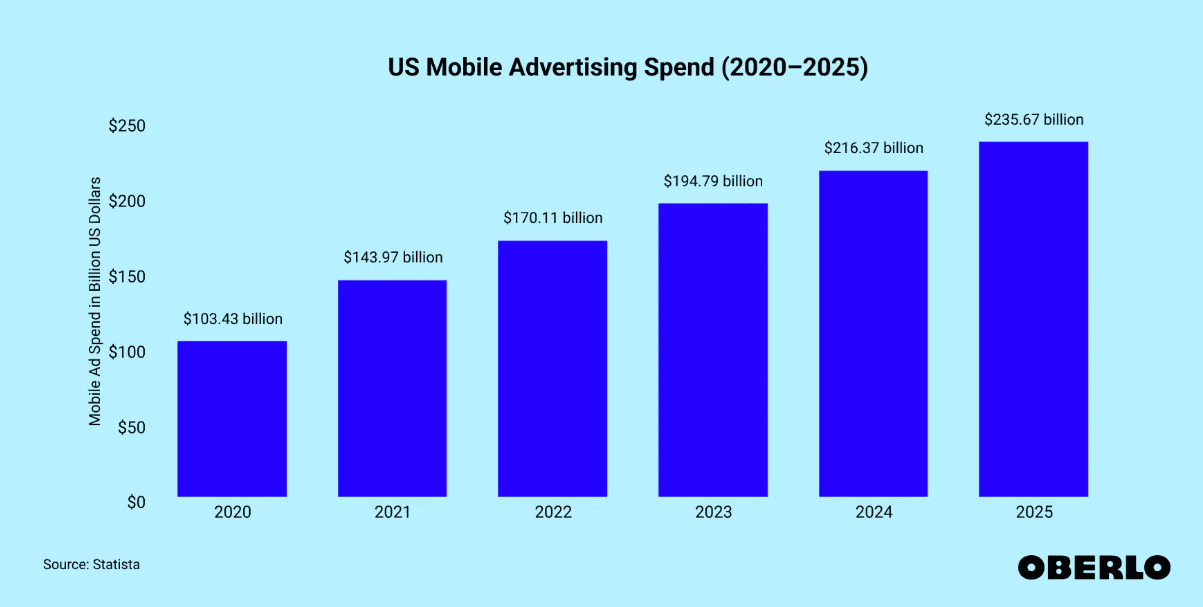
Source
27. Search ads on mobile are expected to reach $113.2 billion by 2027, followed by video ads at $82.2 billion and banner ads at $60.7 billion.
28. There are around 530 million mobile ad-block users and 290 million desktop ad-block users worldwide.
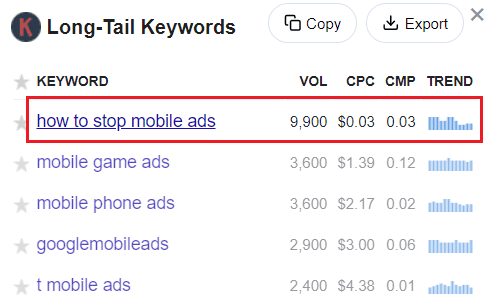
29. According to Keywords Everywhere, every month, 9,900 people search for “how to stop mobile ads” on Google, showing that ad blockers are cutting off a lot of ads. This means you might want to explore other ways to reach your audience.
30. Mobile marketing is booming, with $4 billion in ad spending projected for 2027.
31. U.S. marketers report that 19% of their marketing budget goes to mobile advertising.
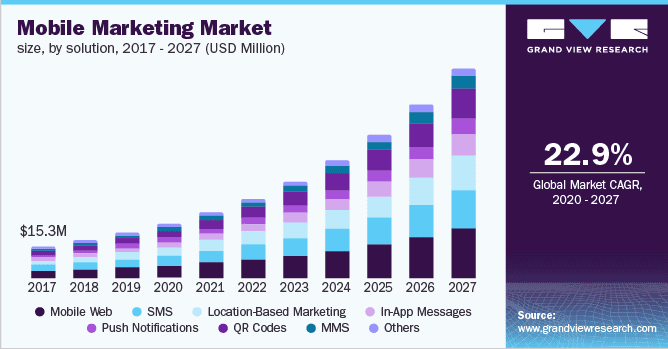
32. The global mobile marketing market is forecasted to reach $337.8 billion by 2027, growing at a rate of 22.9% per year.
Source
33. Native ads perform better on mobile than on desktops, with a click-through rate of 0.38% on mobile compared to 0.16% on desktops.
34. Smartphone ads are more effective, with 91% of smartphone users making or planning a purchase after seeing a relevant ad.
35. U.S. businesses are devoting 11.2% of their marketing budget to mobile marketing, and that number is expected to grow.
36. Videos account for 63% of mobile traffic, with mobile traffic expected to grow 31% annually through 2025, mostly due to video content.
37. Social media ad spending is set to hit $219.6 billion in 2024, with 6.1% growth in total ad spending on social platforms.
38. 65% of online sales are made through mobile devices, highlighting how people love to shop on the go.
39. Mobile users are 40% more likely to make impulse purchases compared to desktop users, thanks to the convenience and personalized experiences offered on mobile.
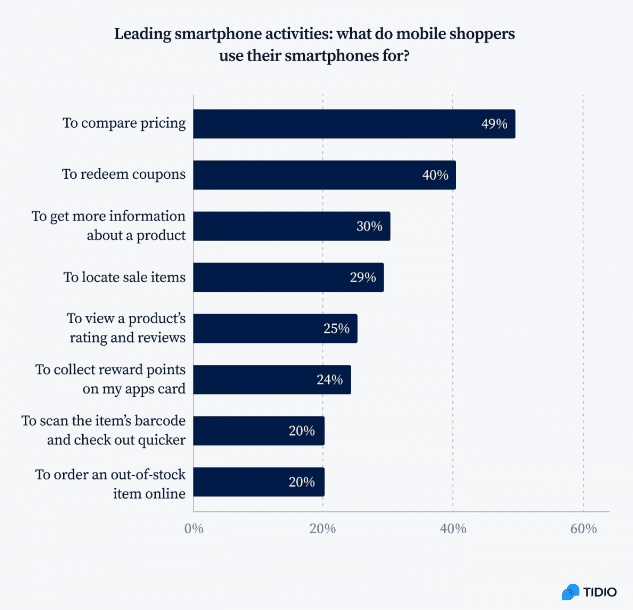
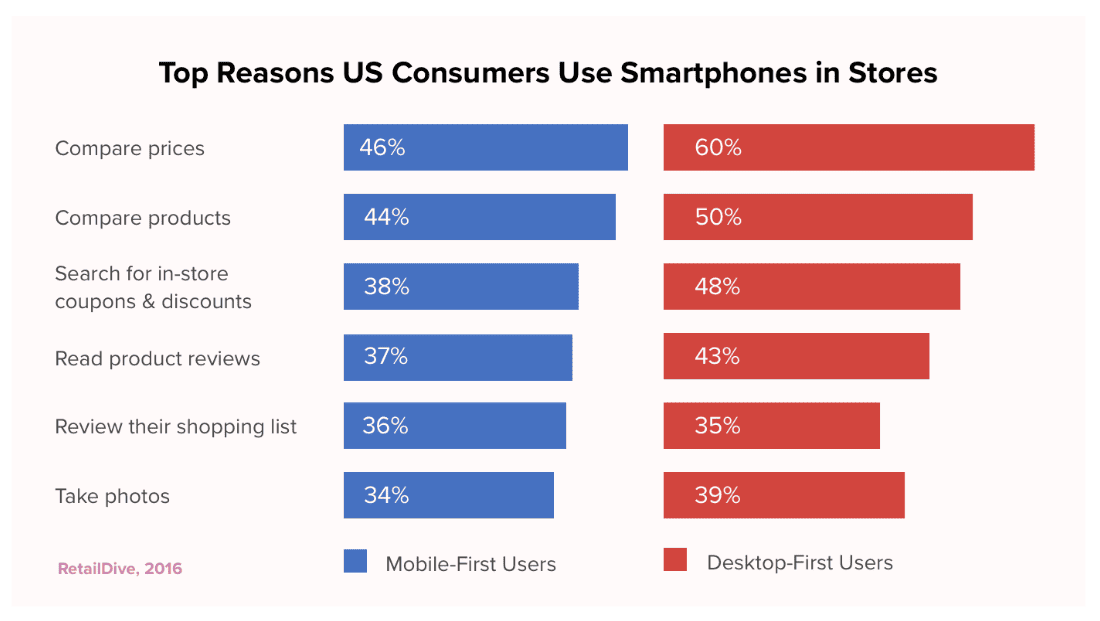
40. 49% of mobile users use their phones to compare prices, while many others look for product reviews or use mobile coupons.
Source
41. Personalization plays a huge role in customer satisfaction, with 69% of shoppers appreciating tailored experiences based on data they’ve shared.
42. 91% of mobile users have made a purchase after seeing a relevant ad, proving how powerful mobile ads can be for businesses.
Mobile and Email Marketing Statistics
These days, smartphones and tablets are at the center of almost everything we do – and that includes emails. To create an email marketing strategy that truly works, it’s crucial to optimize for mobile as well.
Here are some key mobile marketing stats you should know before launching your mobile-friendly email campaign:
43. 35% of business experts check their emails on a mobile device.
44. To boost your email open rates, optimize your emails for mobile. Depending on your audience, 26% to 78% of emails are opened on mobile, according to eMailmonday.
45. 7 out of 10 users will delete emails that don’t display correctly on their phones, and 15% will even unsubscribe. This shows how important it is to optimize for mobile.
46. 73% of companies regularly optimize their emails for mobile, ensuring they don’t miss out on potential customers.
47. Instead of diving into Facebook or Instagram, about 60% of people check their emails first thing in the morning, while only 20% prefer to browse the web.
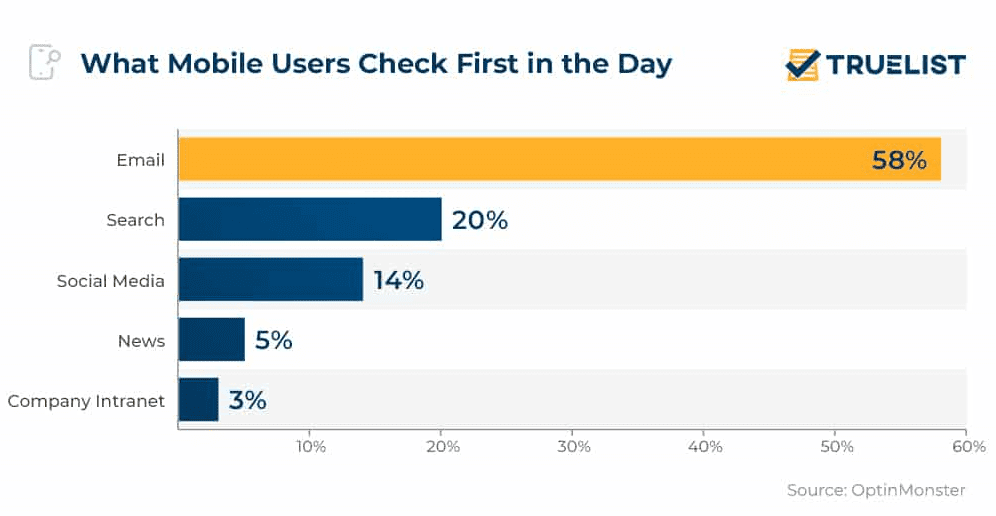
Source
48. MailChimp says that using a mobile-responsive email design can increase unique mobile clicks by 15%.
49. If you’re looking to strengthen your mobile marketing, focus on email. 41% of marketers say email is the most effective way to reach buyers on their mobile devices during holiday shopping, according to Adobe.
50. In the past three years, mobile email opens have nearly doubled, with 99% of people checking their emails daily and 35% of professionals using their mobile phones to do so.
51. Mobile emails are 65% more likely to drive customers to your website.
Mobile Marketing and B2B
In the fast-paced B2B world, mobile is making waves. Even with all the complexities of B2B buying, more buyers are turning to smartphones and mobile’s impact is changing the way B2B purchases are made.
This shift is opening up big opportunities for marketers who know how to tap into it.
Here are some stats that highlight the growing influence of mobile marketing in B2B:
52. Most B2B buyers use their phones for shopping, with 70% reporting a big increase in mobile use over the past few years. And this trend isn’t going anywhere, as 60% expect mobile usage to keep growing.
53. A solid 80% of B2B buyers use mobile at work, showing how much mobile media influences buying decisions.
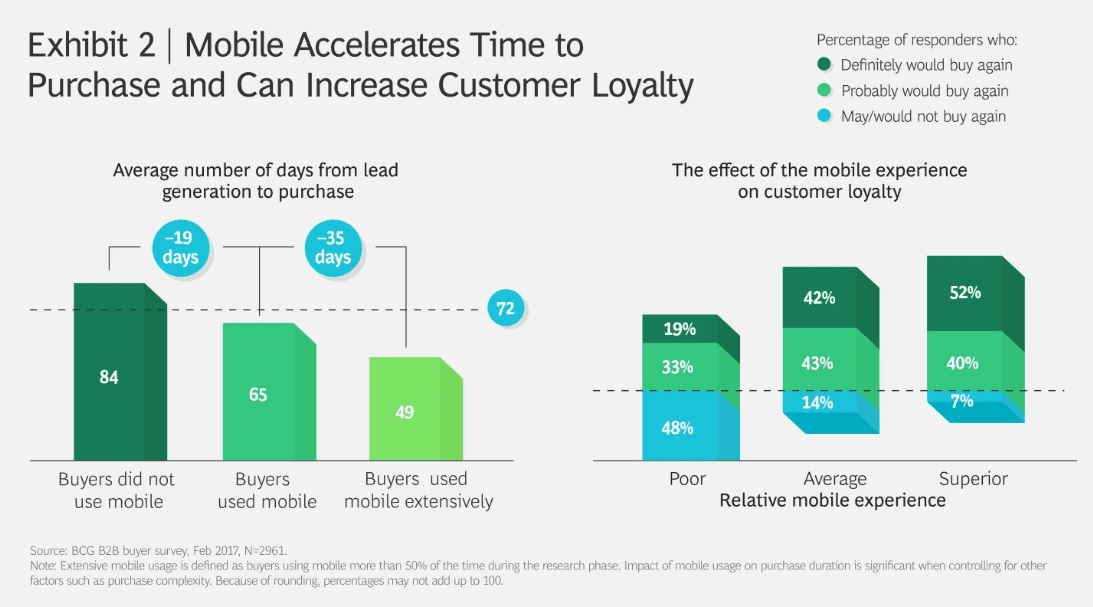
54. 90% of B2B buyers who had a great mobile experience are more likely to purchase from the same vendor again, compared to only 50% of those with a poor mobile experience.
Source
55. B2B businesses have seen a 42% boost in revenue thanks to more mobile queries, leads, traffic, and transactions.
56. Mobile use has sped up B2B purchases by 20%, thanks to better team collaboration and improved efficiency.
57. Many B2B leaders have driven up to 40% of their revenue through mobile phones.
Mobile Marketing and M-Commerce
Mobile ecommerce, or mcommerce, lets you shop right from your smartphone or tablet anytime, anywhere. It’s super handy, and that’s why more and more people are jumping on the mobile shopping bandwagon.
Check out these key mobile marketing stats to see why it’s crucial to make sure your online store is ready for mobile shoppers.
58. About 60% of smartphone users have directly contacted a business from search results, like using the “click to call” option.
59. A survey found that 59% of shoppers consider the ability to buy online an important factor when choosing where to shop.
60. Insider Intelligence predicts that mobile commerce will continue to grow, reaching nearly 9% of retail sales by 2026.
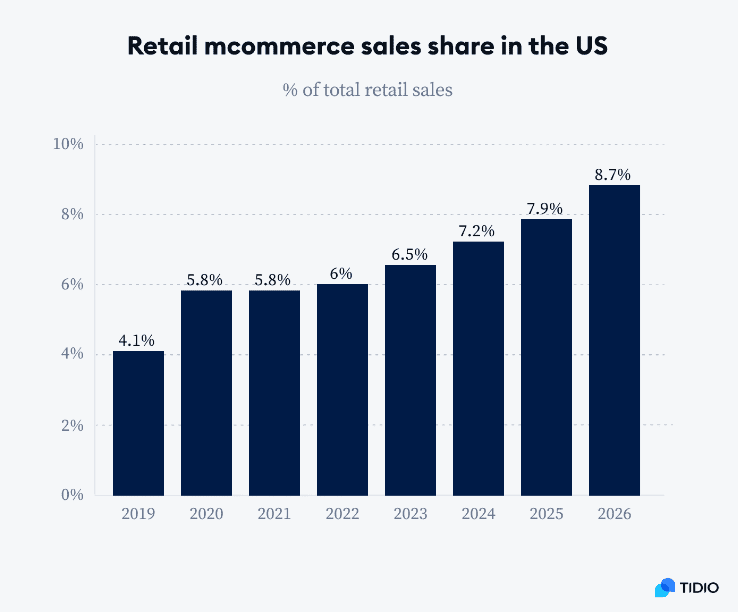
Source
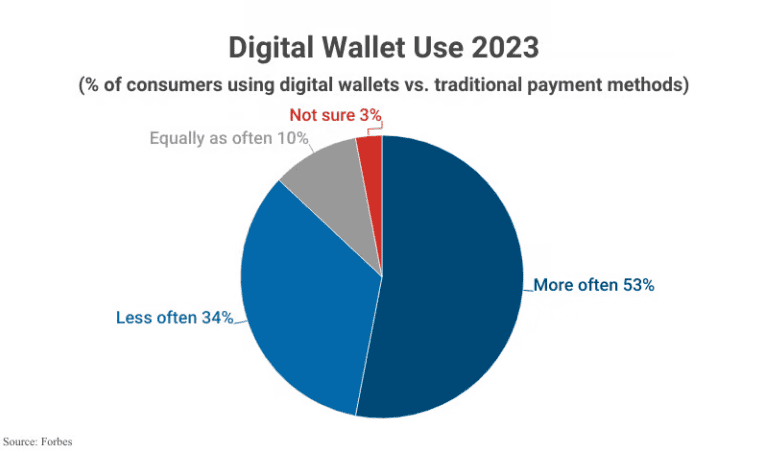
61. In 2024, the average purchase made on a mobile device is $120, thanks to mobile wallets and other payment options. Mobile commerce sales have seen a steady 20% increase from 2023.
62. About 67% of mobile users say that small pages and links are barrier to mobile shopping. Security concerns with mobile payments and data are the second biggest issue, mentioned by 42% of users.
63. Dedicated mobile commerce apps handle 54% of mobile payments, while mobile browsers account for 46%.
64. This year, 70% of mobile purchases were made through apps rather than mobile websites.
Source
65. In the US, around 74% of people use their devices for product research, even when shopping in stores. Shopping apps are the most popular, more so than sports, news, or finance apps.
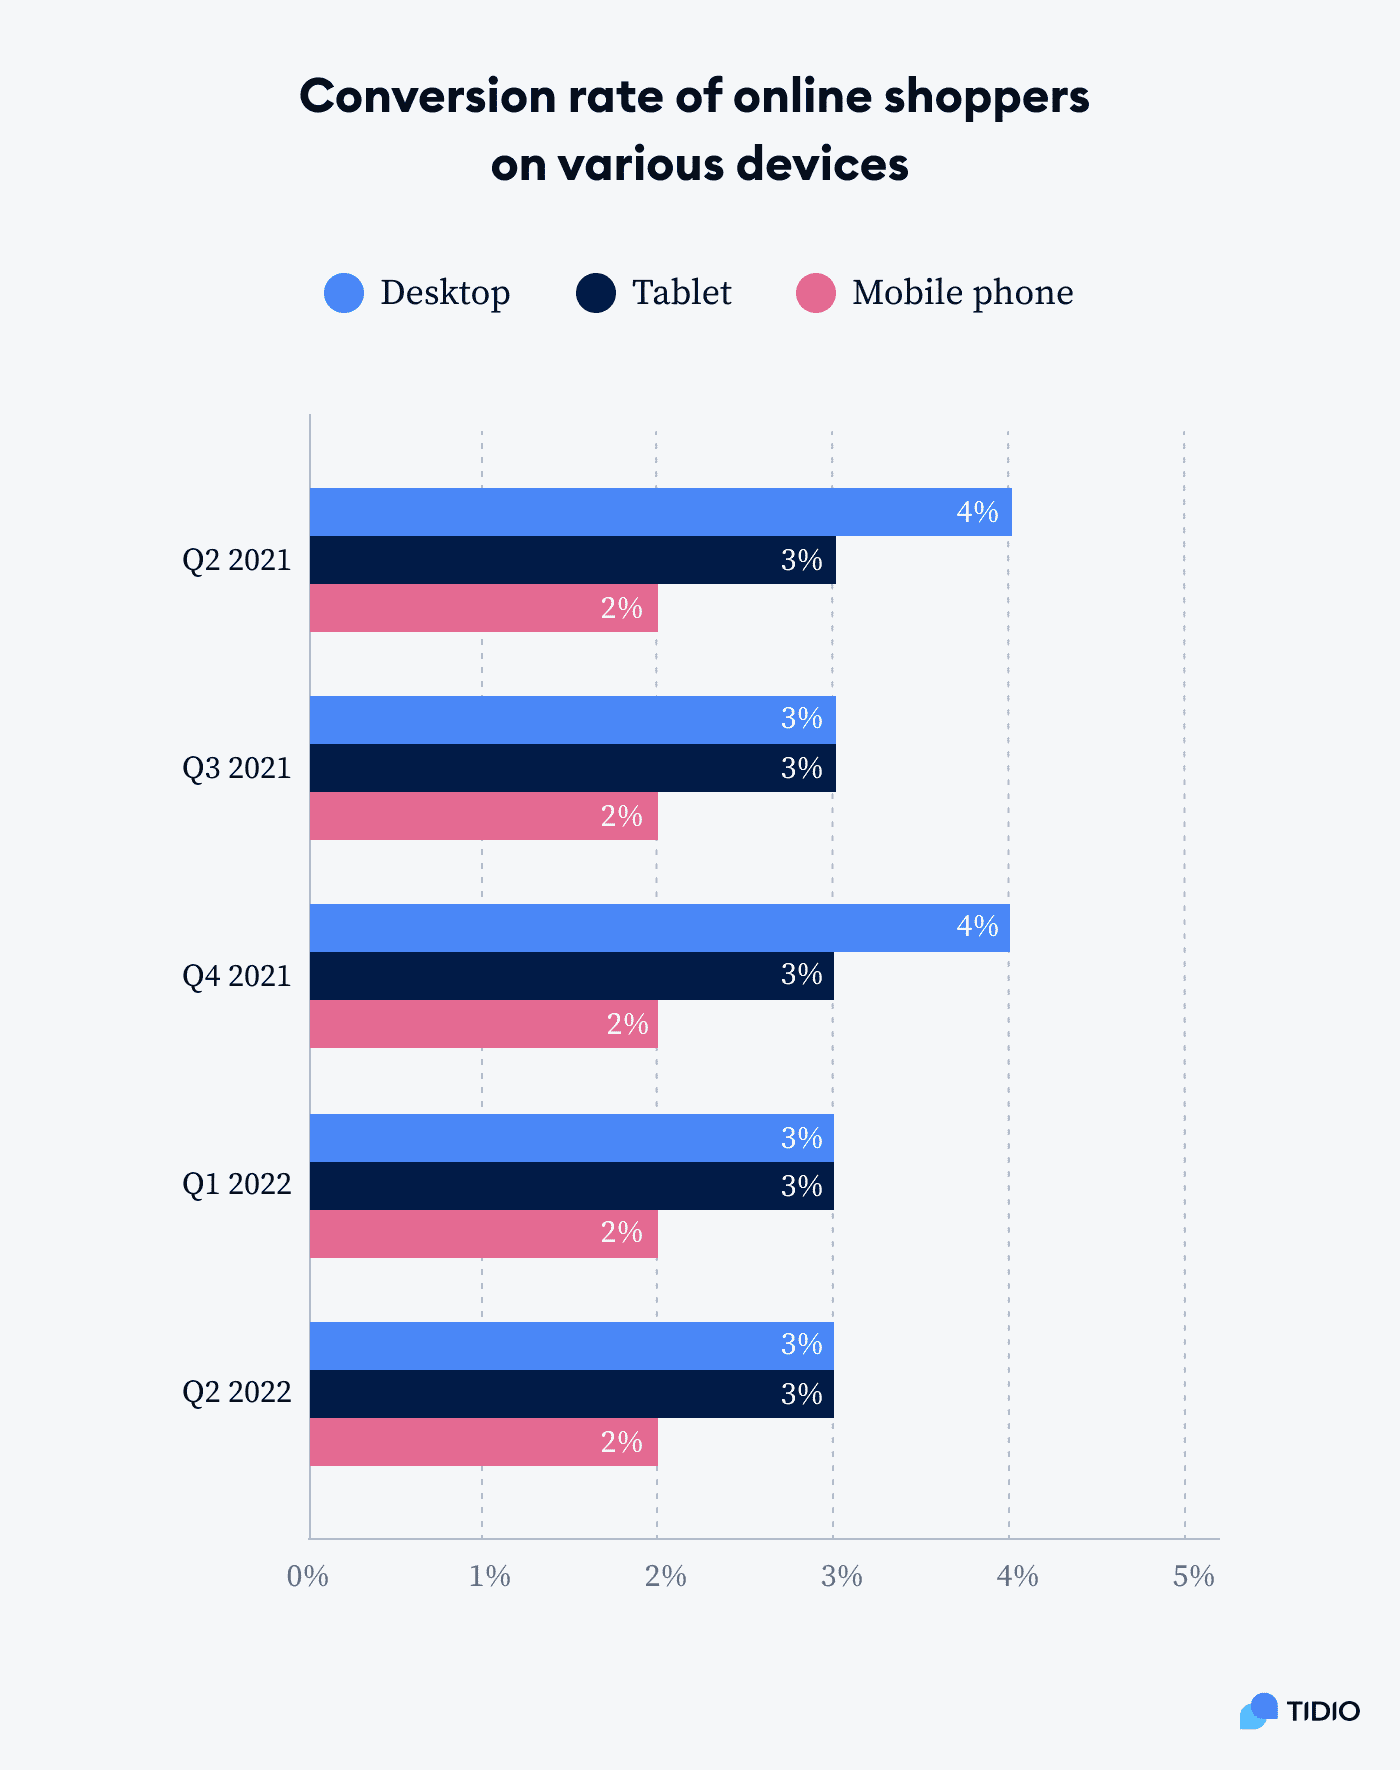
66. Mobile apps had a conversion rate of 3.5% for sales in 2024, much higher than the 2% conversion rate for mobile websites.
67. Nearly 40% of mobile e-commerce purchases were made directly through social media platforms in 2024. About 65% of shoppers bought something because an influencer they follow recommended it.
68. In total, mobile sales saw a 20% increase from the previous year, indicating that more people are shopping using their mobile devices.
69. Social media ads have been effective in boosting e-commerce sales, with a 4% conversion rate from viewers and app users to buyers.
Source
Consumer Behavior on Mobile
Mobile marketing has completely changed how people shop and interact with brands.
Its ease of use, personalized experiences, social influence, and smart location-based targeting have made it easier for consumers to connect with brands and make buying decisions.
Here are some stats that show how mobile devices are shaping consumer behavior:
70. 63% of people are more likely to buy from a business with a mobile site or app that gives helpful product or service recommendations.
71. 32% of shoppers change their minds about a product in-store after looking it up on their smartphone.
72. 96% of consumers research products or services on their smartphones, and 35% actually complete the purchase on their phones.
73. 86% of people use their smartphones while also using other media, and 51% use them while listening to music.
74. The top reasons people shop on their phones are to browse products and find discounts or deals.
Source
75. Over half of shoppers (54%) say they’ve made an in-store purchase after getting a special offer through Mobile Wallet.
76. 67% of smartphone users will likely buy from a business if its mobile site or app is customized to their location.
77. In early 2024, smartphones made up over 75% of retail website visits in the U.S. and generated 66% of online orders.
78. 91% of mobile users have made a purchase after seeing a relevant ad, and 75% say SMS messages prompted them to buy something.
Conclusion
Mobile marketing isn’t just a passing trend—it’s the way forward. As smartphones become a bigger part of our routine lives, businesses that focus on mobile-friendly strategies are setting themselves up for success.
Just look at our mobile marketing stats, they show how people are relying more and more on their phones to shop, research products, and make purchases.
If you’re not investing in mobile marketing now, you could be missing out on a huge opportunity to connect with consumers and increase your sales.