Twitter, now rebranded as X, is still the place where the world’s biggest conversations happen—from trending topics to breaking news. Even with its changes, it remains a key platform for staying updated.
To really make an impact on X, you need to know the latest Twitter stats. Understanding these numbers helps you spot trends, connect better with your audience, and grow your following.
In this article, we’ll break down the latest Twitter stats to show you how to use them to your advantage and boost your presence on the platform.


Top Twitter Statistics
Twitter went public in November 2013 with about 200 million users. Since then, it’s been through big changes, including being bought by Elon Musk for $44 billion and rebranding as X.
Today, X/Twitter is one of the top 6 social networking apps in the U.S.
To get started, here are some key Twitter stats that every marketer should know to understand the platform’s reach and influence.
1. As of 2025, X/Twitter boasts over 650 million active users each month.
2. Every day, more than 200 million people around the globe log in to X/Twitter.
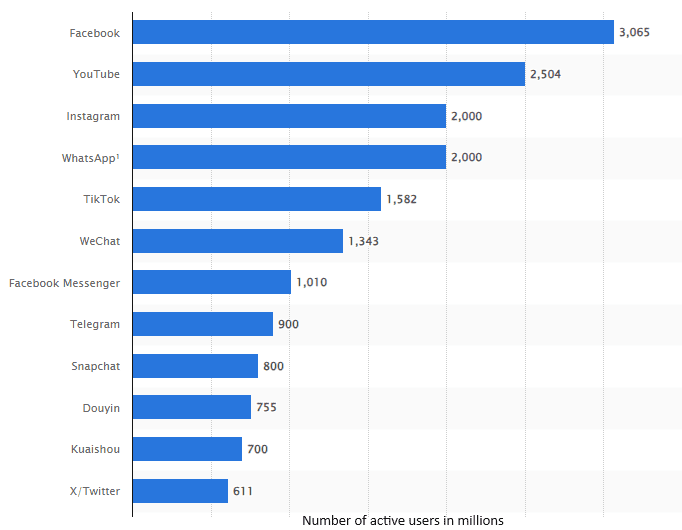
3. Despite being the 12th most popular social network, it trails behind giants like Facebook, Instagram, TikTok, and Snapchat.
Source
4. In 2022, Twitter made $3.4 billion in revenue—which was an 11% drop from the previous year.
5. Interestingly, just 10% of Twitter users are responsible for 92% of all tweets from U.S. users, showing a small but very active group of content creators.
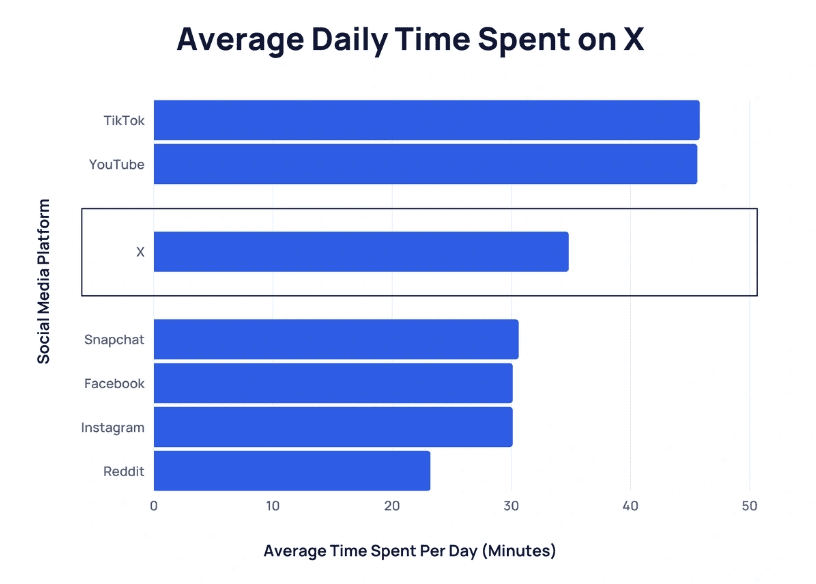
6. The United States leads with 105.42 million Twitter users. On average, a U.S. user spends about 34 minutes a day on the platform.
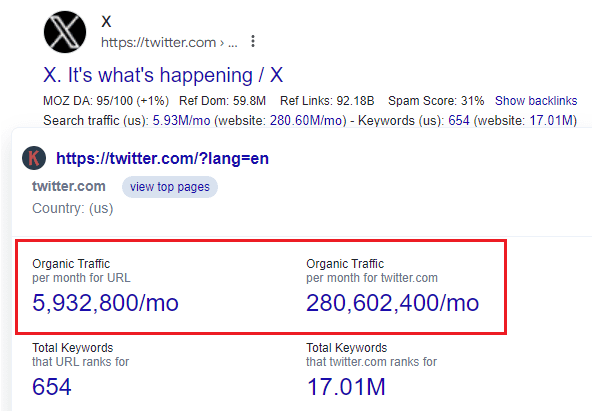
7. According to Keywords Everywhere, Twitter.com attracts 280.60 million visitors each month, with 5.93 million searches related to its URL.
8. Statista noted a 4% drop in monthly active users in 2023, and it’s expected to decrease by another 5% in 2024. Still, over 80% of X’s registered users stay active each month.
9. The platform has the highest share of male users—making up 60.3% of its global audience.
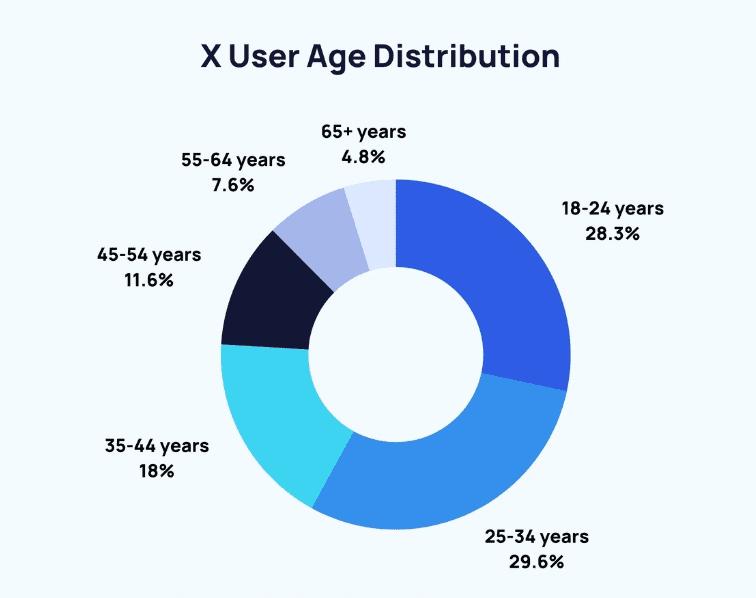
10. Most X users are in the 25 to 34 age range, accounting for 38.5% of the audience.
Source
Twitter Usage Statistics
Understanding how people use Twitter can make your marketing more effective.
Keep reading to discover key stats on how much time users spend on the platform, mobile usage trends, and their content preferences.
This info will help you connect with your audience better and boost your Twitter strategy.
11. On average, X users spend about 31 minutes each day on the platform. According to X, that adds up to 3.6 hours a week, which totals over 15 hours a month.
12. Overall, people spend more than 8 billion minutes on X every day—which is a 10% increase from 2023. Much of this growth is due to increased use of video and Communities, with over 300 million minutes spent in Communities each day.
Source
13. Premium subscribers spend three times more time on X compared to non-subscribers. This means those who pay for extra features stick around longer.
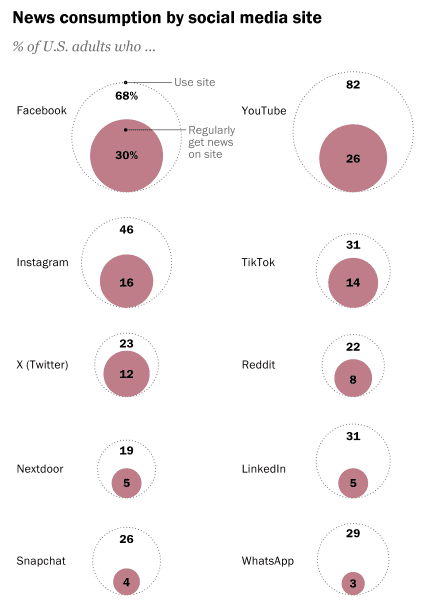
14. X is a major source of news for many users, with more than half of them regularly getting their news from the platform.
15. In the U.S., about 23% of people get news from X, and 12% do so regularly, making it the fifth-most-popular platform for news.
Source
16. About 80% of user sessions include watching videos, and video usage on X is growing by 35% each year, with time spent on videos up by 17%.
17. Immersive video on X has over 100 million daily active users, and more than half of them are Gen Z.
18. Between September 2023 and March 2024, time spent on X via mobile increased by 17%, and daily user time went up by 13%.
19. X is the main social platform for just 5% of Americans aged 12 and older—ranking fifth behind Facebook, Instagram, TikTok, and Snapchat.
Twitter User and Demographics Statistics
To make the most of reaching your target audience on X, it’s crucial to understand who’s using the platform.
Check out these key Twitter stats to get a better grasp of your audience and how to connect with them effectively.
20. About 250 million people visit X every day. While this is a lot smaller compared to Facebook’s 3 billion monthly users, having hundreds of millions of daily visitors is still impressive.
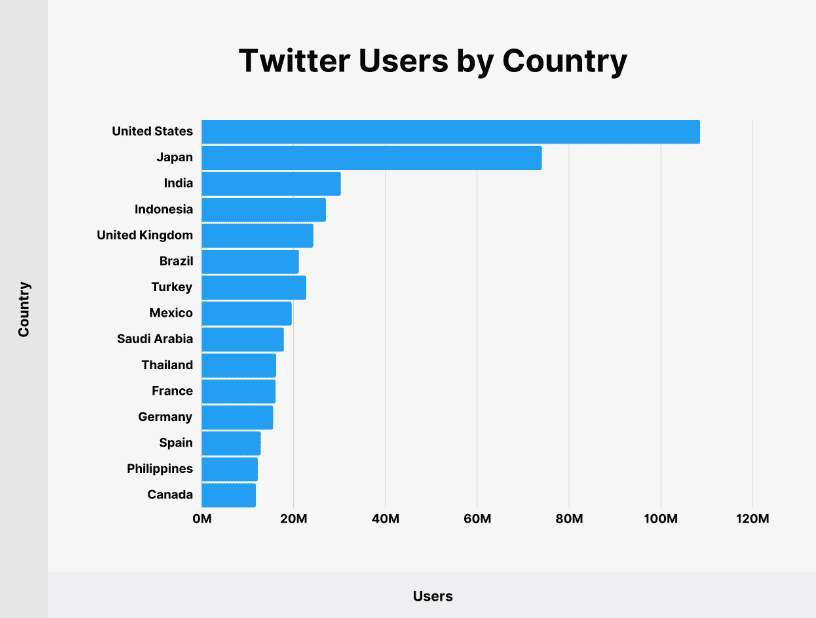
21. In America, X is very popular, with 109.2 million active users, which is nearly a third of the population. Japan and India follow as the second and third largest user bases, with 69.3 and 25.5 million users, respectively.
Source
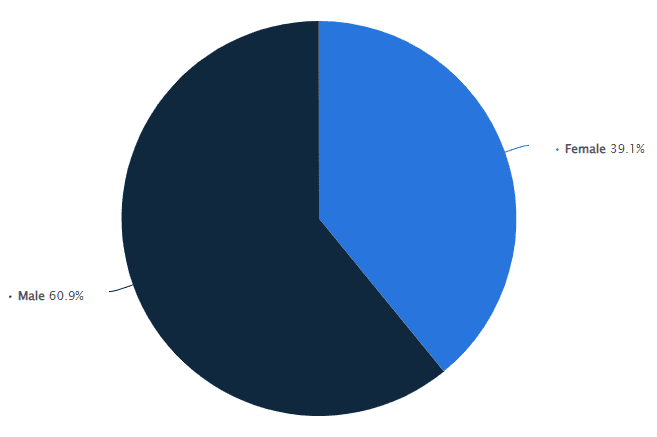
22. As of April 2024, X’s user base is 61% male and 39% female. If your business targets younger men, advertising on X might be a good move.
23. X is most popular with people aged 25 to 34 and less popular among teenagers. In fact, 58.38% of users are between 18 and 34 years old.
Source
24. 29% of Americans with a college degree use X, almost twice as much as those with only a high school education, of whom only 15% use the platform.
25. 26% of Americans living in the suburbs use X, compared to 25% in cities and just 13% in rural areas.
26. There’s a noticeable difference in usage based on political leanings: 26% of left-leaning Americans use X, while only 20% of right-leaning Americans do. This gap is one of the largest among social platforms.
27. Around half of U.S. adults on X (49%) post fewer than five tweets a month. Most of these occasional tweeters, or “lurkers,” are between 30 and 49 years old.
28. 31% of U.S. users see limiting post visibility as a big issue, and 25% are concerned about banning users from the platform.
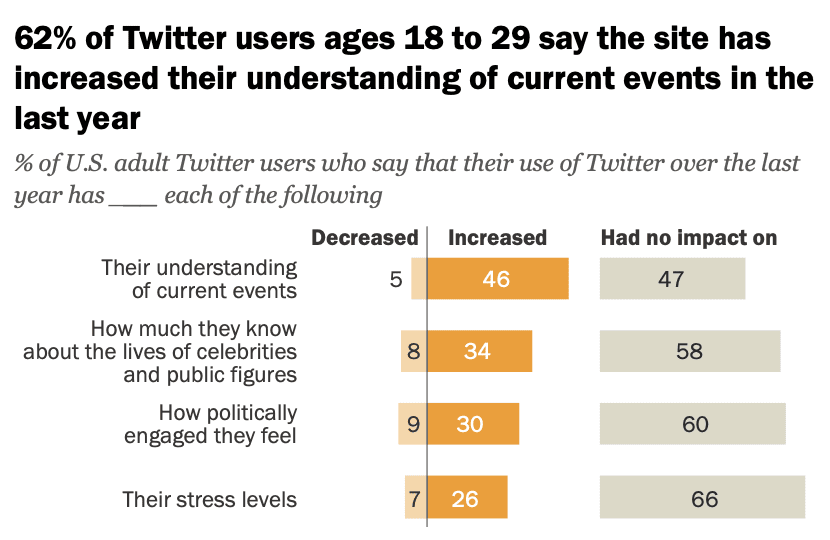
29. Many users in the U.S. say that Twitter has helped them understand current events better in the past year, though about a third feel it has also increased their stress levels.
Source
Twitter Stats for Advertisers
Investing in ads is a smart move to outsmart the algorithms and boost your brand’s visibility. Ads can help you raise awareness, increase engagement, and drive conversions.
These Twitter stats highlight just how powerful their platform can be for running successful ads.
30. X boasts 528.3 million active users each month who see Twitter ads after logging in.
31. People spend 26% more time watching ads on Twitter compared to other social media platforms, showing why so many brands choose to advertise here.
32. Over 100 million users watch vertical videos on X daily, with vertical videos making up 20% of usage on some days. If you’re advertising on Twitter, vertical video ads are a must.
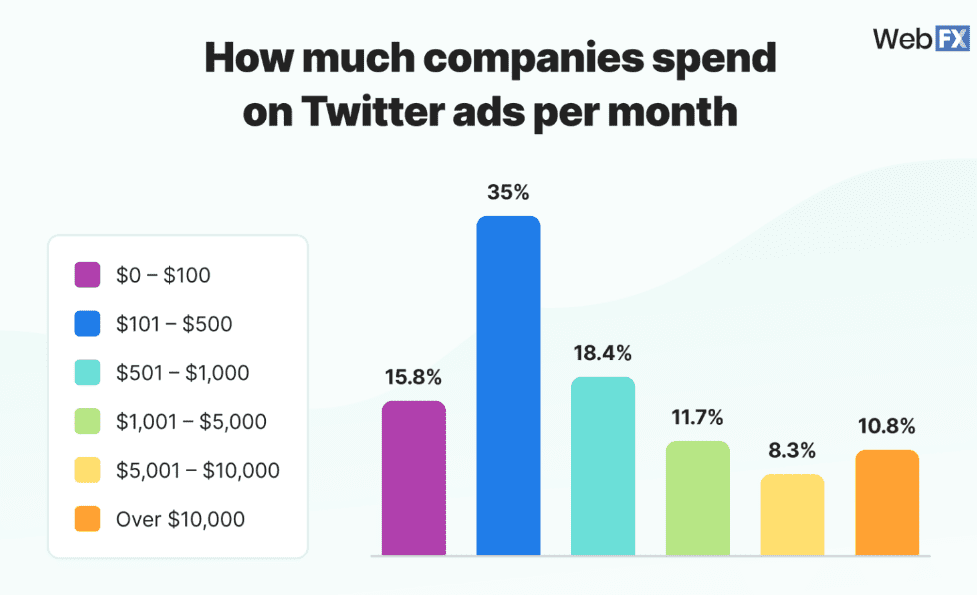
33. About 15% of businesses spend less than $100 on X ads, while over 10% spend more than $10,000 a month.
Source
34. Global ad engagement on Twitter has jumped 35% year-over-year, making it a more attractive option for brands.
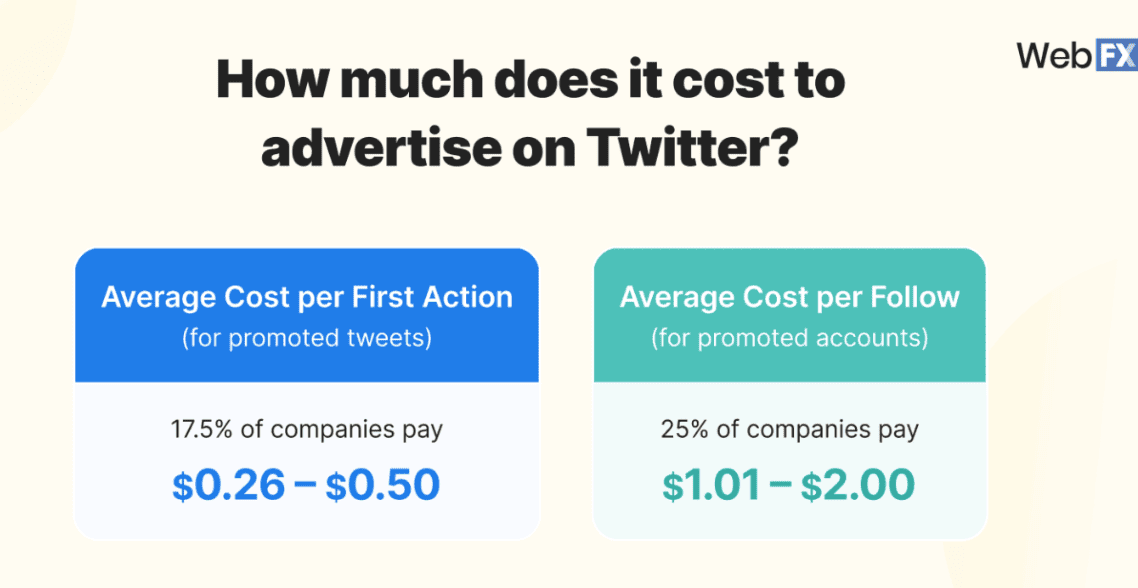
35. On average, X ads cost between $0.26 and $1.50 for each initial action on promoted posts—posts you’ve already shared that get extra visibility as ads.
36. Promoted accounts cost between $0 and $4 per new follower, according to 61% of respondents. These ads show your content to users who don’t follow you yet.
Source
37. On average, businesses set aside 6% to 30% of their overall ad budget for X ads. This depends on your specific needs and the return you see from your campaigns.
38. Twitter has an average click-through rate (CTR) of 0.86%, according to EasyInsights.
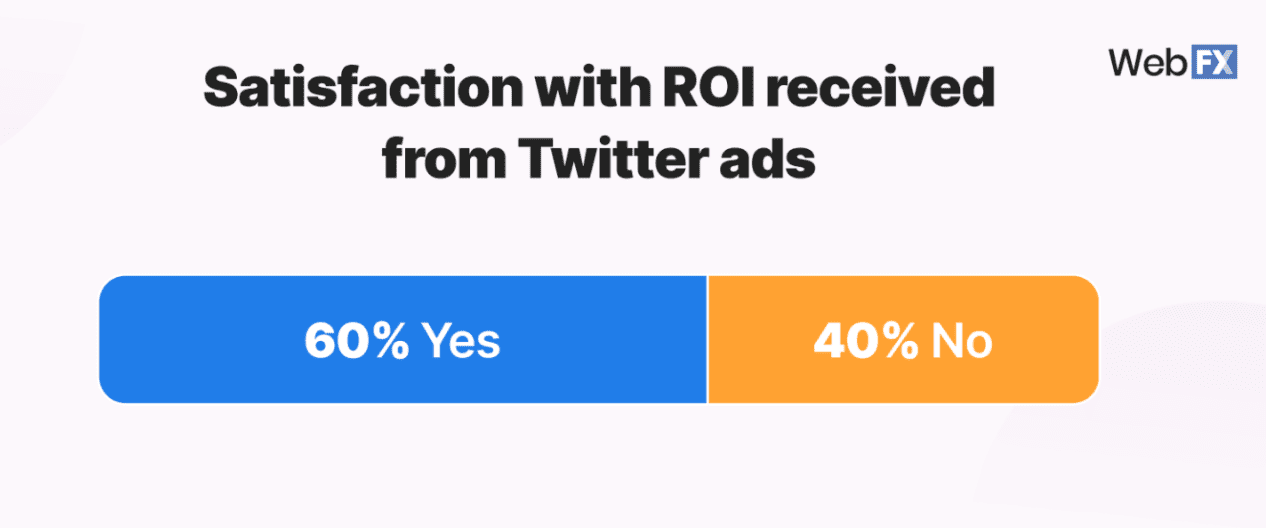
39. 60% of companies are happy with the return on investment (ROI) they get from their X ad campaigns.
Source
Twitter Statistics for Business
Twitter has a lot to offer when it comes to boosting awareness and driving conversions.
If you’re wondering how businesses do on Twitter, these stats show how valuable the platform can be for your social media strategy.
40. According to Content Marketing Institute, 82% of B2B companies use Twitter to share content, promote products, and connect with their audience.
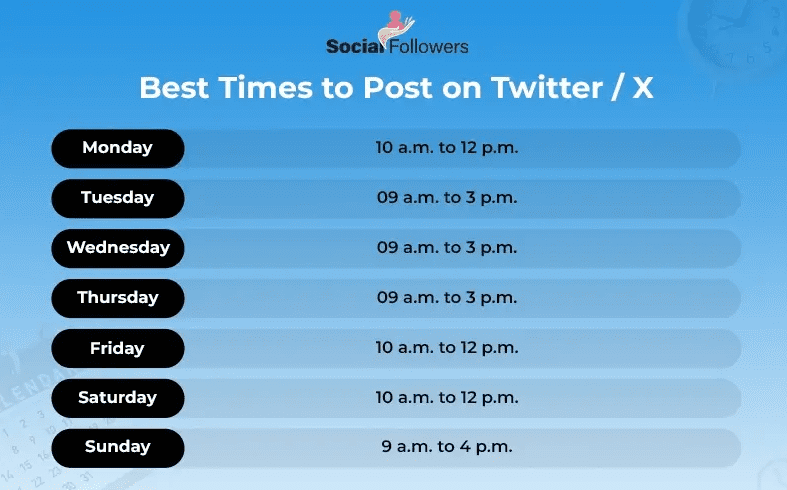
41. The best times to post on Twitter are Mondays and Fridays between 10 a.m. and noon. Tuesdays through Thursdays from 9 a.m. to 3 p.m. are also great times.
Source
42. RivalIQ reports that top brands on X have an engagement rate of around 0.102% and tweet about 3.75 times a week.
43. X says 36% of users are more likely to be the first to buy new products and are twice as likely to make in-app purchases compared to users on other platforms.
44. Twitter users aren’t just there for social connections—79% follow brands to keep up with their latest updates.
45. Twitter is a top platform for brand interaction. Many companies respond quickly with short tweets, and some even have separate accounts for customer support.
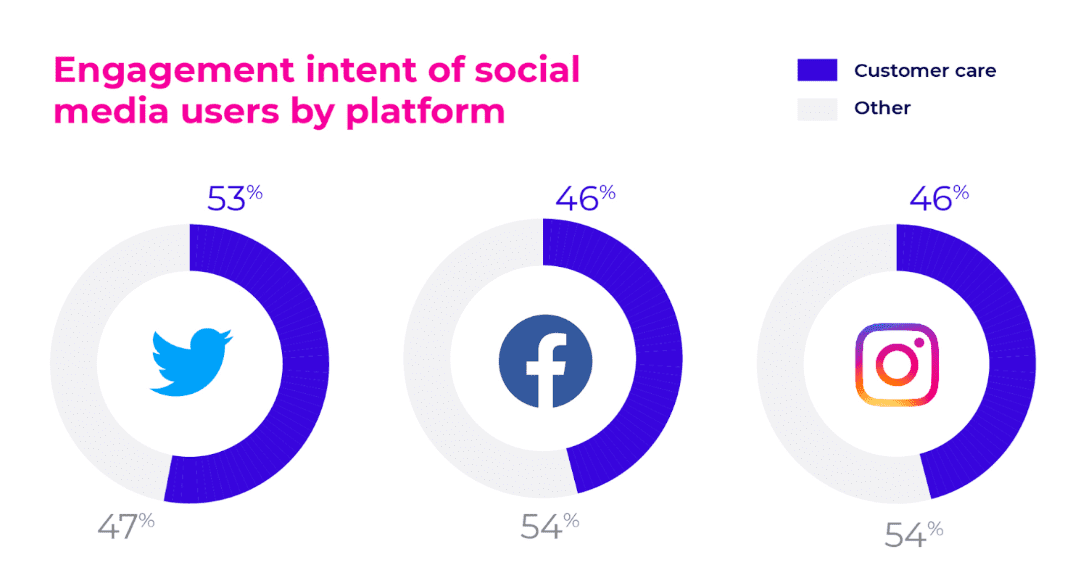
46. Khoros found that 75% of X users have engaged with a brand on the platform, with 53% reaching out for customer care.
Source
47. Twitter claims its platform delivers 40% more ROI compared to other social media channels.
48. X’s data shows brands are 2.3 times more likely to hit their KPIs when launching new products on Twitter.
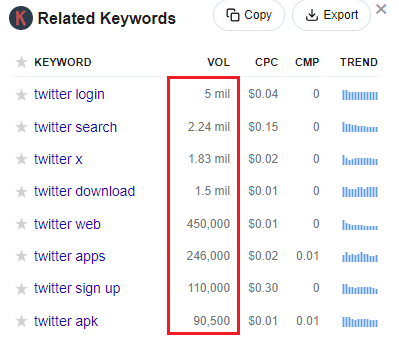
49. Keywords Everywhere notes that “Twitter” and all related terms have a very high search volume on Google, meaning businesses can reach a bigger audience by engaging on this platform.
Twitter Tweet Statistics
Twitter lets businesses and community managers grow their reach, engage with their audience, and boost brand awareness simply by tweeting.
Here are some interesting Twitter stats to help you craft better tweets and increase your chances of getting retweeted.
50. Placing your URL in the middle of your tweet makes it about 26% more likely to be retweeted compared to putting it at the beginning or end.
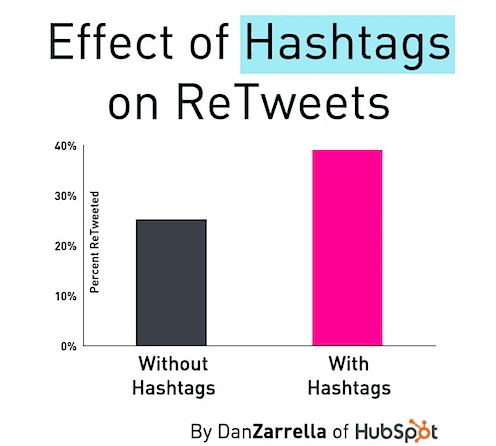
51. Tweets with hashtags are about 33% more likely to be retweeted than those without any hashtags.
52. Direct message campaigns on Twitter get 300% more clicks than email campaigns, but make sure to message the right people.
53. Tweets with just one hashtag get 69% more retweets than those with two hashtags. Too many hashtags can actually reduce interaction.
Source
54. Including images in your tweets makes them 34% more likely to be retweeted. Use Twitter Cards with images to attract more attention and drive traffic to your site.
55. In 2023, the top conversation topics on X were sports, gaming, music, and food, with over 4 billion posts about sports alone.
56. 84% of posts on X are replies, retweets, or quote tweets, while only 15% are original posts.
57. The average engagement rate per tweet is 0.029%, but it varies by industry. For example, sports teams had a rate of 0.072%, and higher education had 0.053%.
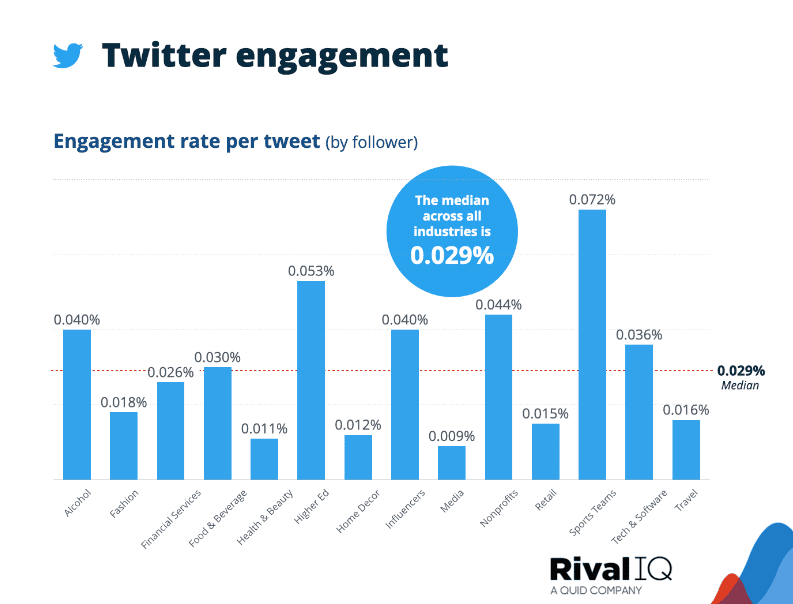
Source
58. Companies tweet an average of 3.31 times a week, according to data from Rival IQ, covering various industries like alcohol, fashion, and travel.
59. The tech sector sees an average engagement rate of 1.34% on X, higher than on other platforms, according to Hootsuite.
60. A solid 90% of Twitter users won’t follow a company after engaging with their marketing campaign.
61. 15% of Twitter users will unfollow a business within 3 weeks if the company doesn’t make a strong effort to engage with them early on.
Conclusion
These X stats highlight just how powerful the platform can be for boosting your brand’s social media presence. While the platform continues to evolve—your success on X depends on how you use the data at your disposal.
By leveraging the insights from these 61 Twitter stats, you can fine-tune your approach, connect more effectively with your audience, and make the most of your Twitter strategy.
Stay informed, adapt your tactics, and watch your brand thrive on this dynamic platform.