Social media isn’t just a tool—it’s a game-changer for businesses, no matter their size. Today how you handle social media marketing can greatly influence your brand’s success. That’s why it’s so crucial to refine your marketing approach and stay informed about current trends and ever-evolving user behaviors.
Now this is where social media marketing statistics prove invaluable. They provide essential insights into your audience’s demographics, interests, and behaviors—helping you to create strategies that build strong connections and achieve your goals effectively.
Below, we’re sharing a list of social media marketing stats you should keep in mind for your strategy in 2025.


What is Social Media Marketing?
Social media marketing (or digital marketing) is all about using social media to promote your products or services, connect with your audience, and get more visitors to your website. It involves creating and sharing the kind of content that works to draw customers.
Here are some key platforms for SMM:
Today social media marketing has totally changed how businesses influence customers. Now companies can share engaging content that encourages interaction and use personal data to make messages feel much more personal.
100+ Must-Know Social Media Marketing Stats for Success in 2025
We’ve made it easy for you by going through hundreds of reports and articles to find the most relevant and up-to-date social media marketing stats. We’ve also organized these stats into different sections so you can quickly find the information that matters most for your strategy.
Key Social Media Marketing Stats
First, let’s start by checking out the key figures that will provide a general overview of the current state of social media marketing.
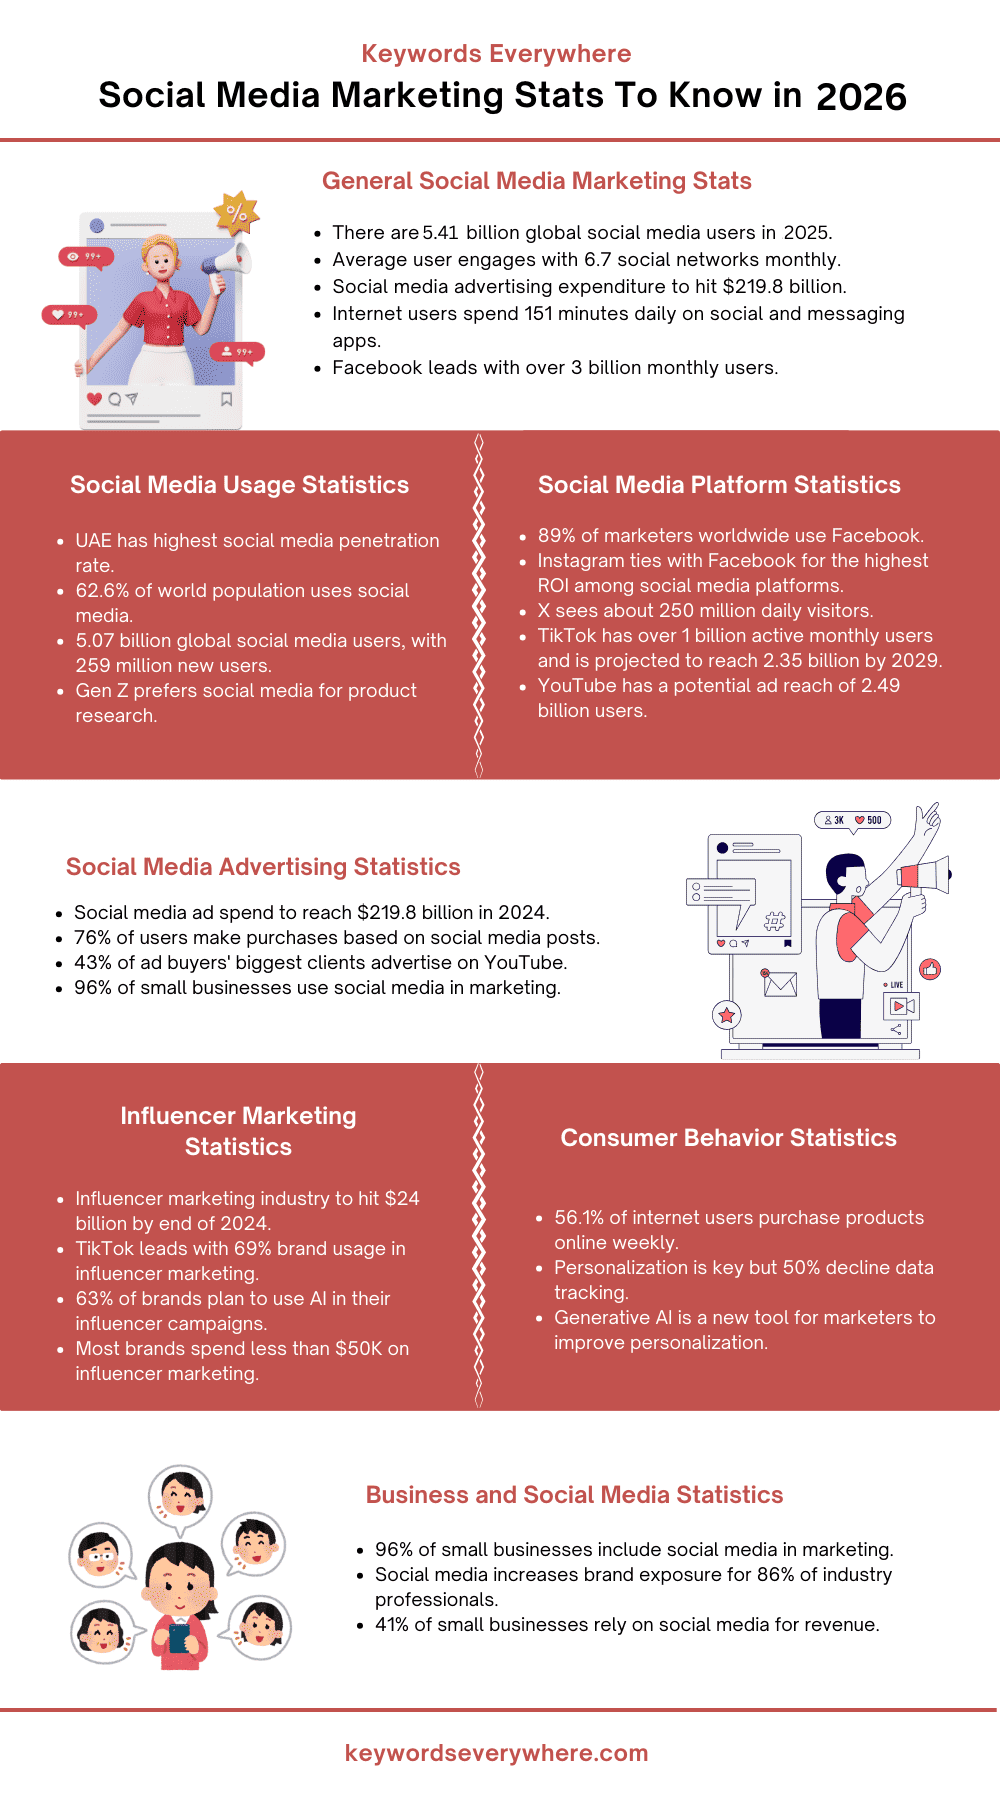
1. As of 2025, there are approx 5.41 billion social media users globally.
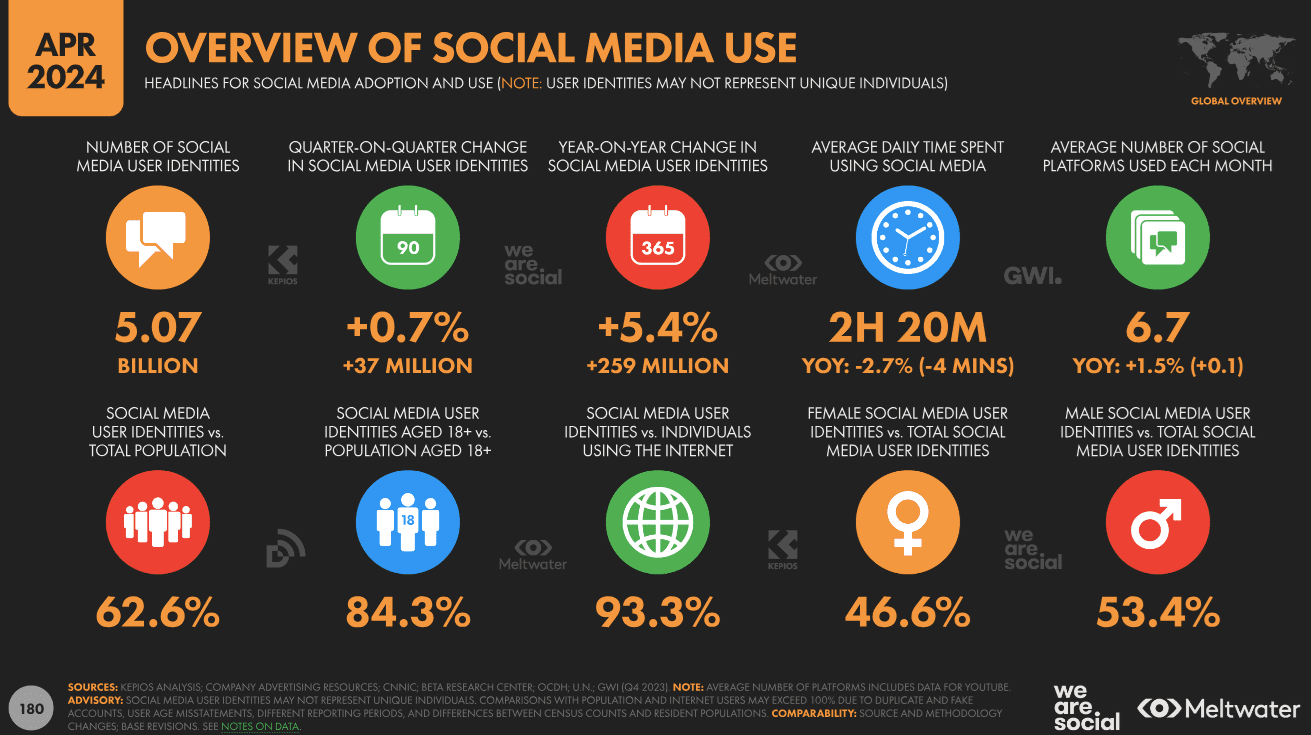
2. On average, each person uses 6.7 different social networks every month.
3. Social media advertising expenditure is about to reach $219.8 billion in 2024. By 2028, mobile advertising alone is projected to account for $255.8 billion of this total.
4. Video content remains highly popular: 44% of shoppers prefer to learn about newly launched products through short video content. 87% of marketers have reported increased sales as a result of video marketing efforts.
5. On average, internet users spend 151 minutes daily on social media and messaging apps.
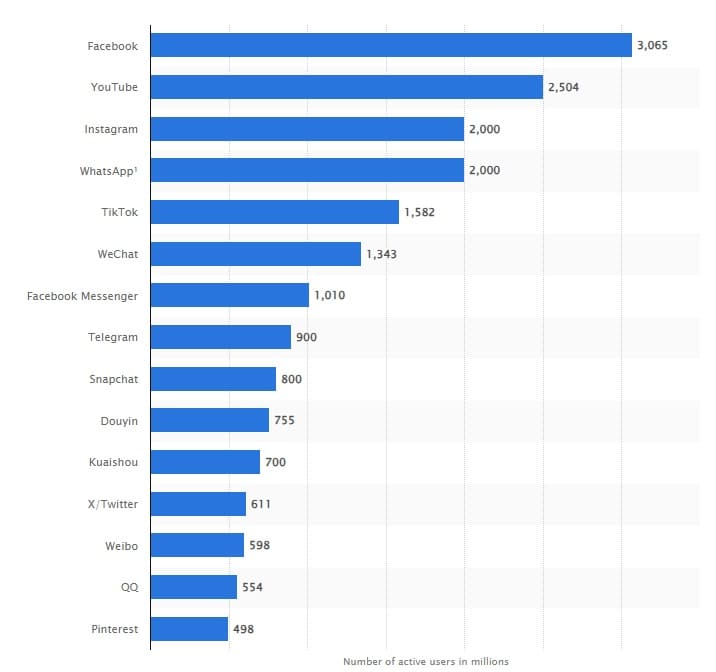
6. Facebook (owned by Meta) is the most popular social network worldwide, with over three billion monthly users.
Source
7. As of January 2024, the UAE had the highest social media penetration rate. Brazil and Morocco were also close to the global average of 62.3%, with penetration rates of 66.3% and 55.7%, respectively.
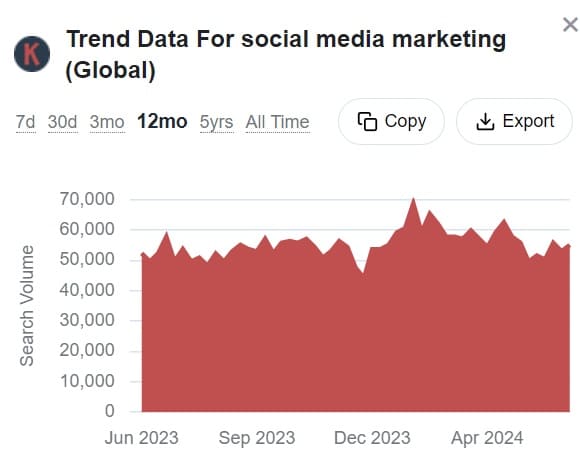
8. Keywords Everywhere data indicates a strong and consistent trend in “social media marketing” over the past year, highlighting its importance as a key marketing strategy.
9. According to Kepios’s analysis, internet users worldwide have surpassed a supermajority, with over two-thirds of the global population now online.
10. By 2027, it is projected that there will be 327 million social media users in the United States.
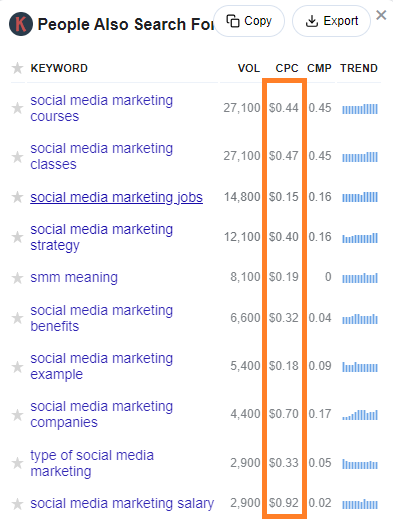
11. According to the Keywords Everywhere widget, the cost-per-click (CPC) for keywords associated with “social media marketing” typically exceeds $0.15, indicating intense competition for ad space.
Social Media Usage Statistics
We all know how much time we spend on social media (just check your screen time data).
Let’s dive into some social media usage stats to see how deep this engagement goes.
12. More than half of the world’s population now uses social media, accounting for 62.6%.
13. 5.07 billion people globally use social media—with 259 million new users joining within the last year.
14. There are 302 million social media users in the United States.
Source
15. It is projected that global social media users will reach 6 billion by 2027.
16. 99% of social media users connect via a tablet or smartphone, with 78% using only their phones.
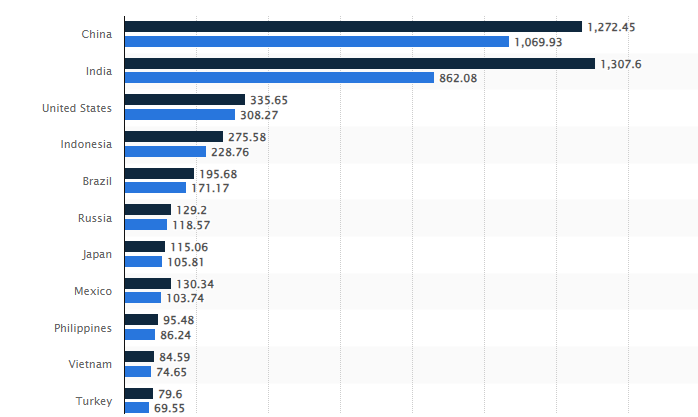
17. Nigeria leads in global social media use, with its citizens spending over four hours daily on social networks—well above the global average of 2 hours and 27 minutes.
18. Social network penetration in North America is at 74%, while the global average stands at 59%.
19. Gen Z is most inclined to socialize through digital channels, surpassing other age groups worldwide.
20. Social networks have become the primary choice for researching potential purchases among internet users aged 16 to 24.
Source
Social Media Advertising Statistics
As the organic reach on social media declines, using paid ads is now crucial to reach your audience. Let’s explore these social advertising stats to help boost your strategy and connect better with your target customers.
21. The total spending on social media advertising is about to reach $219.8 billion in 2024.
22. 77% of small businesses use social media to engage with their customers.
23. Total advertising expenditure is expected to grow by 6.1% in 2024.
24. Social media advertising comprises 28.8% of all digital advertising expenditure.
25. Businesses allocate about 8.7% of their total revenue to their advertising budget.
Source
26. 76% of users have made a purchase based on things they saw on social media.
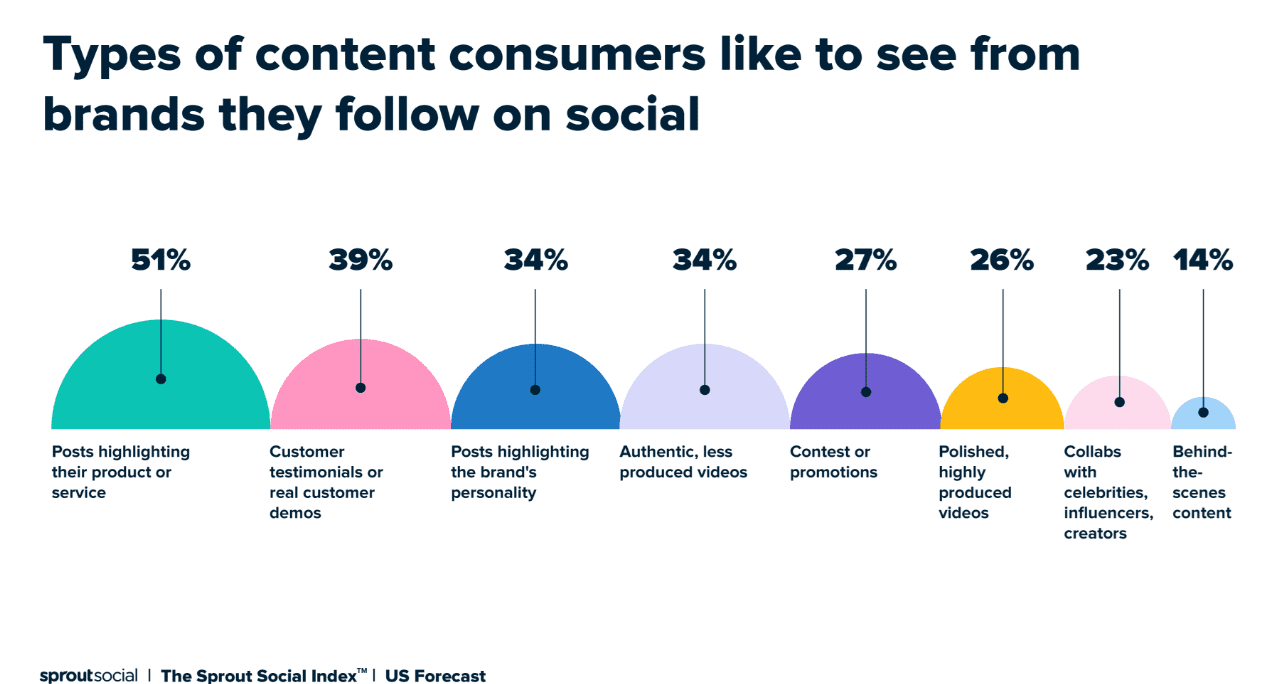
27. 22% of people use social media to view content from their favorite brands.
28. 26% of people use social media to find products they want to buy.
29. 27% of people use social media to find inspiration for activities and purchases.
Social Media Platform Statistics
The best place to get stats on the biggest social media platforms is from the companies’ own reports and announcements. This way, you’ll know what’s working and what’s not. We’ve sorted through a number of platforms to get you the most important social media statistics. Let’s dive into these one by one:
Facebook Statistics
Facebook is the most-used platform—according to the monthly active user numbers that Meta shares in its quarterly earnings reports. Deciding if your brand should focus on Facebook depends on your specific Facebook metrics. The following statistics can provide more insight:
30. 89% of marketers worldwide use Facebook.
31. Facebook has 2 billion daily active users.
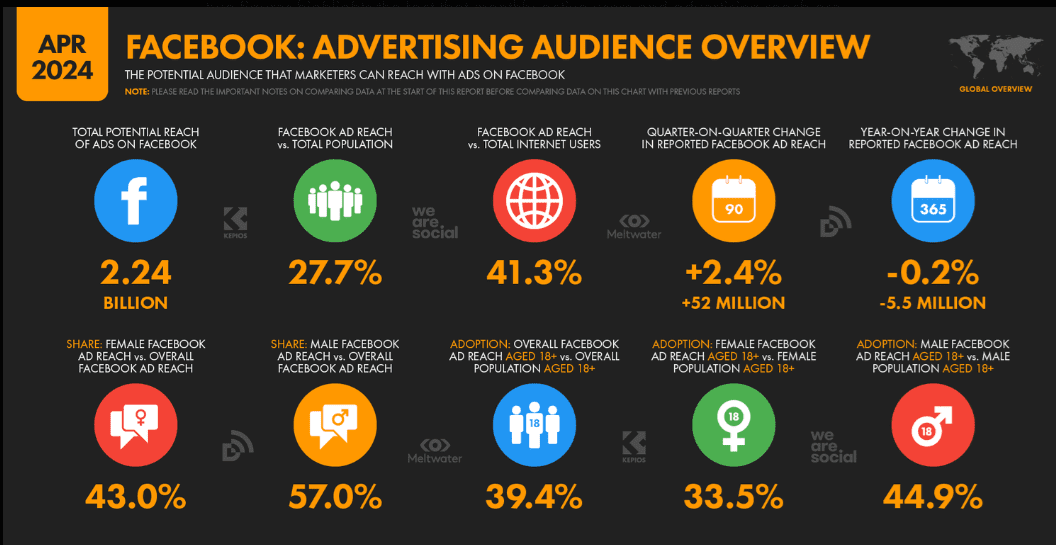
32. Facebook has now more than 3 billion monthly active users globally.
33. An average American spends about 31 minutes daily on Facebook.
34. Keywords Everywhere reports that Facebook ranks for 54.08 million keywords, with 730.89 million monthly organic website visits and 10.35 million monthly organic URL visits.
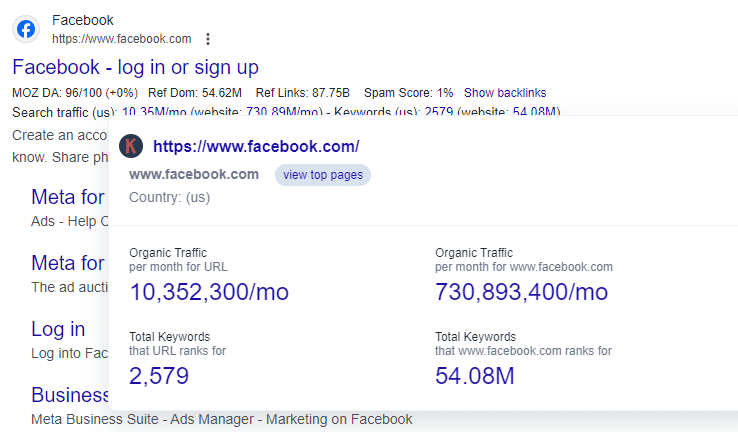
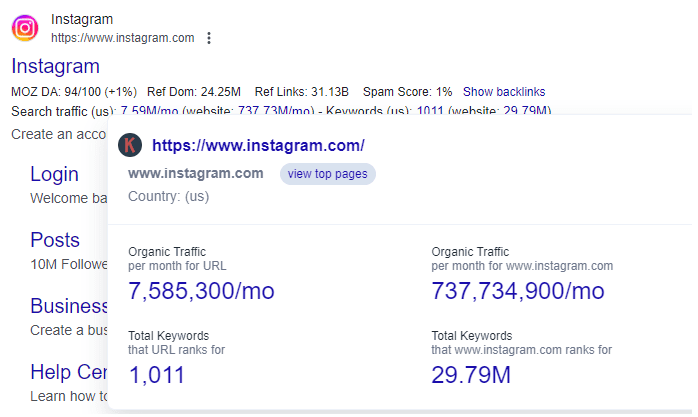
35. Facebook has a domain authority score of 94/100, indicating its strong likelihood to rank in search engine results.
36. Meta generated $117 billion in total revenue.
37. Based on Facebook gender data, 56.3% of users are male and 43.7% are female.
38. Almost a quarter of Facebook users in the US are between 25-34 years old.
39. 31% of all posts made by Facebook pages are photos and 18% are videos.
Source
Instagram Statistics
Instagram is another great platform to amp your brand visibility and launch new products. Almost 130 million users on Instagram engage with shopping posts every month. It also lets you showcase your brand and products in a genuine, approachable manner—without pushing hard sales to your audience. Check out these key Instagram stats:
40. Instagram ties with Facebook for the highest ROI among social media platforms.
41. 80% of marketers worldwide use Instagram to advertise their business.
42. GWI’s latest data shows that Instagram has strengthened its position as the top affinity-ranked platform, with 1 in 6 working-age internet users worldwide considering it their favorite social platform.
43. Keywords Everywhere data reveals that Instagram ranks for 29.79 million keywords, with a monthly organic traffic of 737.73 million.
44. Instagram boasts 2 billion monthly active users.
45. There are 143 million Instagram users in the United States.
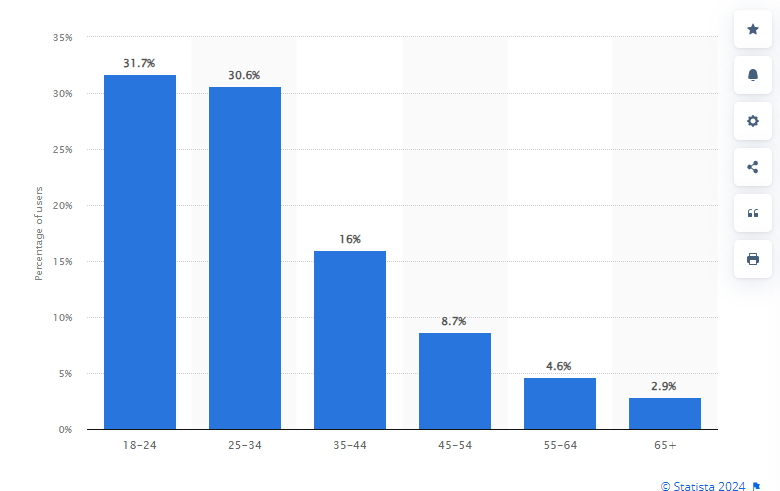
46. 27.4% of US Instagrammers are between 25 and 34 years old.
47. Globally, 61.1% of Instagram users are aged 18-34 and predominantly male.
Source
48. Instagram Threads has 15.36 million active users at present.
49. Instagram Reels typically receive more likes and saves than regular posts, but fewer comments.
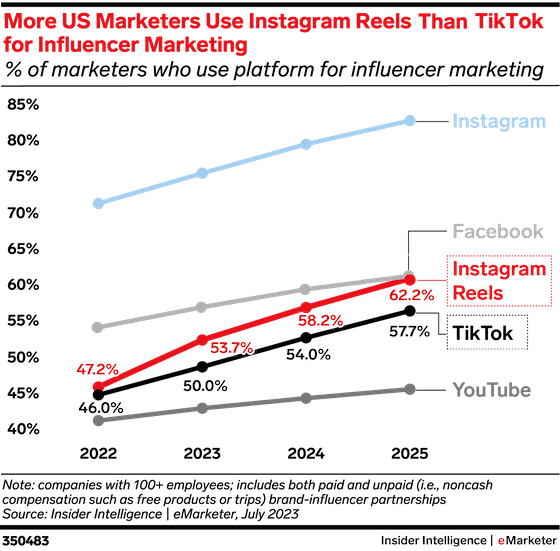
50. This year, 53.7% of marketers in the United States plan to use Instagram Reels for influencer marketing.
Source
X (formerly Twitter) Statistics
There have been quite a few shake-ups at X (formerly Twitter) over the past 18 months. So what’s the scoop now? These freshly updated X stats reveal that the platform holds unique opportunities for brands – especially if you really know your audience.
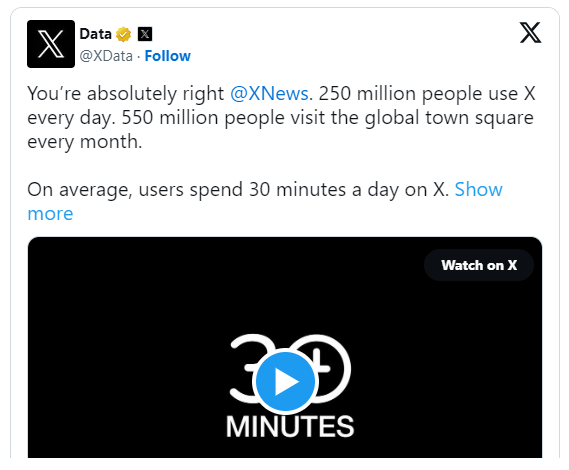
51. X sees about 250 million daily visitors and has 528.3 million monetizable monthly active users.
52. The average user spends about 30 minutes every day on X.
Source
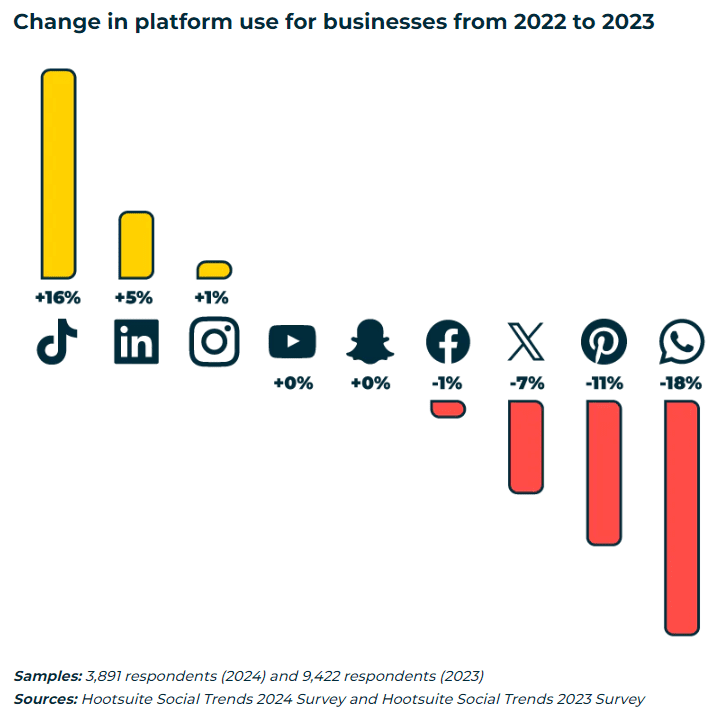
53. 66% of brands are present on X, but there was a 7% decline in brand usage in 2024.
54. According to Pew Research, X ranks as the 9th most popular social platform in the United States.
55. 42% of American X users are between 18 and 29 years old.
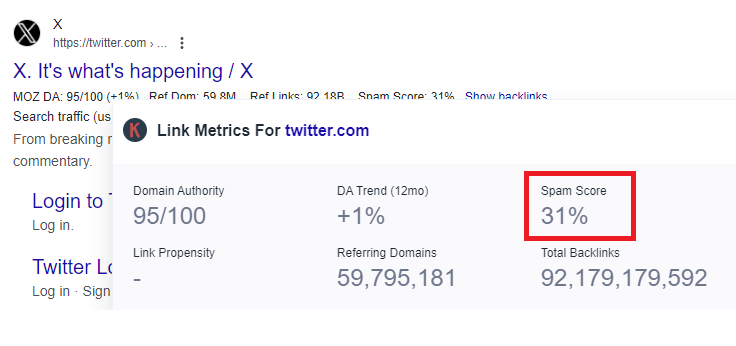
56. Keywords Everywhere data shows that X has a spam score of 31%, which is much higher than platforms like Facebook and Instagram (1%).
57. 26% of American men use X, compared to 19% of women.
58. Globally, 60.9% of X users are male, making it the social network with the highest male users.
59. 80% of X user sessions involve watching video, and Immersive video on X has over 100 million daily active users.
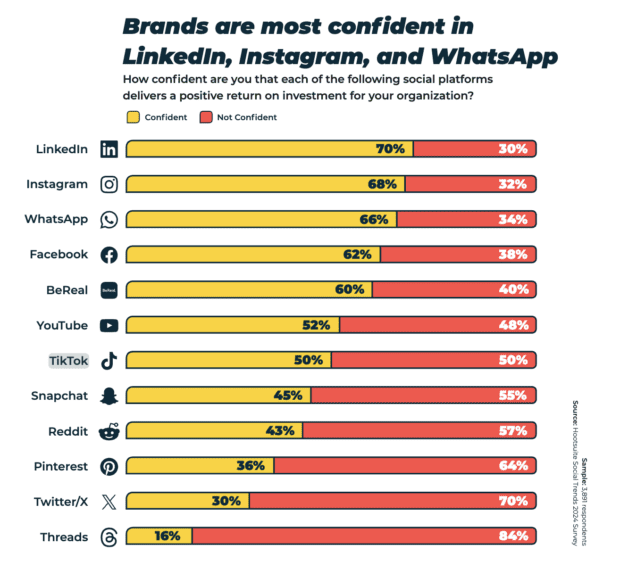
60. Only 30% of social marketers are confident they get positive ROI from X.
Source
TikTok Statistics
TikTok has totally reinvented itself as a must-have digital platform for brands. With its passionate fanbase, explosive growth, and sky-high usage—it’s a goldmine for early adopters. Here are some fascinating TikTok stats to keep in mind:
61. TikTok has now over 1 billion active monthly users and is projected to reach over 2.35 billion users by 2029.
62. The United States leads with 150 million TikTok users.
63. Users spend an average of 45.3 minutes daily on TikTok.
64. Women make up 49.2% and men 50.8% of TikTok users.
65. More than 70% of TikTok users in the US are aged 18-34.
66. The largest demographic on TikTok is females aged 18-24, making up 18.2%.
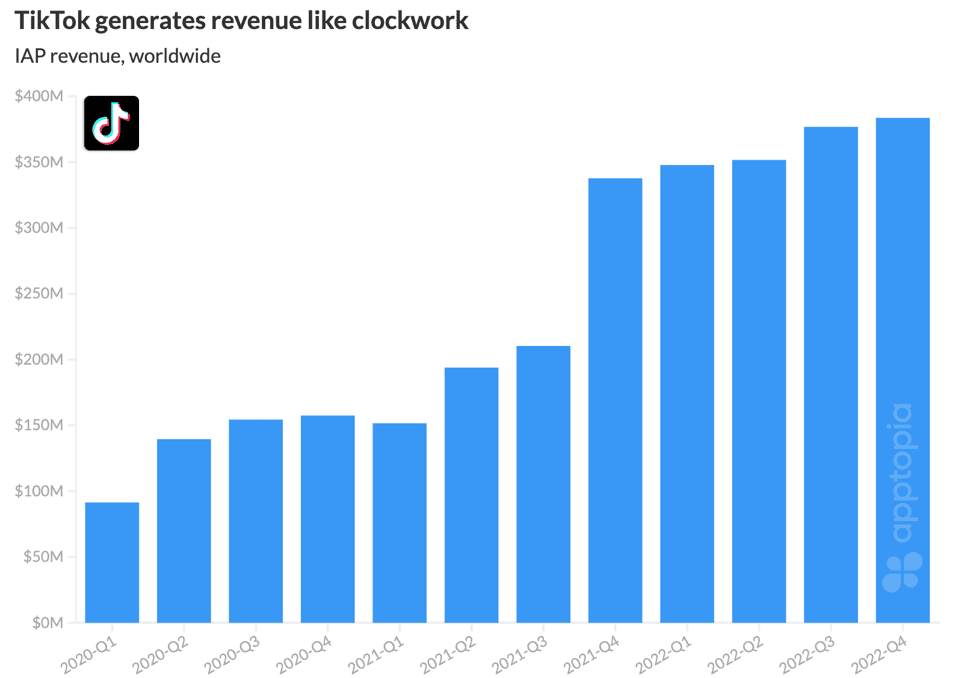
67. TikTok leads globally in in-app purchase revenue, totaling US$189 million.
Source
68. TikTok’s traffic campaigns achieve over 67% click-through rate.
69. Americans devote more social media time to TikTok than any other platform.
70. Brands rank TikTok as the 7th most reliable app for delivering positive ROI.
Source
YouTube Statistics
Marketing on YouTube involves more than just uploading videos and praying for views. Understanding how people engage with YouTube can help you gauge if it’s worth diving into. Details like user numbers and time spent can clue you into its popularity among social media users. Here are the key YouTube stats:
71. YouTube has a potential ad reach of 2.49 billion users, as per the Digital 2024 Global Overview Report.
72. The platform now has 100 million paying subscribers.
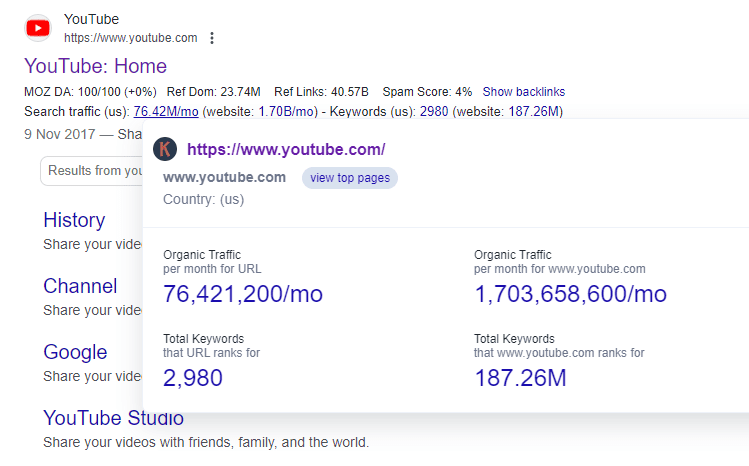
73. YouTube ranks for 187.26 million keywords and draws 1.70 billion monthly organic website visitors, as reported by Keywords Everywhere.
74. People are spending an average of 48.7 minutes daily watching YouTube videos in 2024.
75. The largest age group on YouTube falls between 25 and 34 years old.
76. India has around 462 million active YouTube users, making it the platform’s largest audience by country.
77. Despite a large user base, the U.S. contributes the most YouTube traffic at 21.93% compared to other nations.
78. YouTube is the top platform for live content viewing.
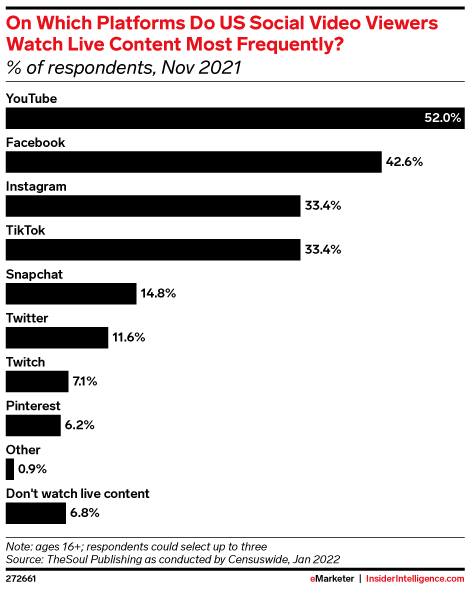
Source
79. The platform earned $31 billion in ad revenue in 2023.
80. In a survey of ad buyers, 43% state that their biggest clients advertise on YouTube Shorts.
81. After LinkedIn, YouTube is the second most effective social platform for content marketing.
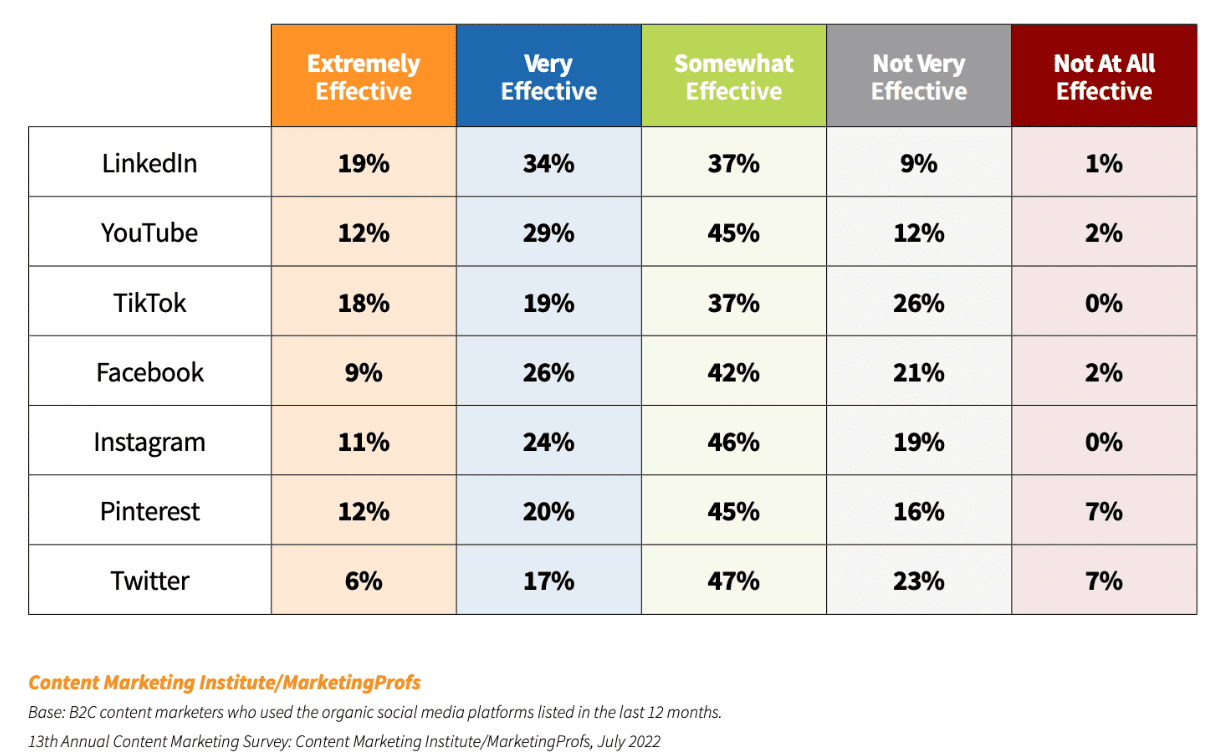
Source
LinkedIn Statistics
LinkedIn has truly nailed its niche as the ultimate professional network. It’s a goldmine for B2B brands, and the rapid expansion of their ad platform speaks volumes. Here are some exciting LinkedIn statistics you should know:
82. LinkedIn has over 1 billion members globally.
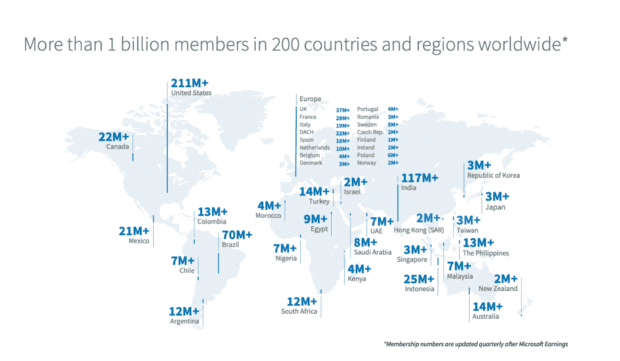
Source
83. 56.3% of LinkedIn users are men, while 43.7% are women.
84. More than 78% of LinkedIn users reside outside the United States.
85. The largest age group on LinkedIn, comprising 60% of users worldwide, falls between 25 and 34 years old.
86. The majority of LinkedIn’s traffic comes from the United States.
87. 40% of LinkedIn visitors engage with a page organically each week.
Pinterest Statistics
Despite ditching status updates for Pins, Pinterest remains a powerhouse in social media—pulling in millions of users every month. Here are some important Pinterest stats to keep an eye on:
88. Pinterest has 482 million monthly users.
89. Women make up 76.2% of Pinterest users, men account for 17.2%, and 6.6% are unspecified.
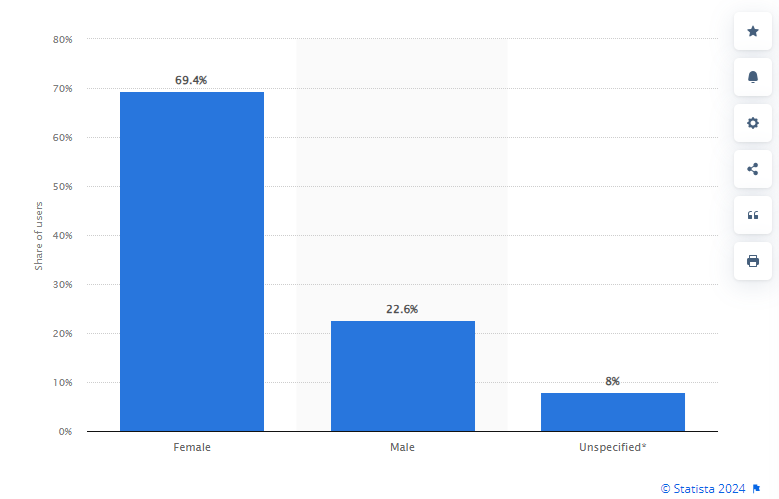
Source
90. Pinterest ranks as the 5th most popular social commerce platform.
91. In Q4 of 2023, Pinterest made $981 million in revenue.
92. Pinterest is also the third most visited social media site in the US.
93. 80% of weekly Pinterest users have found a new product or brand.
Influencer Marketing Statistics
Working with influencers is among the top marketing strategies today. If you haven’t included influencers in your marketing plan yet, it’s time to start. The key is to choose the right platforms and people for your brand, and then you can automate this with the right tools.
Here are some important influencer marketing statistics:
94. The Influencer Marketing Industry is expected to reach around $24 billion by the end of 2024.
95. 63% of brands plan to use AI in their influencer campaigns, with 55% utilizing AI for influencer identification.
96. While most brands spend less than $50K on influencer marketing, nearly 15% allocate over $500K.
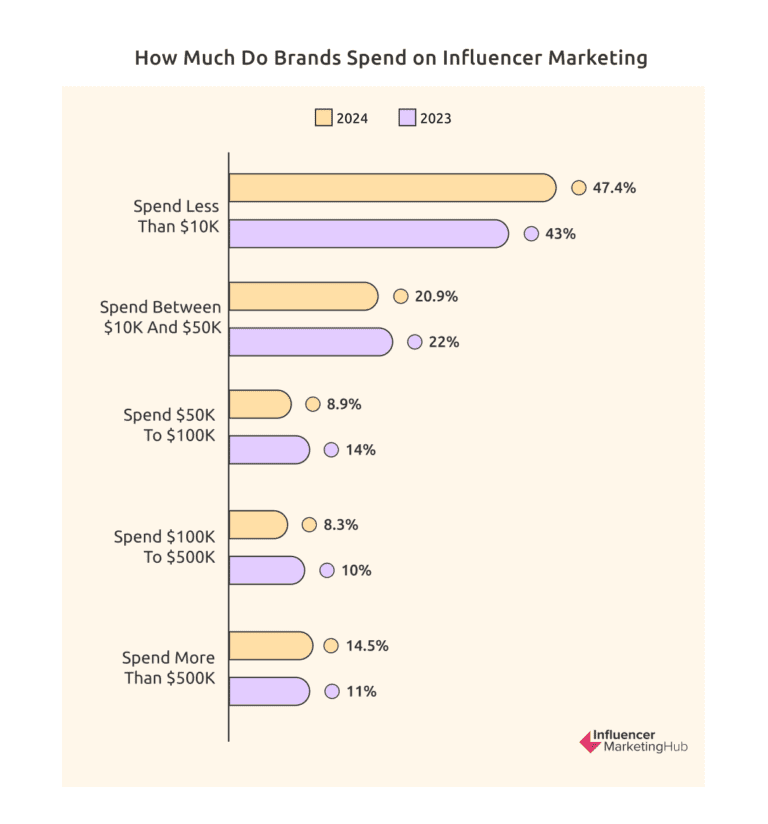
Source
97. TikTok is the leading influencer marketing channel, used by almost 69% of brands. This surpasses Instagram (47%), YouTube (33%), and Facebook (28%).
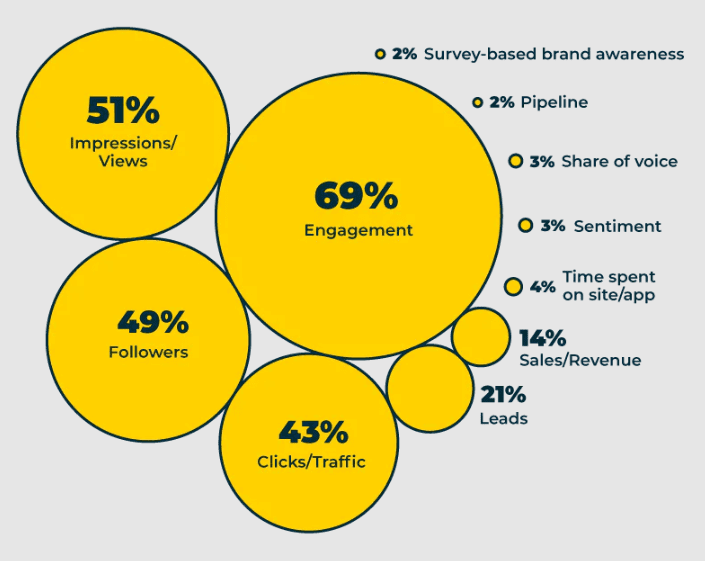
98. The main marketing goals for working with creators are generating more engagement, reaching new audiences, and strengthening community.
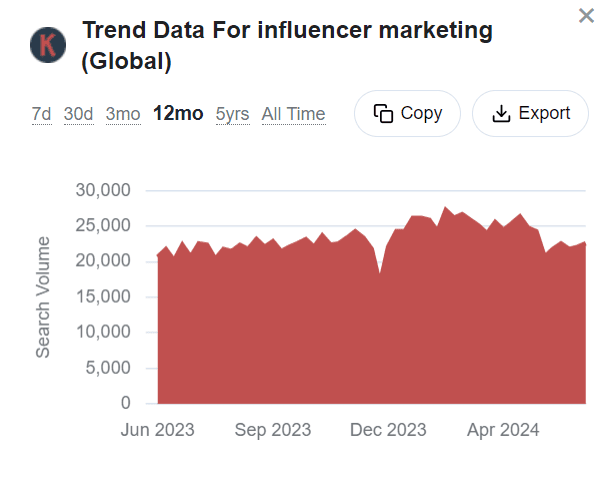
99. Keywords Everywhere data reveals a strong and steady rise in “influencer marketing” over the past year, showing how important it is as a top marketing strategy.
Consumer Behavior Statistics
Buying something you spotted on social media is nothing new. From product recommendations to brand first impressions, social media’s influence on consumers is undeniable. The recent surge in direct social sales is also pretty impressive. Dive into these key consumer behavior stats:
100. Gen Z is the leading generation in social commerce—showing higher engagement than other age groups.
101. 56.1% of internet users purchase products online at least once every week.
102. 51.2% of people find brands online before buying anything.
103. Consumers want personalized experiences, but most feel the content from brands isn’t according to their interests.
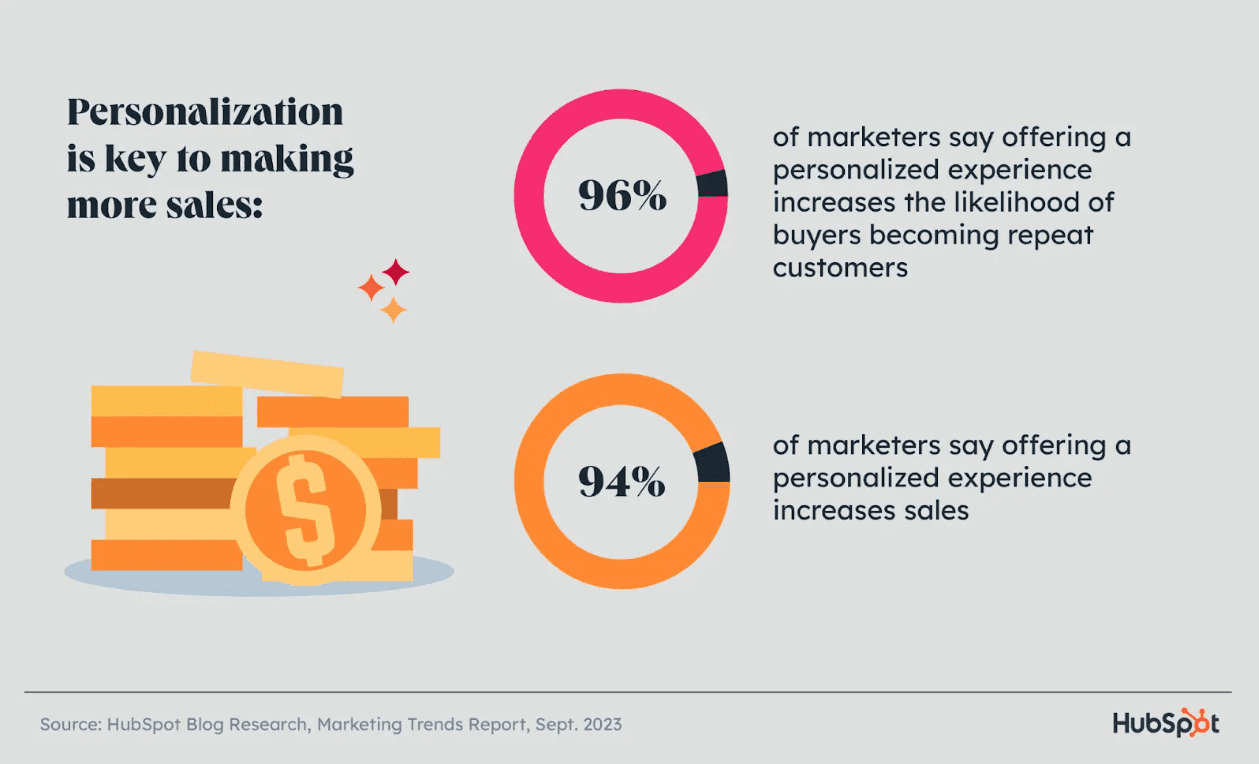
Source
104. Generative AI is a new tool for marketers to improve personalization. 77% of users say it helps create more personalized content and 72% say it personalizes customer experiences.
105. Despite wanting personalization, 50% of consumers usually decline to have their personal data tracked due to privacy concerns.
Business and Social Media Statistics
Alright, let’s wrap up by checking out some important social media stats for marketing and business. It’ll give you a real peek into how businesses and marketers are using social media.
106. Social media advertising expenditure in the United States totals $72 billion.
107. 96% of small businesses include social media in their marketing strategy.
108. 86% of industry professionals report that social media increases brand exposure.
109. 41% of small and local businesses rely on social media to drive revenue.
110. In 2024, brands that publish entertaining content on social media will attract more attention, engagement, and market share compared to those sticking to the same old content.
Source
Conclusion
Social media isn’t just about apps and platforms—it’s a digital world changing the face of marketing. To fine-tune your strategy and set smarter goals, knowing the latest social media marketing stats is very important.
Are there new networks to explore? Should you shift from organic posts to ads, or stick with what you’re doing? Is your current strategy working or do you need to refine it?
Our social media marketing stats will help answer all your questions.