It’s almost impossible to imagine life today without a smartphone in your hand, bag, or pocket because these little devices have quietly become the center of how we live, talk, work, and even relax.
Whether you’re scrolling through social media, checking emails, getting directions, or just passing time, smartphones have turned into something people rely on from the moment they get up to the minute they fall asleep.
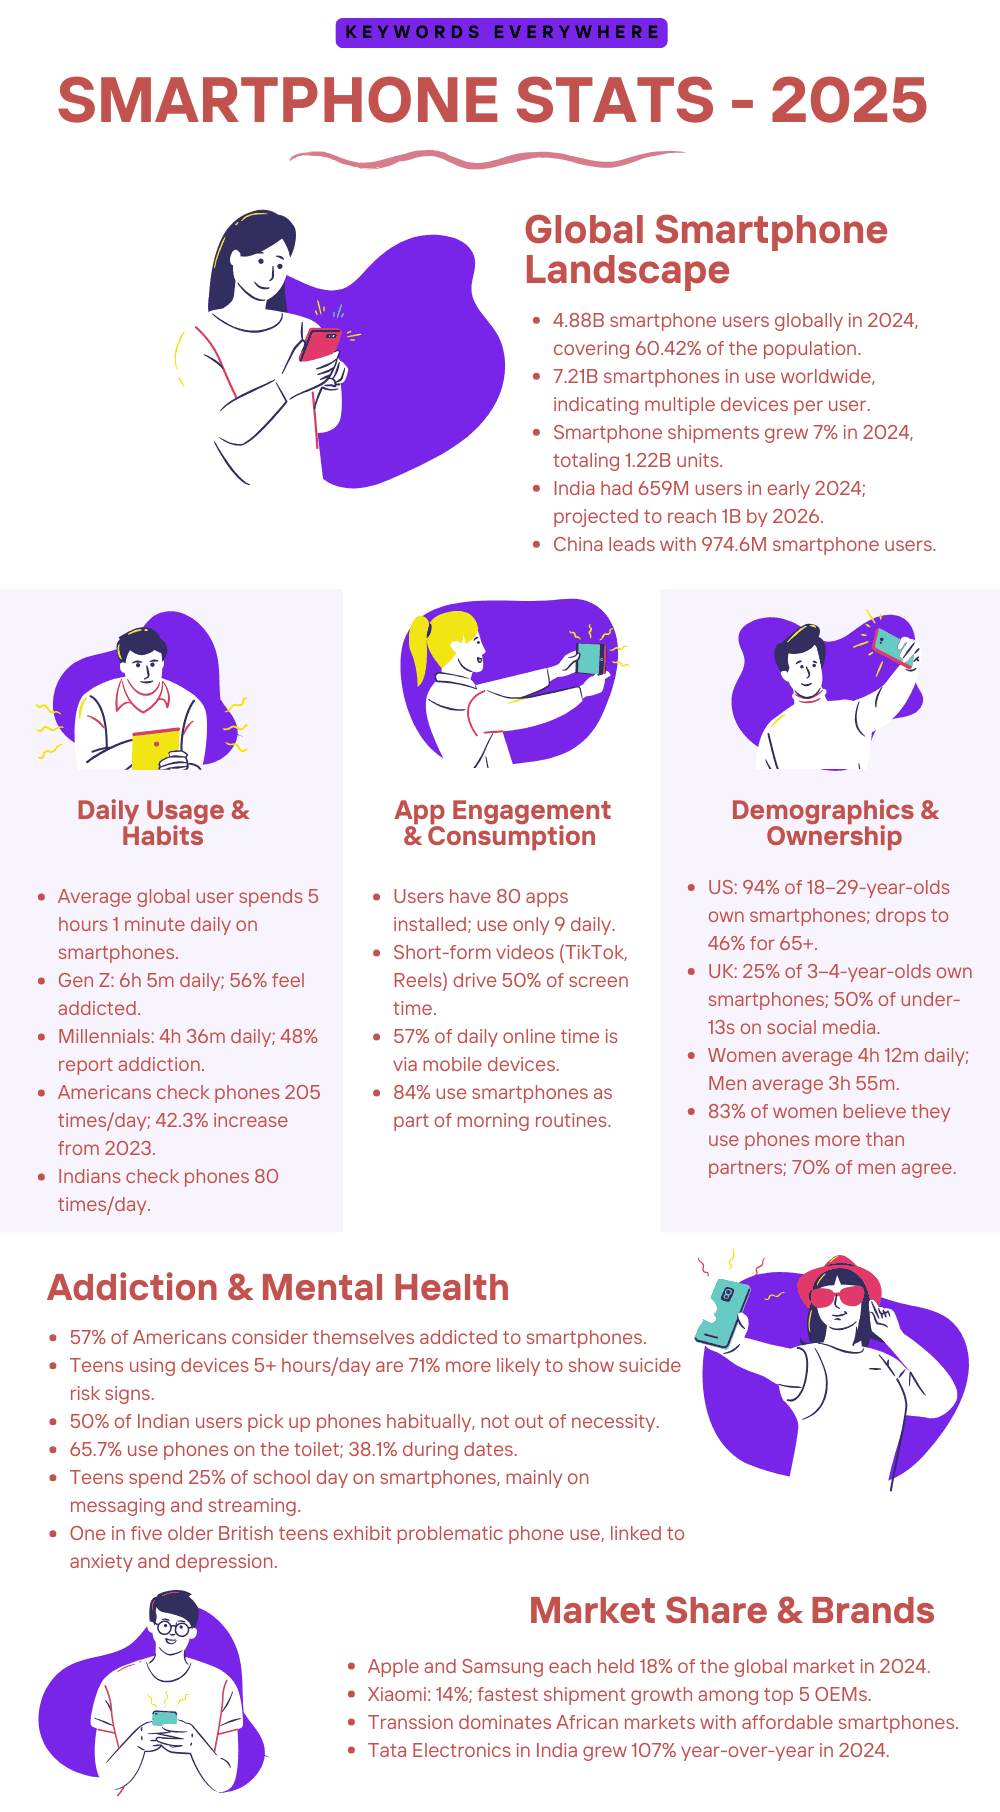
With more than 7.2 billion smartphones in use worldwide and ownership growing yearly, these smartphone stats show how deeply these devices have rooted themselves in our lives.


Top Smartphone Stats
Smartphones have become a huge part of our everyday lives, and it’s hard to imagine going even a few hours without one in your hand or pocket, which is why these top smartphone stats give you a clear picture of how much the world relies on these little devices.
From how many people own one to how often they use it, this section highlights the numbers that matter most when it comes to how smartphones have taken over modern life.
1. As of 2024, there are about 4.88 billion smartphone users worldwide, accounting for about 60.42% of the global population. This number is projected to reach 6.38 billion by 2029, marking a substantial increase of approximately 1.5 billion users over five years.
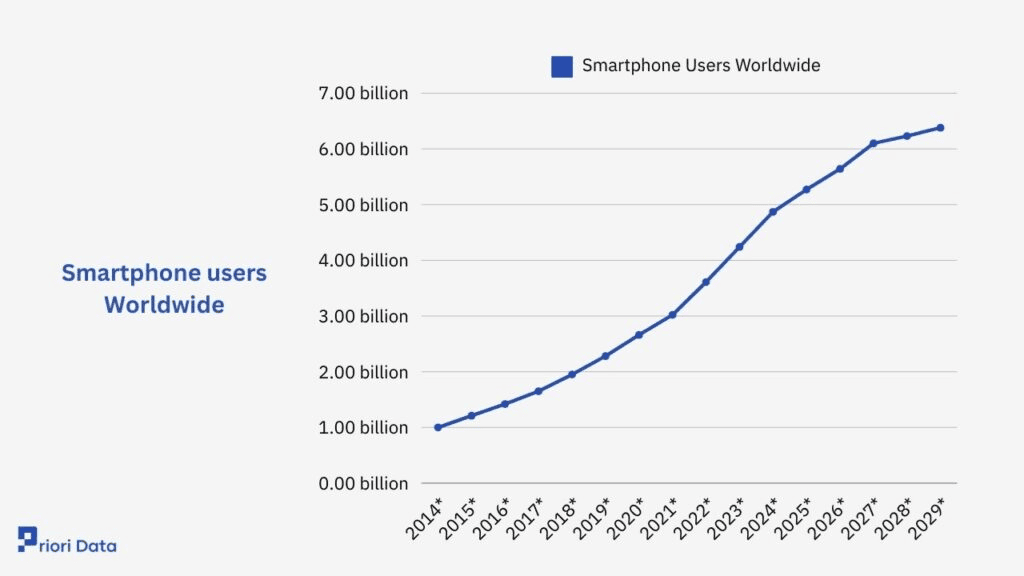
Smartphone users worldwide
2. Smartphones constitute 82% of all mobile devices globally in 2024, totaling 6.97 billion units.
3. Of the 5.35 billion internet users worldwide, 96.5% access the internet via mobile phones, with 94.6% doing so from smartphones.
4. In 2024, the average smartphone user spends approximately 5 hours and 1 minute daily on their device, representing a 5.6% increase from the previous year.
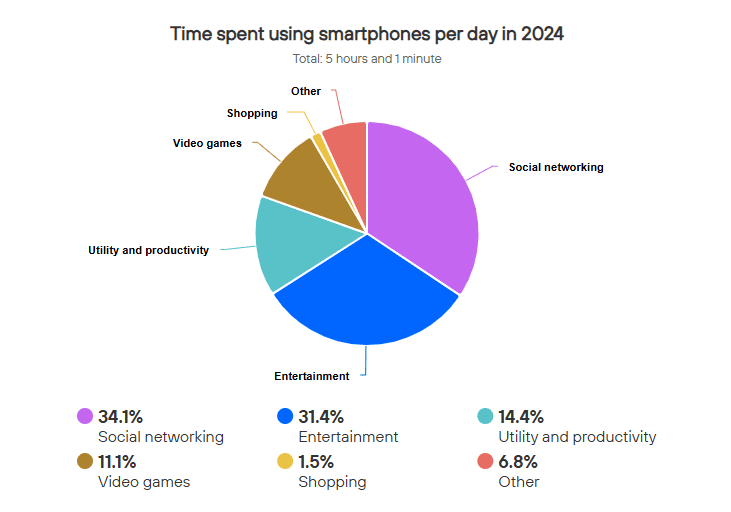
Time spent using smartphone per day
5. India had approximately 659 million smartphone users in early 2024, with projections estimating this number to rise to 1 billion by the end of the year.
6. Gen Z spends about 6 hours and 5 minutes daily on their smartphone, with 56% feeling addicted to their phones. Millennials, on the other hand, spend 4 hours and 36 minutes daily, with 48% reporting feelings of addiction.
7. In 2024, global smartphone shipments reached 1.22 billion units, marking a 7% increase compared to 2023. This growth indicates a rebound after two consecutive years of decline.
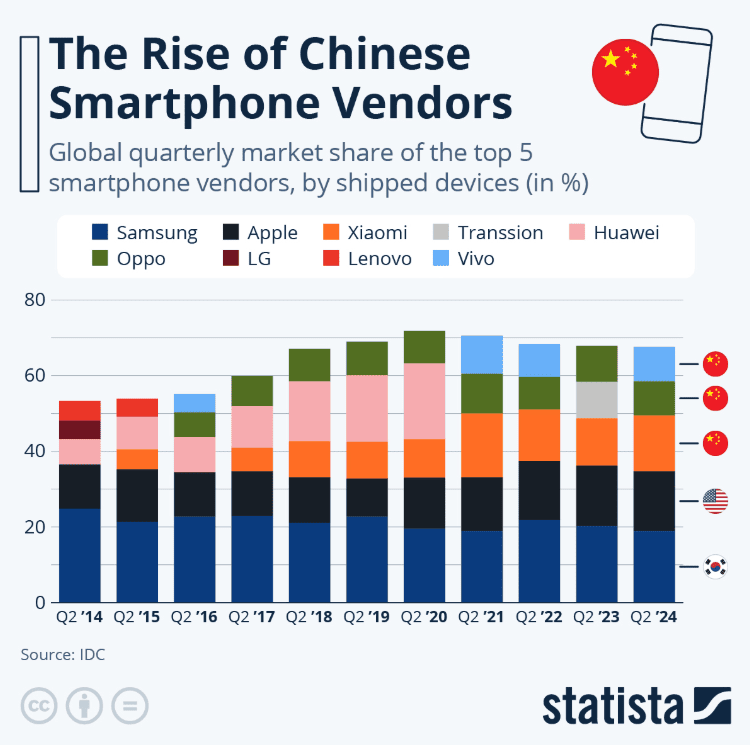
8. Apple and Samsung each held an 18% share of the global smartphone market in 2024, tying for the top position. They were followed by Xiaomi (14%), Transsion (9%), Oppo (8%), and Vivo (8%).
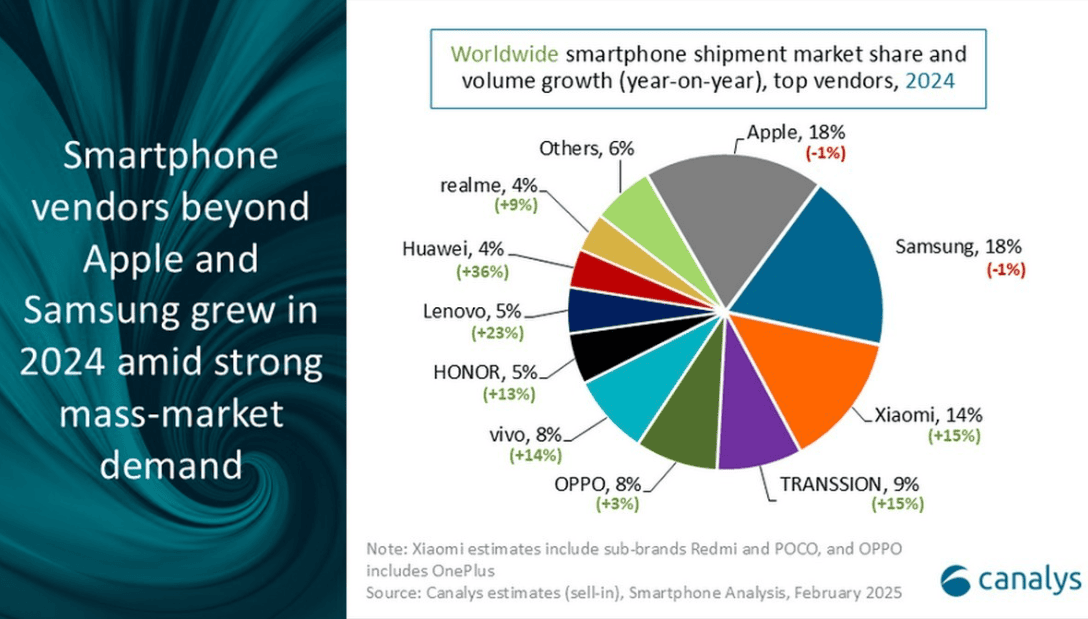
Worldwide smartphone shipment market share
9. The share of 5G smartphone shipments in India increased to 79% in 2024, up from 55% in 2023, with 120 million 5G smartphones shipped during the year.
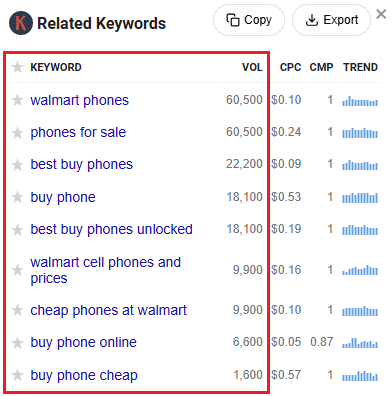
10. According to Keywords Everywhere, the term “buy phone” and similar keywords have a high monthly search volume, showing that more people are turning to online shopping when looking for a new phone.
Smartphone Usage And Habits Stats
We check our phones when we wake up, during lunch, before bed, and sometimes even in the middle of conversations, and that’s exactly what this section dives into—how people use their smartphones every day.
These smartphone stats show how often we pick them up, what we do on them, and how deeply they’ve shaped our habits, routines, and even relationships without us ever realizing it.
11. In 2024, the average American checks their phone 205 times per day, which equates to approximately once every five minutes. This marks a 42.3% increase from the previous year.
12. Indian smartphone users check their phones an average of 80 times daily, with 84% doing so within 15 minutes of waking up.
13. Users worldwide spend an average of 4 hours and 25 minutes on their smartphones each day, totaling nearly 67 days per year.
14. A significant 84% of smartphone users incorporate their devices into their morning routines, often checking different apps after waking up.
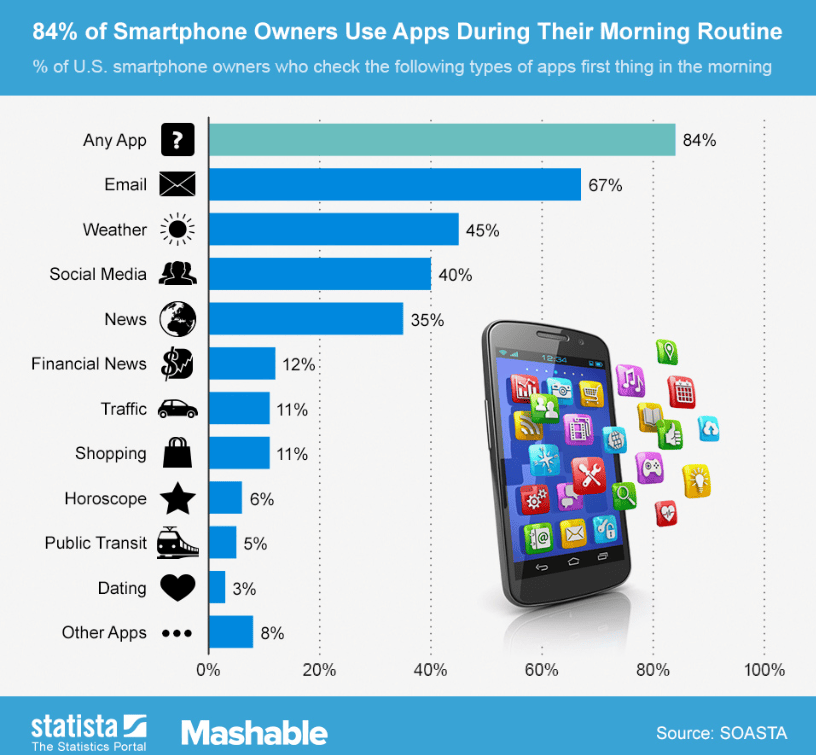
Majority of smartphone owners use apps after waking up
15. On average, users have 80 apps installed but regularly use only about 9 of them daily, suggesting a pattern of habitual checking rather than purposeful engagement.
16. Short-form video content, such as TikTok and Instagram Reels, has significantly contributed to increased smartphone usage, with social media and communication apps accounting for approximately 50% of total screen time.
17. As of Q2 2024, 57% of the total daily time spent online by internet users was via mobile devices, including smartphones and feature phones.
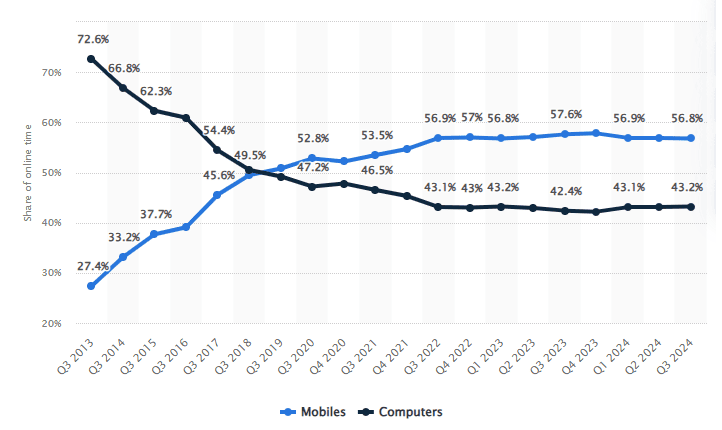
Average daily time spent online worldwide by device
18. A study revealed that 50% of the time, Indian smartphone users pick up their phones out of habit rather than a specific need.
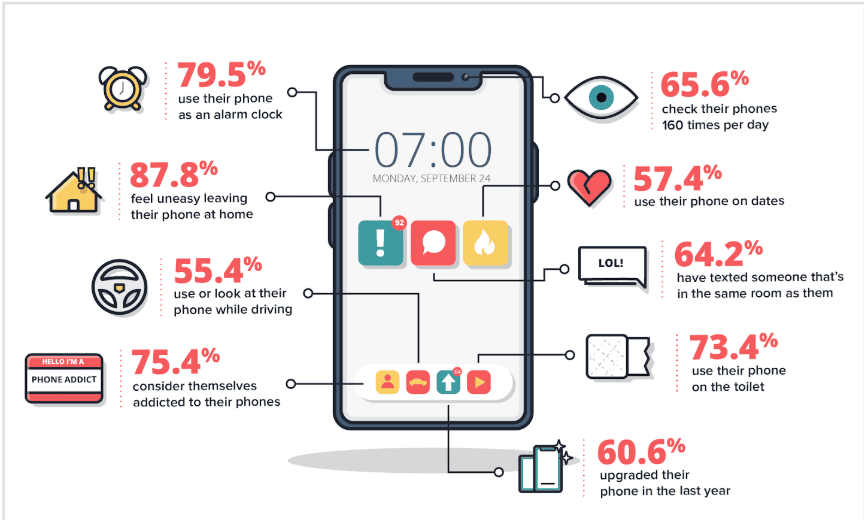
19. 65.7% of users admit to using their phones while on the toilet, and 38.1% use them during dates, indicating the pervasive presence of smartphones in various aspects of personal life.
20. 83% of individuals use smartphones for emails and capturing images, while 76% use them for internet browsing and 73% for navigation purposes.
21. In educational settings, teenagers spend nearly a quarter of their school day on smartphones, primarily engaged in messaging, social media, and streaming content.
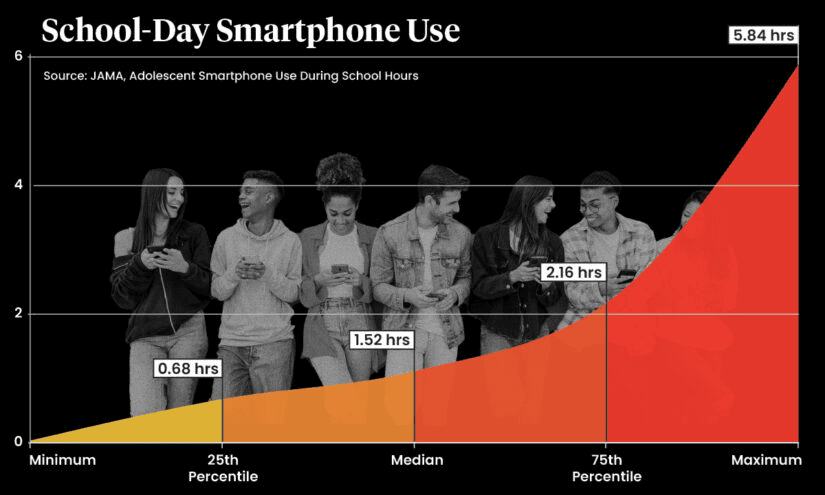
Teenagers use cell phones for quarter of school day
Smartphone User Demographics Stats
Not everyone uses their phone the same way, and when you look closer, you’ll see that age, income, and where someone lives all play a big role in how they use smartphones.
These smartphones break down who uses them, how different groups behave online, and what those numbers reveal about how connected different generations and communities are today.
22. In the United States, approximately 94% of individuals aged 18–29 own a smartphone, with ownership decreasing to 73% among those aged 50–64 and 46% among individuals over 65.
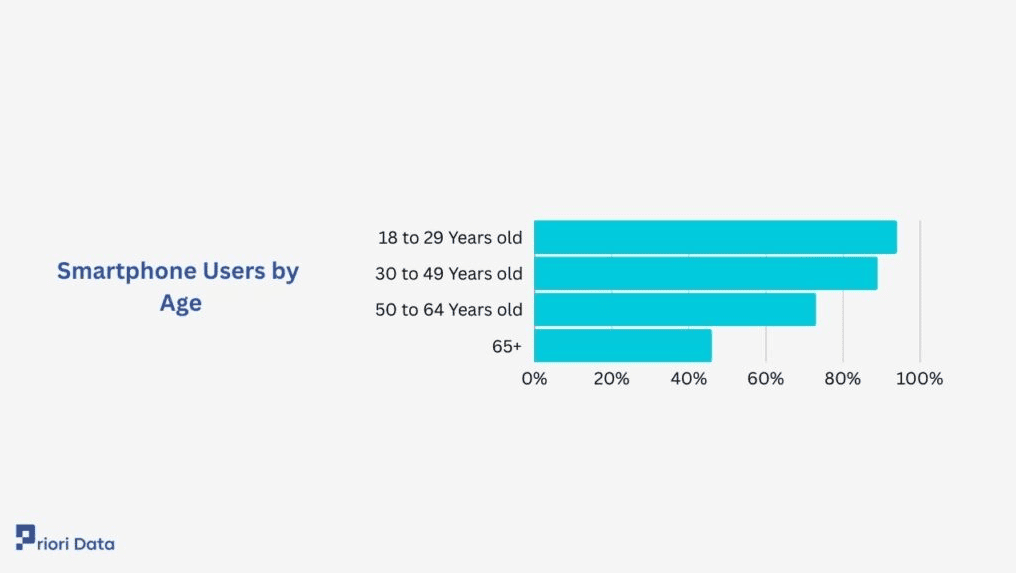
Smartphone users by age
23. In the United Kingdom, a quarter of three- and four-year-olds own a smartphone, and half of children under 13 are active on social media.
24. Women tend to spend more time on smartphones than men. In a sample of over 50,000 people, the daily average smartphone screen time for females was approximately 4 hours and 12 minutes, compared to 3 hours and 55 minutes for males.
25. 83% of women say they spend more time on their smartphones than their partners, while 70% of men believe they use their smartphones more than their partners do.
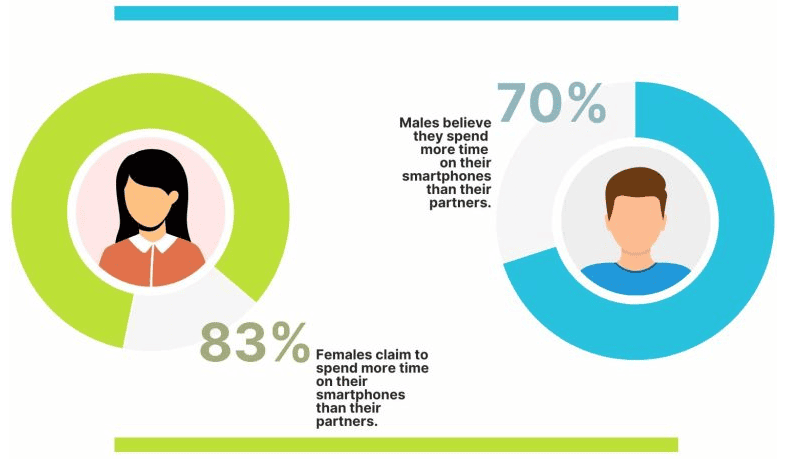
Women spend more time on phone than their partners
26. Gender preferences also influence app engagement trends. Men spend 20% more time on gaming apps than women, while women lead social media usage by 15%, with platforms like Instagram and Pinterest seeing higher engagement from female users.
27. In Asia, countries like China, Thailand, Indonesia, Saudi Arabia, India, and the Philippines lead in mobile internet usage, with over 60% of internet time spent on mobile devices.
28. In the United States, 80% of men and 75% of women own smartphones, with ownership varying across urban, suburban, and rural areas.
29. While younger generations like Gen Z and Millennials are heavy smartphone users, there’s a growing trend of digital minimalism. Some Gen Z individuals are opting for “dumbphones” or minimalist devices to reduce screen time and alleviate digital anxiety.
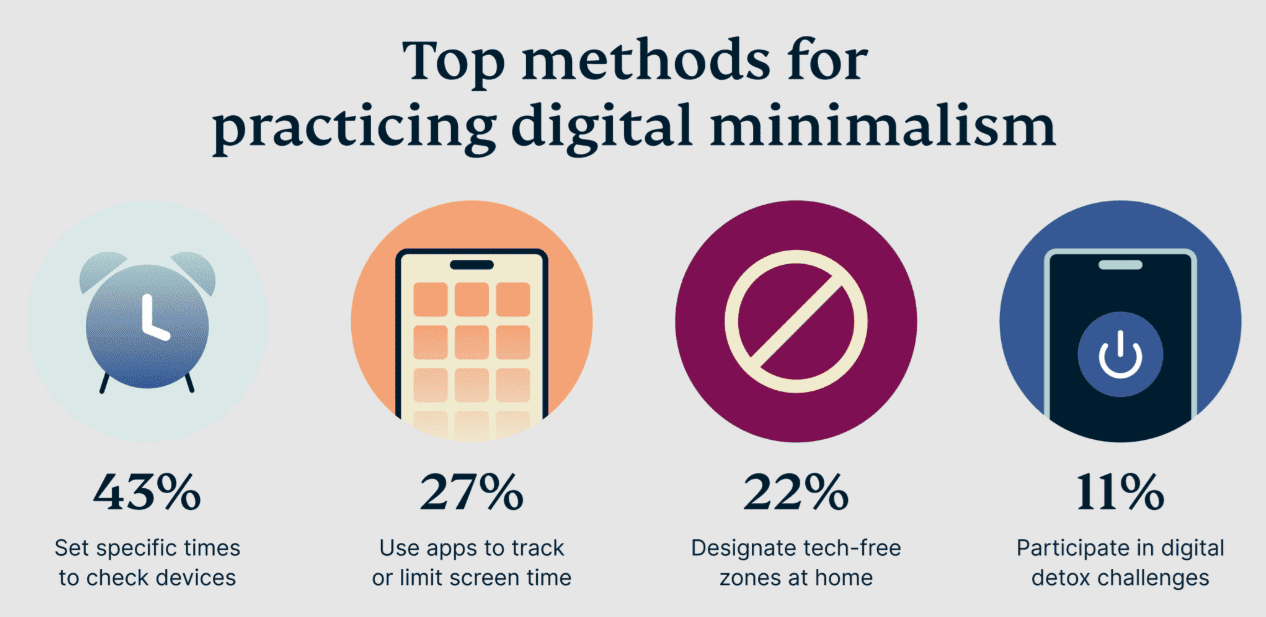
Top methods for practicing digital minimalism
Smartphone Stats By Region
From busy cities to quiet rural towns, smartphones have made their way into nearly every part of the world, but how people use them still changes depending on where they live.
These smartphone stats share the number of users globally and how smartphone trends shift from region to region:
30. The total number of smartphones in use globally is around 7.21 billion, indicating that many individuals own more than one device.
31. China leads globally with 974.69 million smartphone users, accounting for a 68.4% penetration rate among its 1.43 billion population.
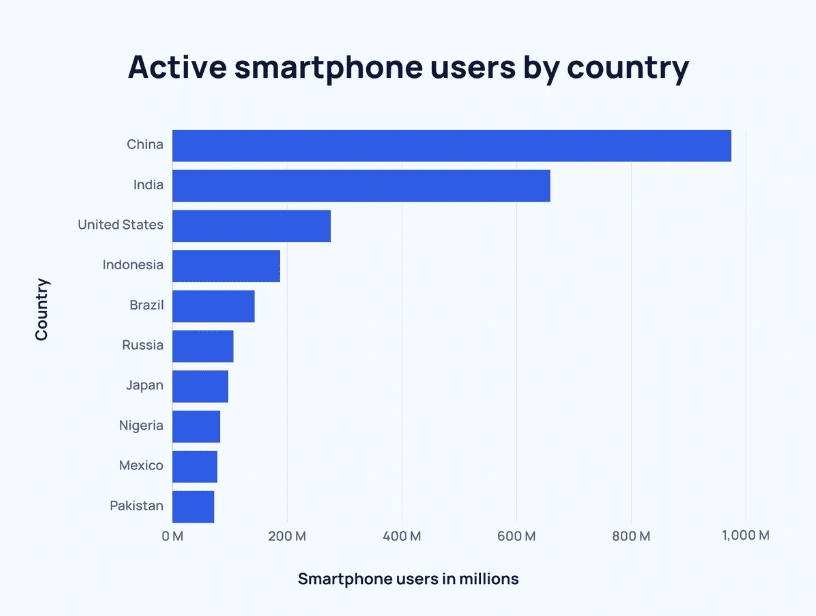
Smartphone users by country
32. India has 659 million smartphone users, with a 46.5% penetration rate. Notably, rural areas are experiencing significant growth, with projections indicating that by 2025, rural internet users will exceed 504 million, surpassing urban users.
33. Indonesia reports 187.7 million smartphone users, achieving a 68.1% penetration rate, and Japan has 97.44 million users, with a high 78.6% penetration rate.
34. Smartphone adoption rates are highest in the North American region, with 84% of total mobile connections being smartphones in 2023, projected to reach 89% by 2030.
35. Transsion, a Chinese company, dominates the African smartphone market, particularly through its Tecno brand, which offers affordable, locally-adapted smartphones.
36. Despite expanded mobile coverage, only 25% of adults in sub-Saharan Africa can access mobile internet, hindered by high costs and low literacy.
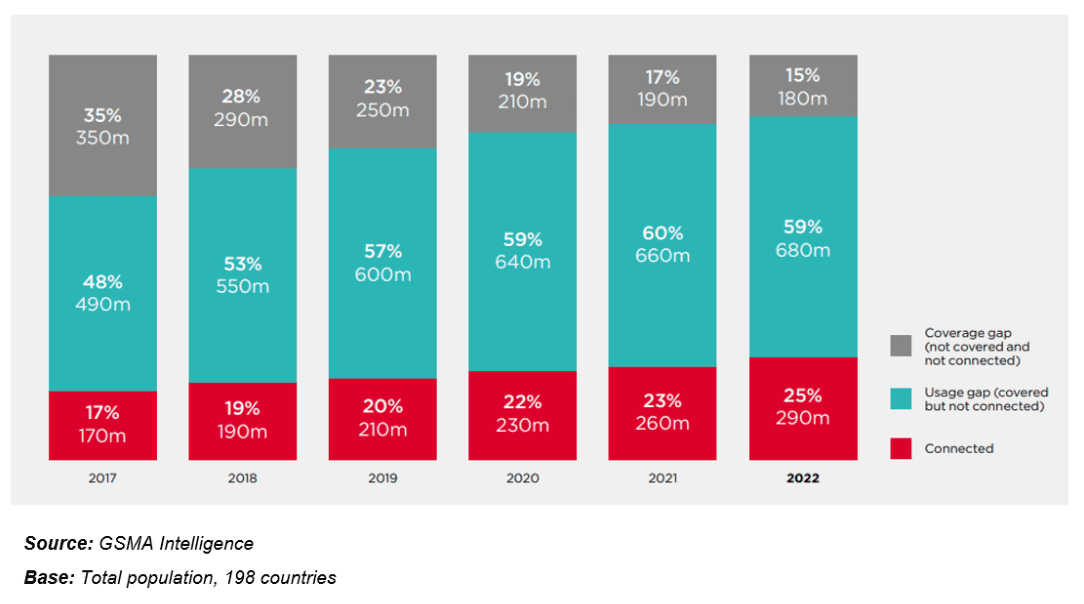
Sub-Saharan Africa has the widest smartphone usage and coverage gaps worldwide
Smartphone Addiction Stats
We joke about being glued to our screens, but the truth is that smartphone addiction is a growing concern that’s affecting everything from sleep to mental health.
This section looks at the more serious side of smartphone use, showing how often people (especially teens) feel they can’t put their phones down and what that constant connection might be doing to our minds and our well-being.
37. 57% of Americans see themselves as addicted to their smartphones.
Americans and their smartphone addiction
38. 60% of international smartphone users report excessive usage levels post-COVID.
39. Teens who use electronic devices for five or more hours a day are 71% more likely to show signs of suicide risk compared to those who use them for only one hour daily.
40. In Iran, the prevalence of smartphone addiction has become a concern for health policy systems, especially during and following the COVID-19 pandemic.
41. 20%–30% of adolescents and young adults are reported to have a phone addiction, with teens displaying high-frequency phone usage patterns.
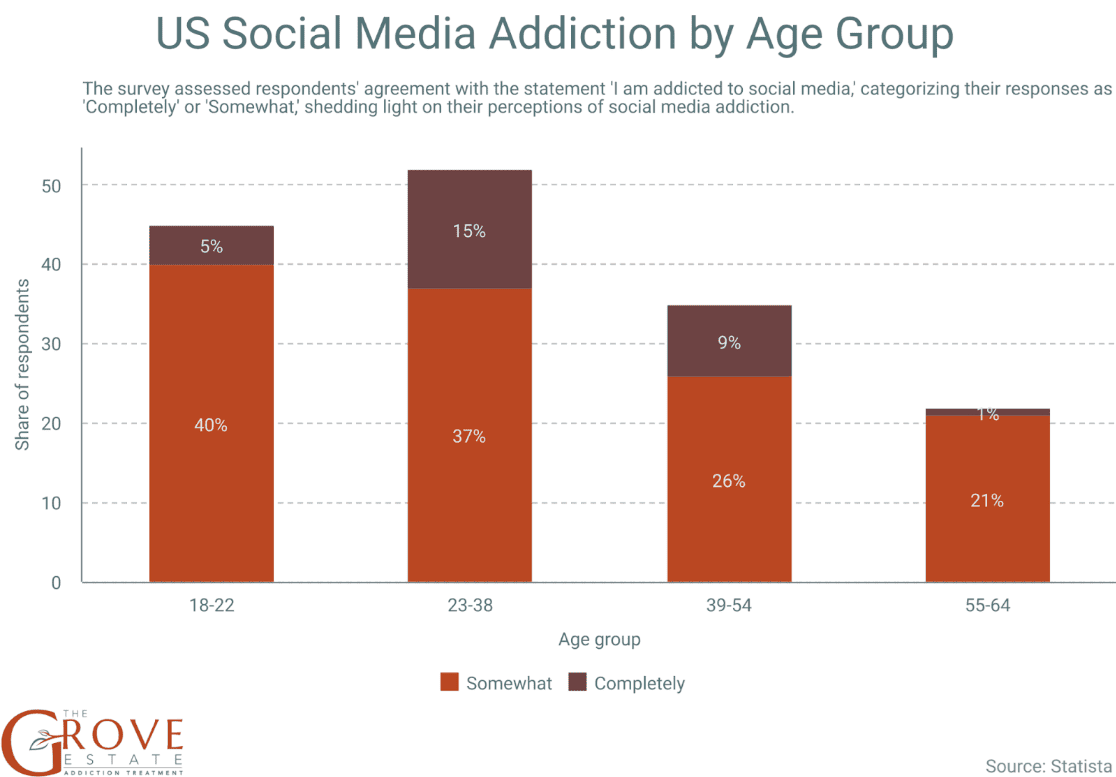
Social media addiction by age group
42. A study found that one in five older British teenagers exhibit problematic smartphone use, similar to addiction, and are more likely to experience anxiety, depression, and insomnia.
43. The average teenager receives 273 notifications daily, leading to high stress, disturbed sleep, and increased anxiety.
44. In a study, teens who surrendered their phones for three weeks experienced a 17% decrease in anxiety and depression symptoms, improved sleep, and better memory.
45. A review highlighted the widespread and growing addiction to smartphones, comparing it to a dystopian future where people are hooked on virtual reality.
46. Teenagers displaying problematic phone use are more likely to be depressed, with increased risks of insomnia and anxiety.
47. A charity in England found that heavy dependence on smartphones among Gen Z leads to increased feelings of loneliness, anxiety, and isolation.
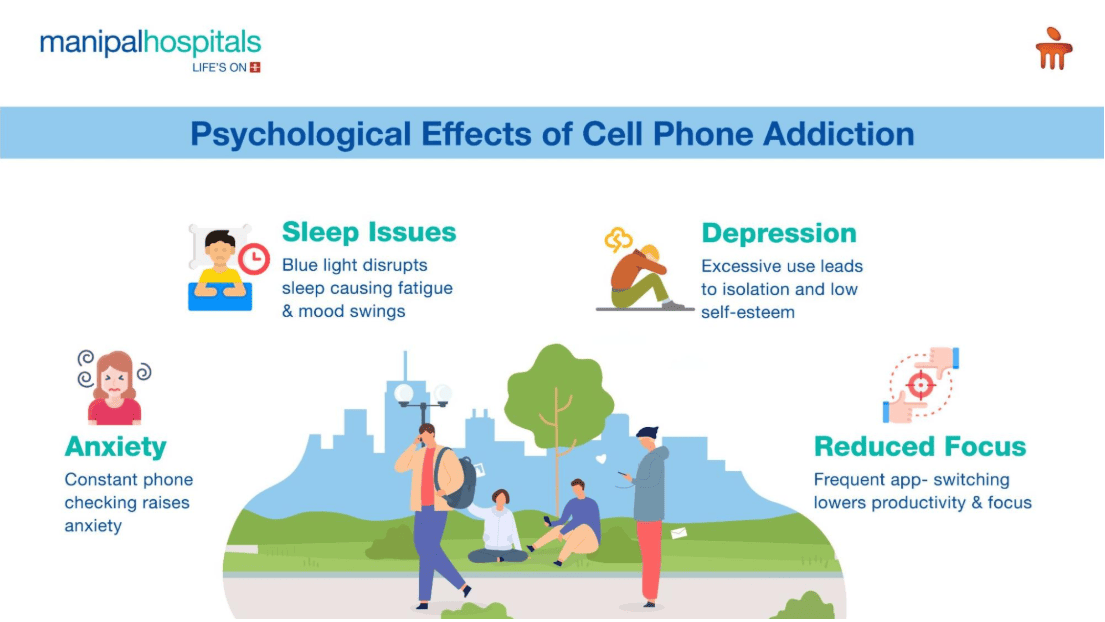
Psychological effects of phone addictions
Smartphone Penetration Stats
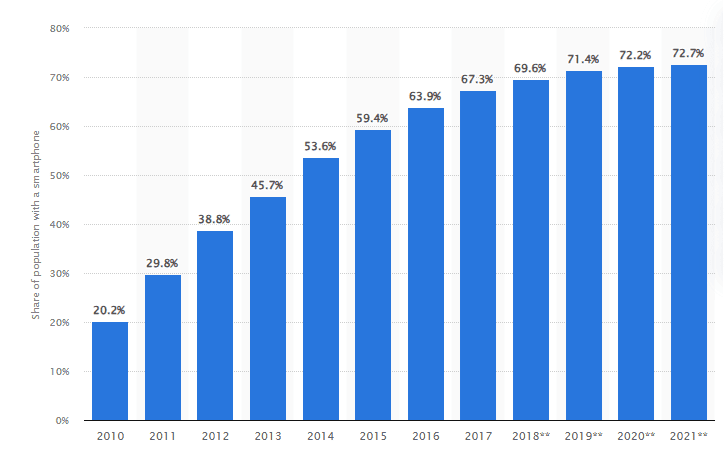
The number of people with smartphones has exploded over the past decade, and now they’re in the hands of billions, shaping the way the world connects and communicates.
These smartphone penetration stats reveal how widespread they’ve become in different countries:
48. Global smartphone penetration reached 60.42% in 2024, equating to approximately 4.88 billion people worldwide.
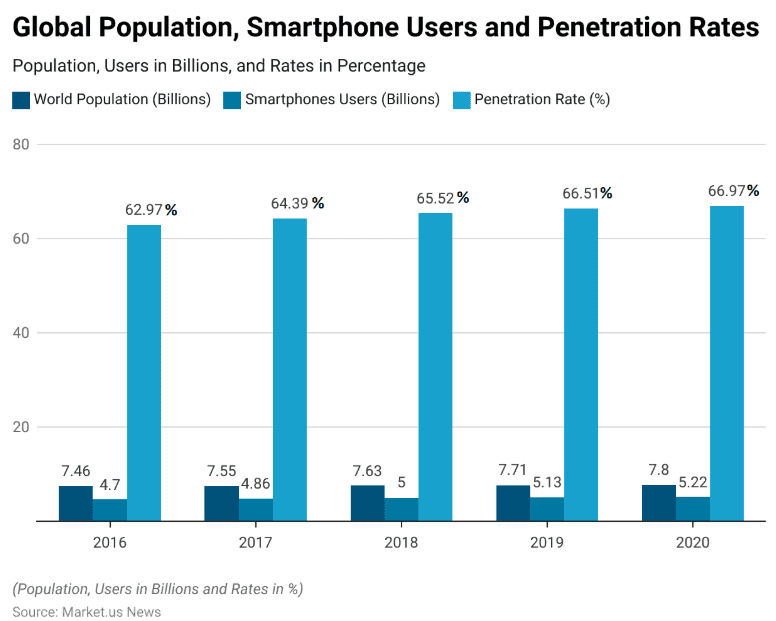
Global smartphone penetration rates
49. In North America, the smartphone adoption rate was 85.4% in 2024.
50. Europe reported a smartphone adoption rate of 83.2% in 2024.
51. In East Asia, the smartphone penetration rate was 89.1% in 2024.
52. South America had a smartphone penetration rate of 72.3% in 2024.
53. In Africa, the smartphone penetration rate stood at 48.7% in 2024.
54. The United States had 276.14 million smartphone users in 2024, covering 81.6% of its population.
Smartphone penetration rate in the U.S.
55. Brazil had 143.43 million smartphone users in 2024, with a penetration rate of 66.6%.
56. Russia had 106.44 million smartphone users in 2024, making up 73.6% of its population.
57. Nigeria had 83.34 million smartphone users in 2024, with a penetration rate of 38.1%.
58. Mexico had 78.37 million smartphone users in 2024, with a penetration rate of 61.5%.
59. Pakistan had 72.99 million smartphone users in 2024, with a penetration rate of 31%.
Smartphone Market Share Stats
While many people own smartphones, not all of them are using the same brands or operating systems, and the competition between tech giants is always shifting.
In this section, you’ll find out which companies are leading the smartphone market and how their shares have changed over time:
60. Samsung led global smartphone shipments in Q3 2024 with a 19% market share, driven by the Galaxy A series.
61. Apple secured the second position globally in Q3 2024 with a 16% market share.
62. Xiaomi ranked third globally in 2024, achieving a 14% market share and a 12% increase in sales.
Smartphone market share
63. In Q4 2024, Apple led the global smartphone market with a 23% share, while Samsung held a 16% share.
64. Xiaomi achieved the fastest shipment growth among the top five OEMs in 2024, with a 16% year-over-year increase.
65. Vivo experienced the fastest revenue growth among the top five OEMs in 2024, with a 20% year-over-year increase.
66. Tata Electronics (formerly Wistron) was the fastest-growing smartphone manufacturer in India in 2024, with a 107% year-over-year growth.
67. Foxconn Hon Hai’s volumes in India grew 19% year-over-year in 2024, propelled by increasing shipments of the iPhone 14, iPhone 15, and iPhone 13 models.
Conclusion
That concludes our roundup of smartphone statistics.
Smartphone penetration continues to grow and is increasingly becoming more widespread across the globe.
While developing countries still face challenges in reaching the same levels of smartphone penetration, the most developed nations are seeing smartphones become near-omnipresent in daily life.
From changing how we communicate to shaping entire industries, smartphones are reshaping the world as we know it, and their influence will only continue to grow in the years ahead.