Picture yourself scrolling through Instagram, where trends come and go in the blink of an eye. Every day, new features pop up, and influencers are always shaking things up. Keeping up on this super-fast platform can feel like chasing a moving target.
That’s where Instagram statistics come into play. They’re not just numbers—they’re like insider secrets that reveal how people use Instagram, what brands are doing right, and why influencers matter. Understanding these trends is like getting a cheat code to level up your strategy.
Below, we’ve shared essential Instagram stats that will give you a practical roadmap to boost your Insta strategy and stay ahead of the curve.


General Instagram Statistics
Imagine a platform where you can share your favorite photos and videos with 2 billion people every month. That’s Instagram! Since it began, Instagram has become a powerhouse for businesses wanting to grow and show off their products.
Its visual appeal makes it perfect for highlighting cool, innovative, and beautiful items and services. Industries like fashion, travel, food, beauty, home decor, and events have thrived by adding Instagram to their marketing plans.
Let’s dive into some basic Instagram statistics that you’ll find interesting and useful.
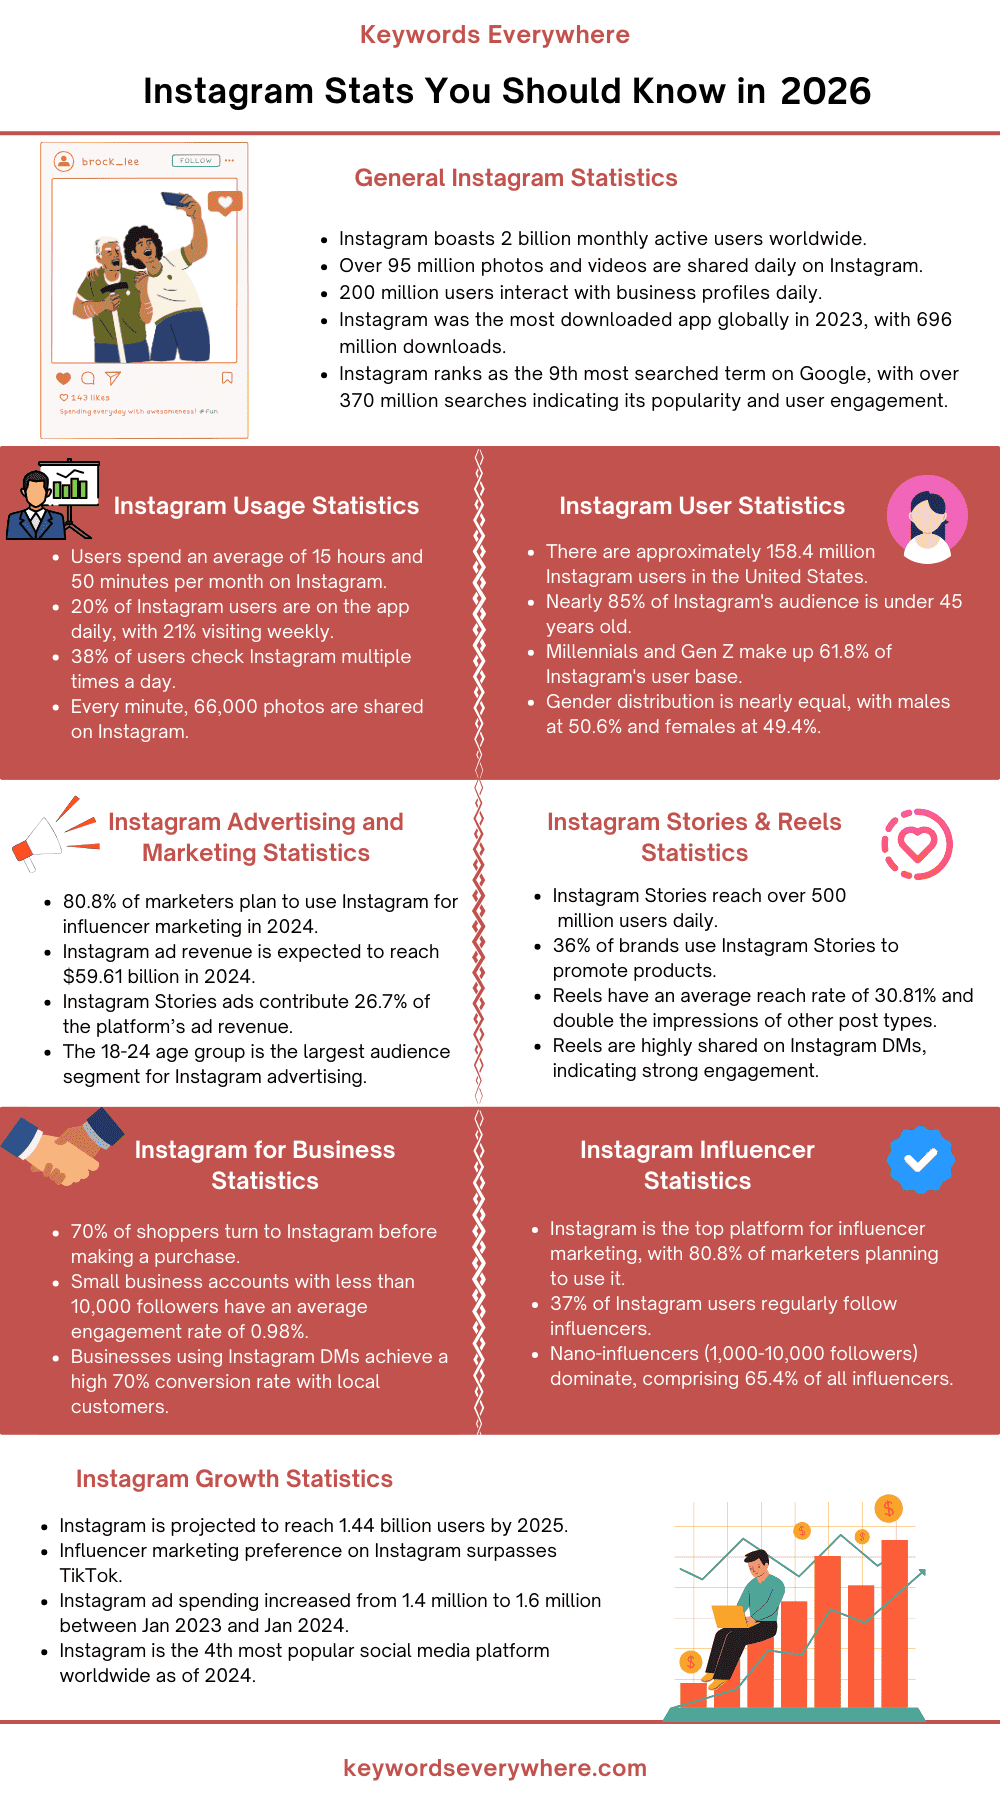
1. Instagram is incredibly popular, with 2 billion people using it every month.
2. Every day, more than 95 million photos and videos are shared on Instagram.
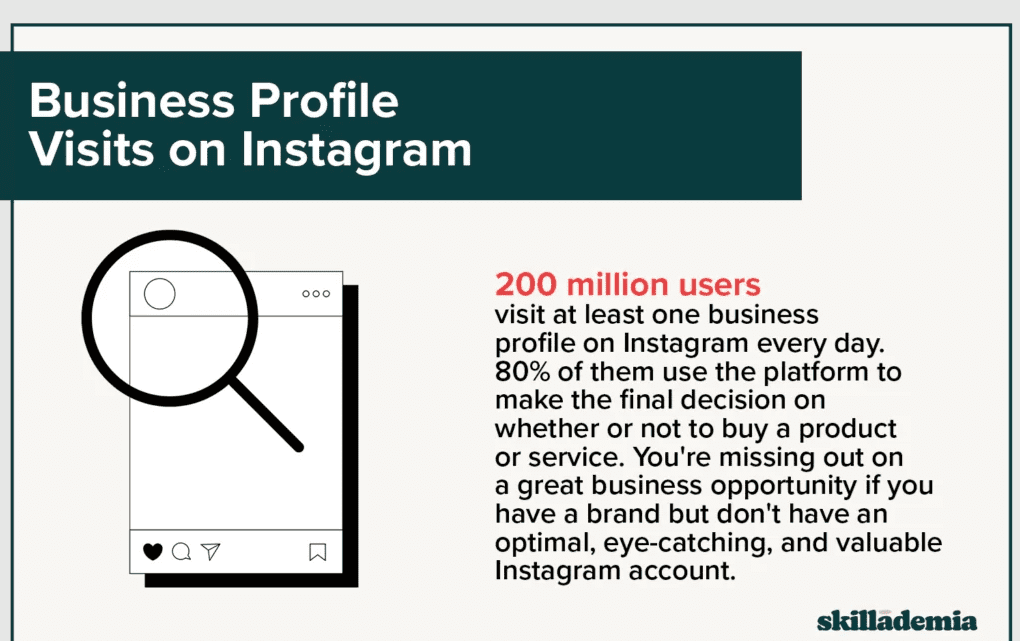
3. Two hundred million users check out at least one business profile on Instagram daily.
Source
4. In 2023, Instagram was the most downloaded app—with over 696 million downloads worldwide.
5. Instagram is the 9th most searched term on Google, with over 370 million searches.
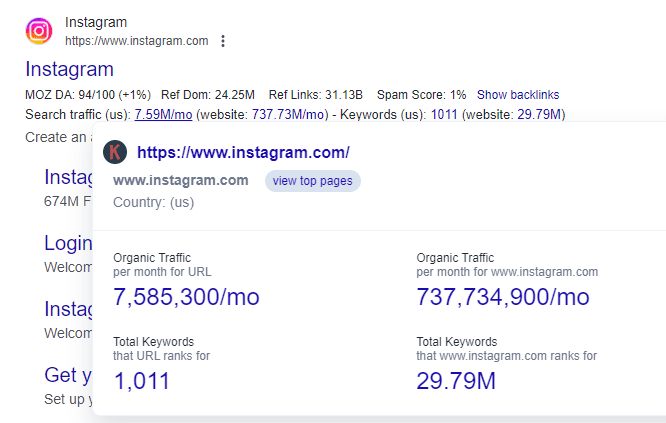
6. According to Keywords Everywhere, Instagram gets 737.73 million monthly organic visitors and ranks for 29.79 million keywords.
7. More than half (53.7%) of marketers plan to use Instagram reels for influencer marketing in 2024.
8. 71% of marketers say Instagram is the platform they most want to learn about.
9. Instagram is the top app people use to research brands.
10. Instagram’s median engagement rate is 0.43% across all industries. That’s 6.8 times higher than Facebook posts and 14.8 times higher than tweets.
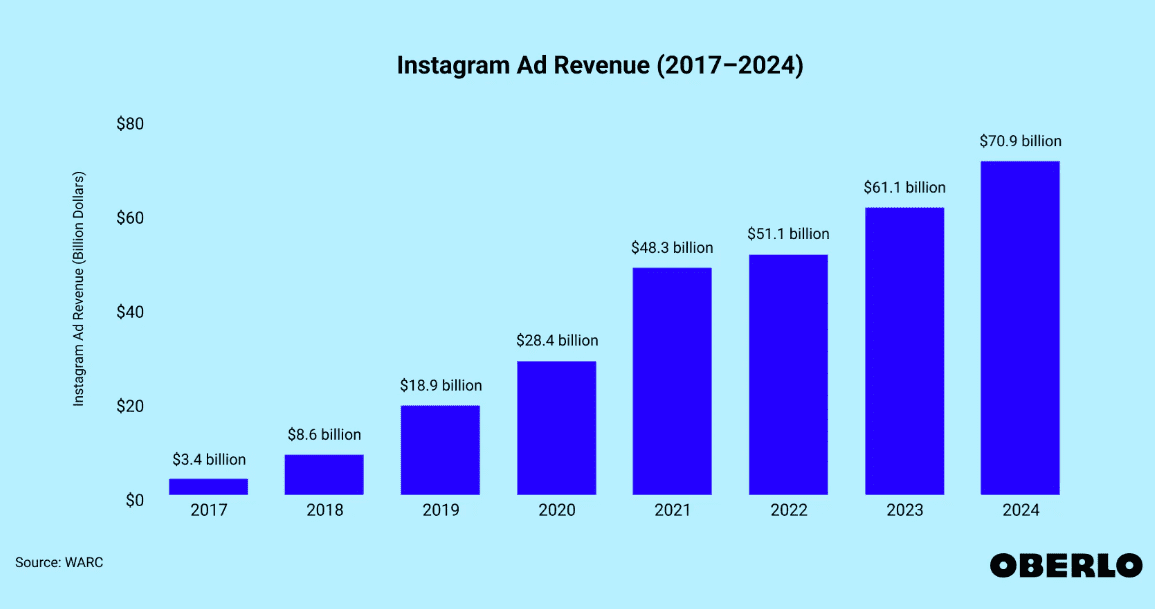
11. Instagram ad revenue is expected to reach $59.61 billion in 2024.
Source
12. 35.71% of the 5.06 billion active mobile internet users access Instagram monthly, which is the same number of people as those living in North America and Europe combined.
13. A 2024 study found that the Higher Education sector had the highest post engagement rate, at 2.43%.
Instagram User Statistics
To make the most of Instagram, it’s really important to understand how people use the platform and what they expect. This knowledge will help you craft strategies that truly resonate. Here’s a look at some key Instagram user statistics that can help you shape your approach.
14. As of 2024, there are approximately 158.4 million Instagram users in the United States.
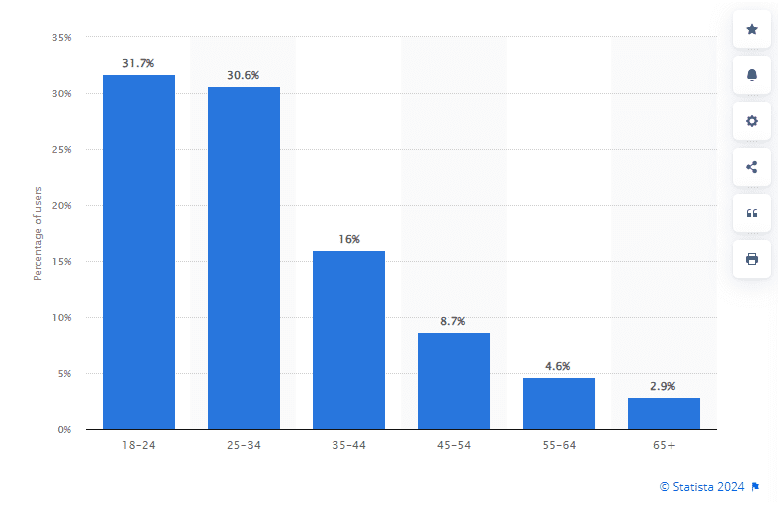
15. Nearly 85% of Instagram’s audience is under 45 years old, with over half of all users worldwide being 34 or younger.
Source
16. Millennials and Gen Z dominate Instagram, making up 61.8% of its user base this year.
17. The heart of Instagram’s user community lies in the 18-34 age group, with more men than women in this segment. However, women aged 35 and up are more active on Instagram than men in the same age range.
18. Despite teenagers making up just 8% of Instagram users, half of them log in daily.
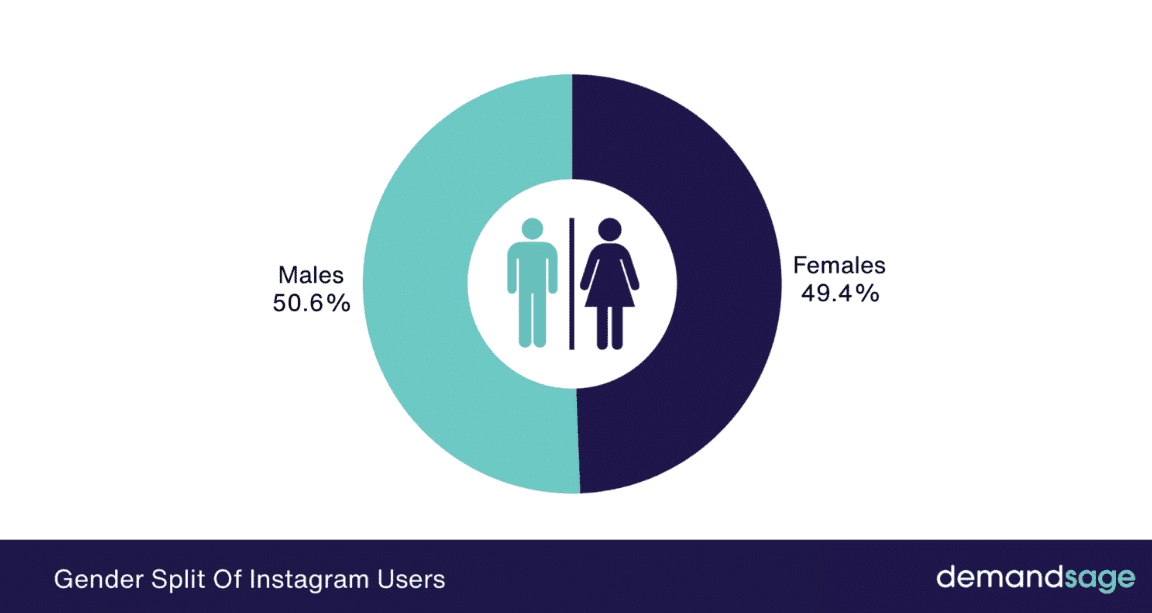
19. Gender-wise, Instagram is nearly split down the middle globally, with males making up 50.6% and females 49.4% of users.
Source
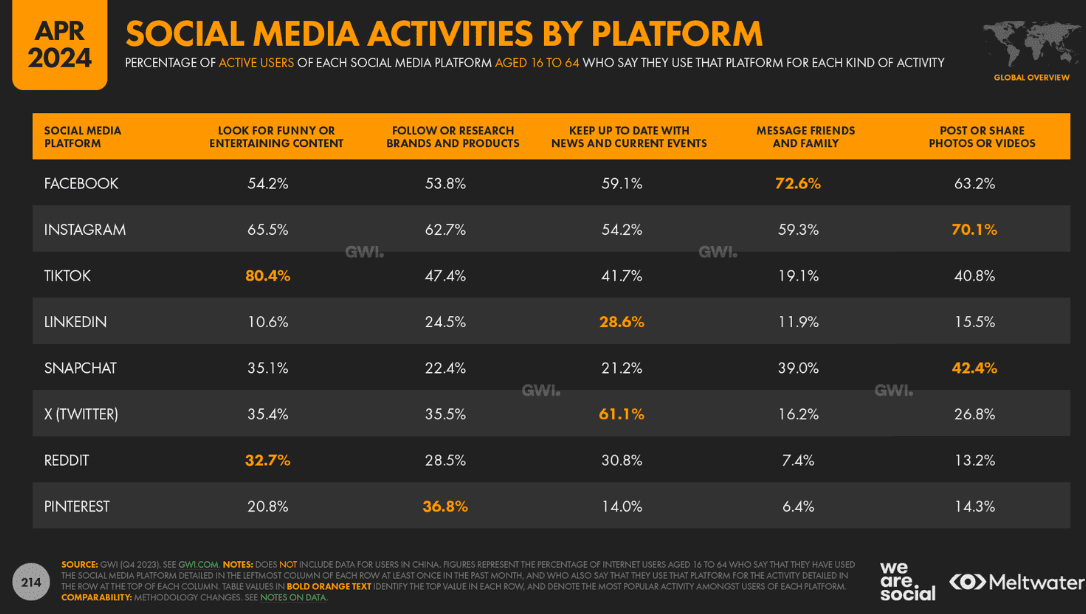
20. A mere 0.2% of Instagram users use only this platform; most are also active on Facebook (80.8%), YouTube (77.4%), and TikTok (52.8%). This highlights the need for a strong cross-platform marketing strategy.
21. According to Kepios, 70.4% of users use Instagram for posting photos or videos, while 64.8% enjoy seeking out entertaining and funny content.
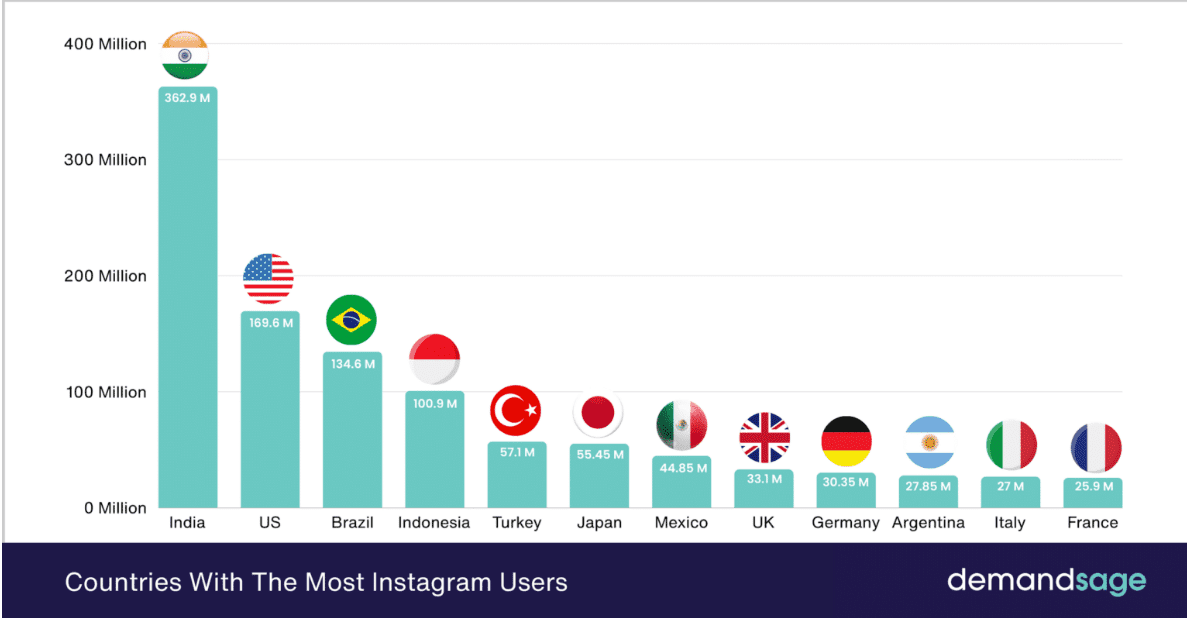
22. India boasts the highest number of Instagram users globally, with 362.9 million, followed closely by the United States at 169.65 million and Brazil at 134.6 million. These countries lead in terms of Instagram user numbers worldwide.
Source
Instagram Usage Statistics
Instagram continues to be a powerhouse in social media—with a significant number of users accessing the platform every day. This steady engagement shows just how much people love it and how it’s shaping the online scene.
Let’s check out some key stats that prove why Instagram is still a top pick for people all around the world.
23. People around the world spend an average of about 15 hours and 50 minutes on Instagram every month.
24. About 20% of all Instagram users—500 million—are on the app every day, and 21% pop in weekly. It’s a daily habit for a lot of us.
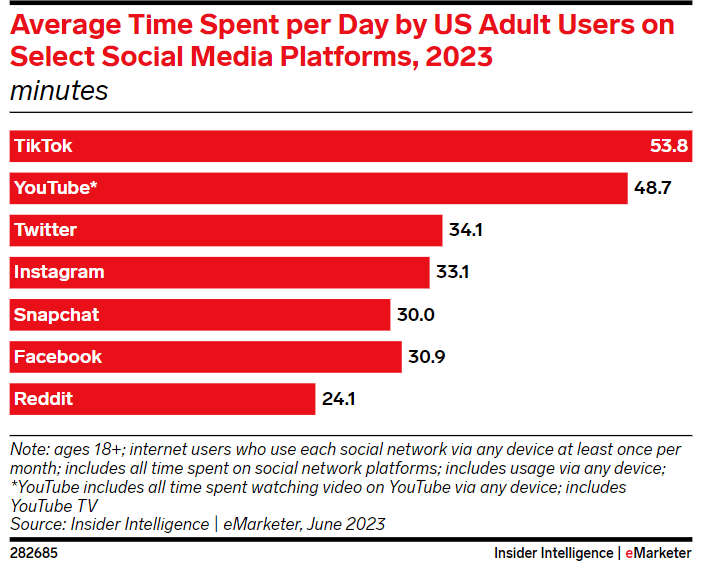
25. In the U.S., adults are checking Instagram for about 33.1 minutes a day now, which is 3 minutes more than last year.
Source
26. 38% of users are on Instagram multiple times a day. It’s like their go-to spot for keeping up with friends and trends.
27. Every single minute, a staggering 66,000 photos are shared on Instagram, showing the platform’s immense flow of creativity and content.
28. Nearly 70% of us use Instagram to share our own photos and videos. Plus 64% are always on the hunt for funny or interesting content and almost half of us use it for the latest news.
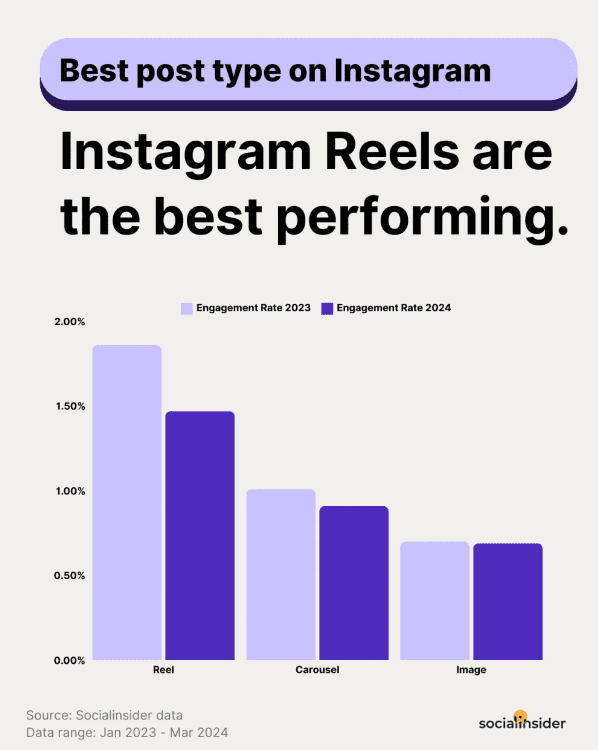
29. Photo posts are still ruling the engagement game on Instagram, proving that stunning visuals are the ultimate way to get people talking and liking.
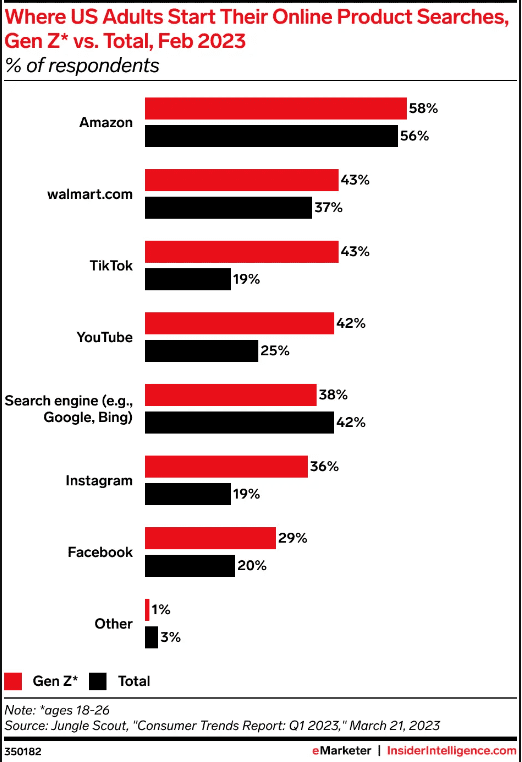
30. When it comes to shopping, 19% of adults in the U.S. start their search on Instagram. For Gen Z, it’s even higher at 36%.
Source
31. 70% of shoppers use Instagram to make online purchases, and 44% engage in shopping activities on the app every week.
32. Virtually all Instagrammers (99.9%) are active on at least one other social media platform.
33. Over half of us (58%) use Instagram to check out brands and products before buying.
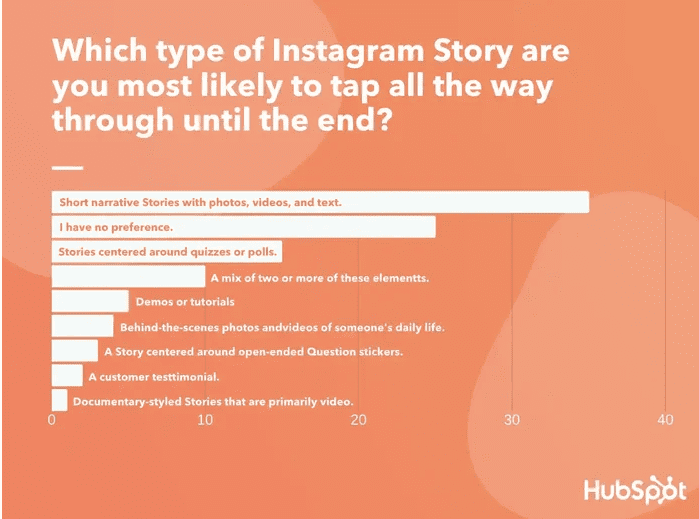
34. Over a third of Instagram users (35%) prefer Stories that blend photos, text, and video, showing a preference for engaging content formats.
Source
Instagram Growth Statistics
Since Instagram started back in 2010, it’s been gaining more and more users. Today, over two billion people use it regularly, and it’s been downloaded more than 3.8 billion times worldwide. This makes Instagram super important for influencers and marketers.
Now take a look at some of the key stats showing how much Instagram has grown.
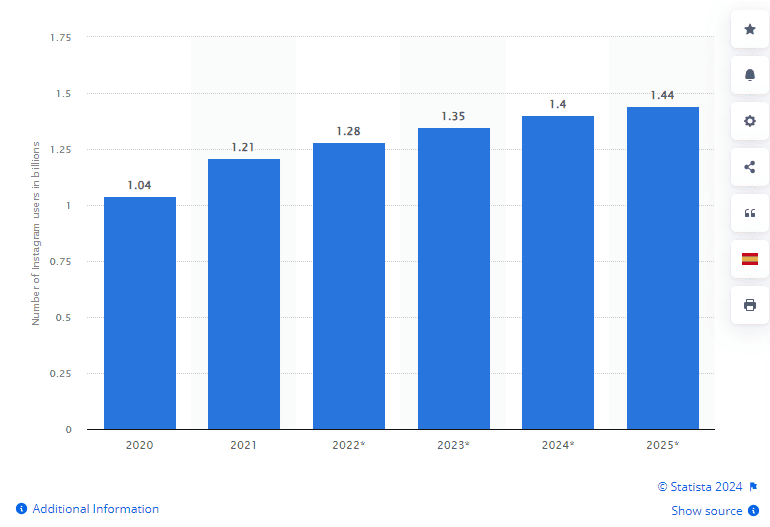
35. By 2025, Instagram is set to reach about 1.44 billion users worldwide.
Source
36. Influencer marketing is a huge driver behind Instagram’s growth. More than half of all marketers prefer using Instagram over TikTok for reaching their audiences through influencers.
37. Between January 2023 and January 2024, advertising on Instagram shot up from 1.4 million to 1.6 million—showing how businesses are investing big in reaching Instagram’s massive audience.
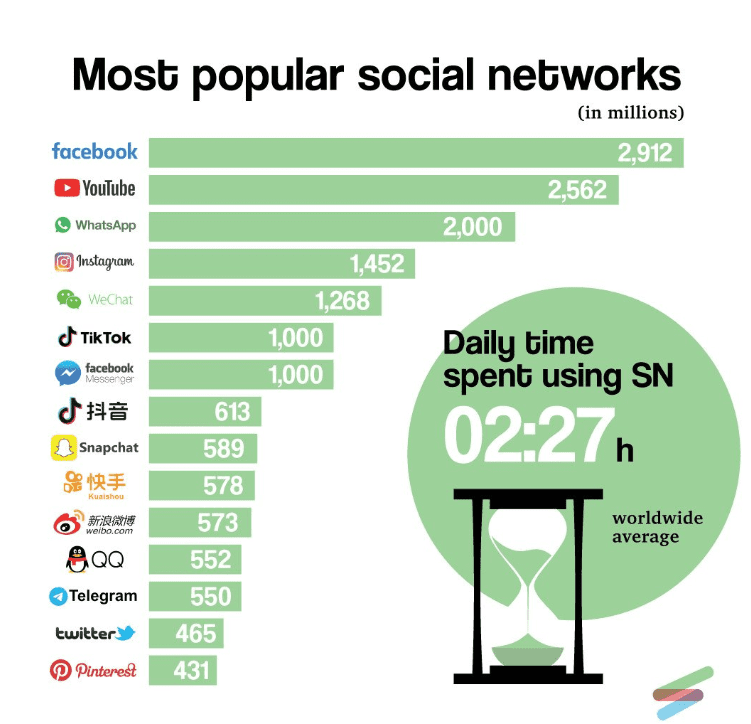
38. As of January 2024, Instagram is now the fourth most popular social media platform worldwide based on active users per month. It’s climbing higher, showing no signs of slowing down.
Source
39. Business accounts on Instagram are growing steadily, with an average monthly follower increase of +1.79%. That means more businesses are finding success and reaching new customers every month.
40. In 2024, the fastest-growing star on Instagram is influencer Danchmerk, gaining an impressive 1.584 million followers in just 8 months.
Instagram Advertising and Marketing statistics
Are you making the most out of your Instagram advertising efforts? Are you unsure if investing in Instagram marketing will benefit your brand? Let’s explore some key Instagram statistics to help you make informed decisions.
41. Instagram is the top pick for influencer marketing, with 80.8% of marketers planning to use it in 2024.
42. In 2023, about a third of marketers—29%—are putting their ad dollars into Instagram more than any other social media platform.
43. A solid 86% of marketers feel good about advertising on Instagram, thanks to its strong brand safety measures.
44. Heading into 2024, 24% of marketers are making Instagram a big part of their ad strategy, recognizing its effectiveness.
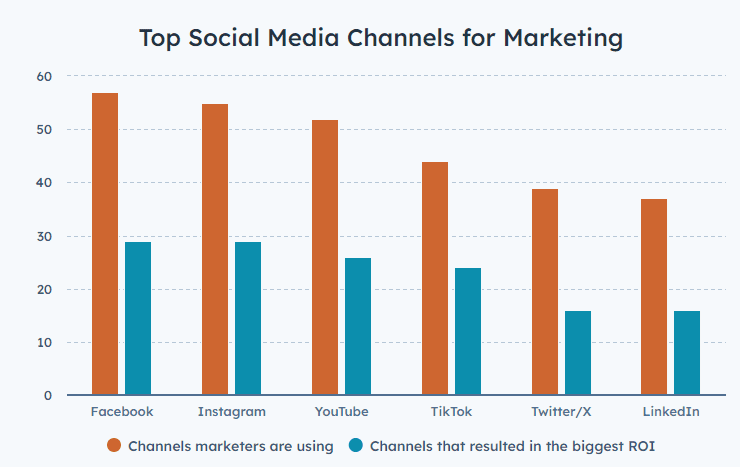
45. A strong 68% of marketers say Instagram brings them high returns on investment, with 21% saying it’s their top performer in 2024.
Source
46. Instagram ads can reach a massive 849.3 million users globally, making it a power hub for reaching lots of people.
47. According to Kepios, Instagram’s ad reach grew by 12.2% year-over-year, showing how it keeps getting bigger.
48. In 2023, Instagram pulled in a huge $50.58 billion from ads, with in-feed ads and Instagram Stories ads making a big impact.
49. Instagram ads get people clicking—with feed ads getting a Click-Through Rate (CTR) of 0.22% to 0.88%, and Stories ads getting 0.33% to 0.54%, showing they really grab attention.
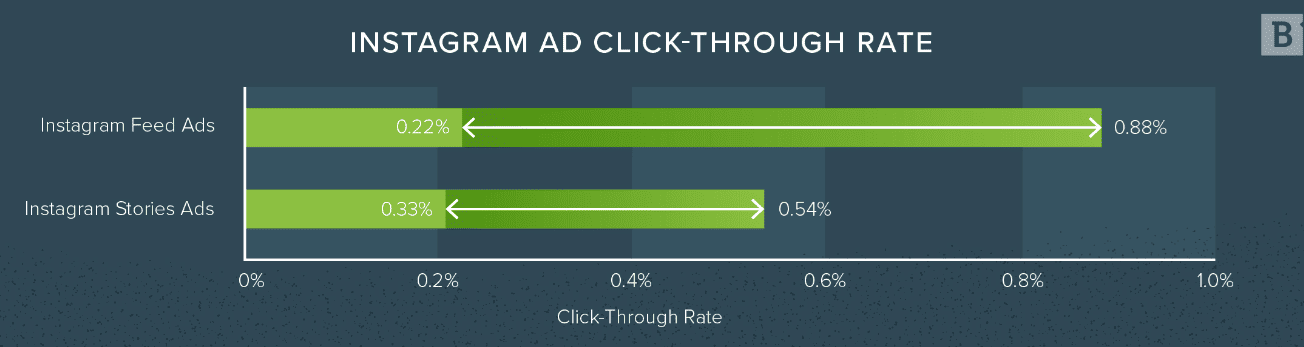
Source
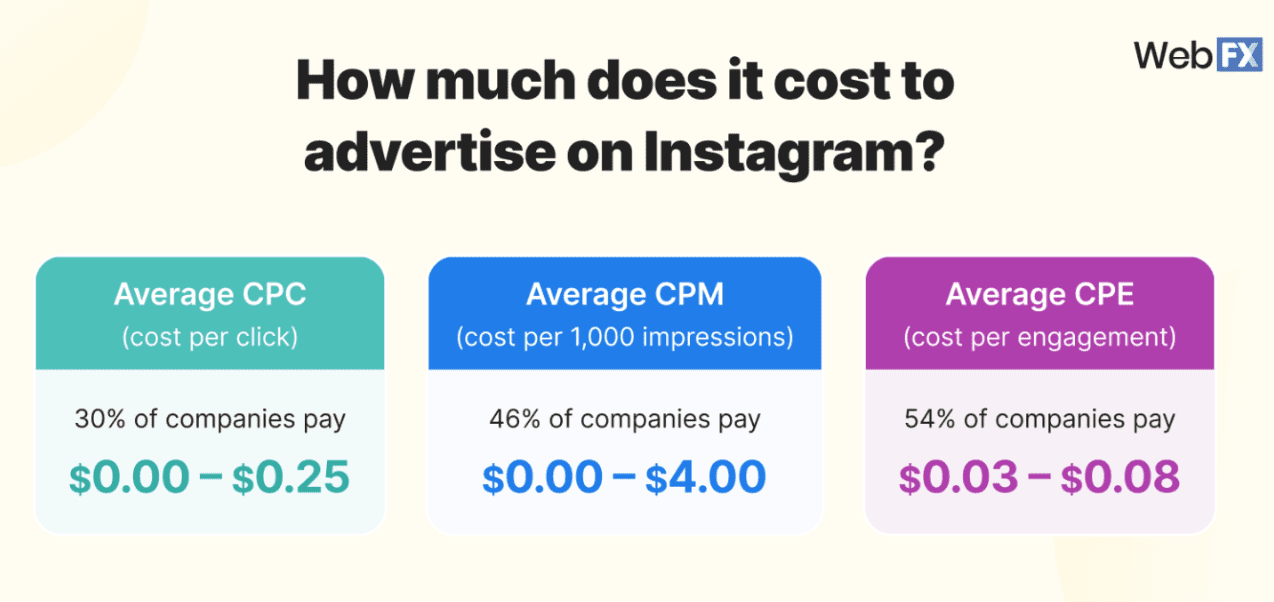
50. Businesses find Instagram ads cost-effective, with CPC (Cost Per Click) typically between $0.00 and $0.25, CPM (Cost Per 1,000 Impressions) ranging from $0.00 to $4.00, and CPE (Cost Per Engagement) from $0.03 to $0.08.
Source
51. Instagram Stories ads made up nearly 26.7% of the platform’s ad revenue in 2023, showing they’re becoming a big deal.
52. The 18-24 age group is Instagram’s biggest audience, so it’s a key group for brands looking to connect with younger audiences.
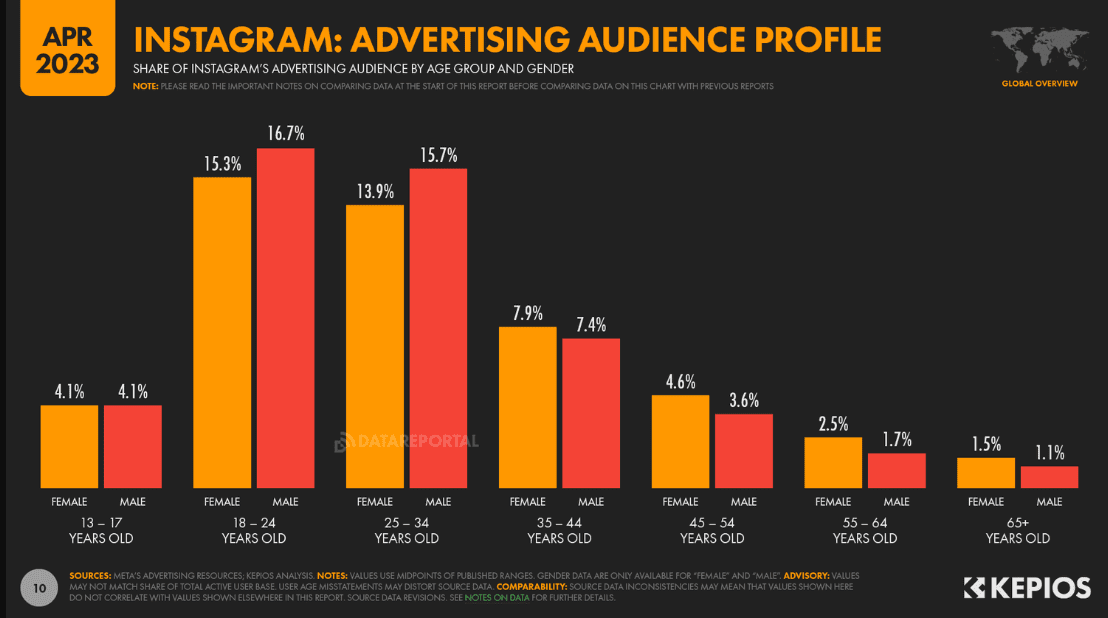
Source
53. India has the biggest Instagram ad audience at 180 million users, followed closely by the United States with 170 million and Brazil with 110 million.
54. Instagram is fighting fake accounts, which cost marketers about $1.3 billion each year—something they’re working hard to fix.
Instagram Stories and Reels statistics
Instagram Reels are brief videos that brands can use for creating ads, joining trends, and sharing information in a fun format. Instagram Stories help marketers to engage with followers beyond regular posts.
By adding some text, effects, and music to videos and stories—you can attract more viewers and boost your brand’s visibility.
These stats really show how Instagram Stories and Reels have become must-haves for any savvy marketer.
55. Instagram Stories can reach over 500 million people because half a billion users check out Stories every day.
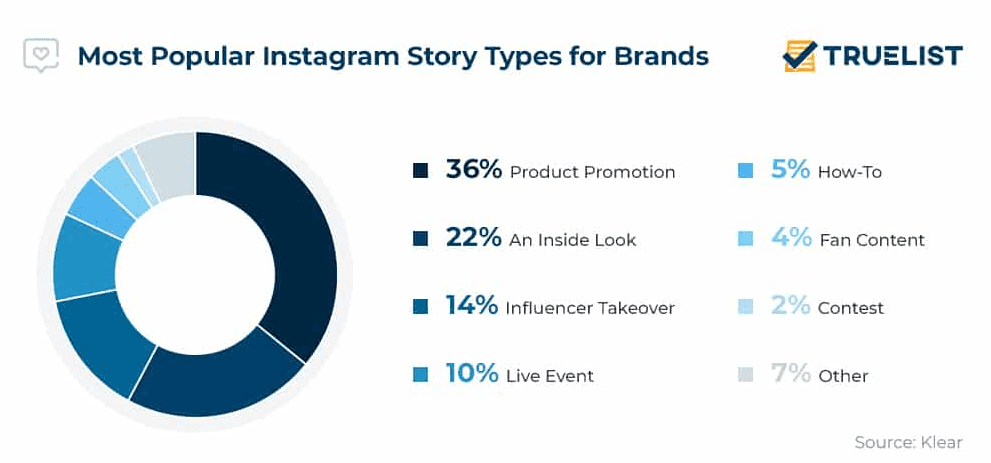
56. About 36% of brands on Instagram use Stories to promote their products, with an average of 10 Stories posted each month.
57. The top 25% of brands get an average tap-back rate of around 6.5% on their Stories.
Source
58. To keep good engagement and completion rates, Instagram suggests posting 2 Stories per day.
59. This year, 53.7% of U.S. marketers will use Instagram Reels for influencer marketing—making it even more popular than TikTok and YouTube for this purpose.
60. Meta says Reels are the most shared format in Instagram DMs. Since shares are a key engagement metric, making engaging Reels is one of the best ways to connect with your audience.
Source
61. A Socialinsider study found that Reels have an average reach rate of 30.81%, which is double the reach of other content formats. Reels also get twice as many impressions as other post types.
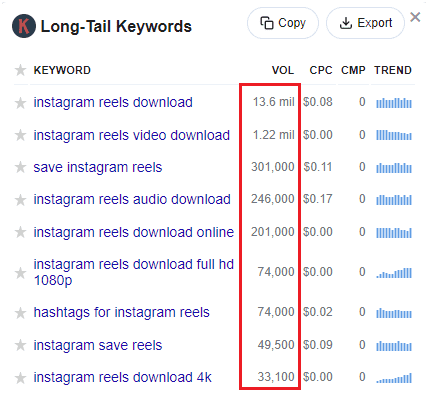
62. According to Keywords Everywhere, there is a high search volume for all keywords related to downloading Instagram reels. This indicates the growing popularity of these videos, as people want to save and share them.
Instagram Threads Statistics
Instagram introduced Threads to jump into text-based conversations and take on Twitter. Threads made history by hitting 1 million users within just one hour of its launch! This shows how useful this platform is for marketers.
Let’s dive into some key stats about Instagram Threads and see why marketers should focus on this channel.
63. Instagram’s Threads has over 15 million monthly active users.
64. The app’s user base reached 100 million by the end of its first week after launch and 150 million by the second week.
65. India leads with the most Threads users. Over 54 million users downloaded Instagram Threads in July 2023—making up about 33.5% of all users at that time.

Source
66. By 2026, Threads is expected to generate $11.3 billion in revenue.
67. “Threads, an Instagram app” has been downloaded over 5 billion times on Google Play Store.
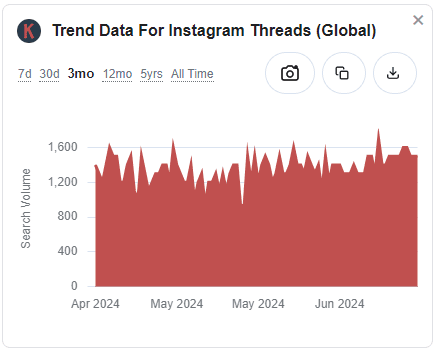
68. According to the Keywords Everywhere widget, the trend data for Instagram Threads has been steadily increasing over the last three months, indicating a growing interest in this topic.
Instagram for Business Statistics
Not sure if Instagram is a good move for your business? Trust us, it totally is! Whether you’re running a cozy local shop or a big global brand, Instagram is key for boosting your business. You’ve got ‘Shop Now’ tags and sponsored stories, but that’s just the start.
Dive into these stats to see how businesses are leveraging Instagram and the innovative ways they’re transforming digital marketing.
69. 70% of shoppers check out Instagram before making a purchase, based on Instagram’s own data.
70. About 62.7% of Instagram users follow brands and research products on the app. It’s the third most popular thing people do on Instagram, showing how it influences what we buy.
Source
71. On average, an Instagram Business account posts 1.55 times a day on its main feed. Photos make up 41.7% of these posts, videos 38.2%, and carousel posts 20%.
72. The posts that get the most love on Instagram are Carousels, with an engagement rate of 0.76% for business accounts.
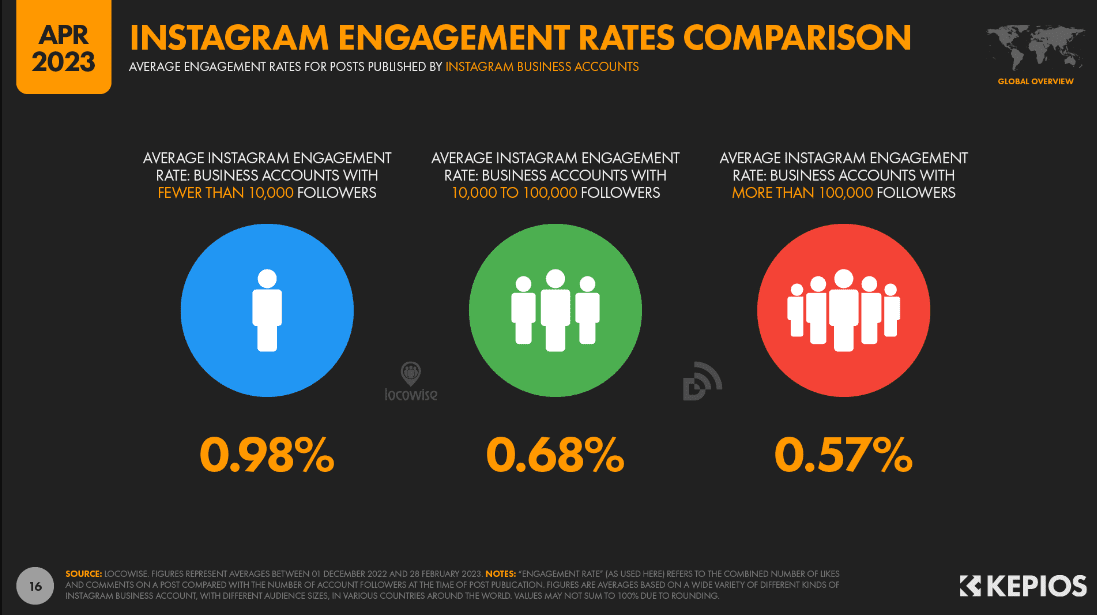
73. Small business accounts with less than 10,000 followers see an average engagement rate of 0.98%. Accounts with 10,000 to 100,000 followers get around 0.68%, and big accounts with over 100,000 followers average about 0.57% engagement.
Source
74. Businesses using Instagram DMs to chat with local customers score a very high 70% conversion rate, according to Meta.
75. If you tag products in your Instagram posts, you could see 37% more sales compared to those who don’t bother tagging.
76. Over 150 million people use Instagram every month to message businesses directly.
Instagram Influencer Statistics
Instagram is really making its mark in influencer marketing these days. Lots of brands are jumping on board to run their influencer campaigns right here. Check out these important stats about Instagram and influencer marketing:
77. Instagram is the top spot for influencer marketing, with 80.8% of marketers planning to use it in 2025.
78. Right now, 72% of marketers are all about Instagram for their influencer campaigns.
79. Marketers drop a massive $8 billion every year on Instagram influencers alone.
80. About 37% of Instagram users check out influencers regularly.
Source
81. Instagram has over half a million active influencers doing their thing.
82. Women dominate as 77% of all Instagram influencers.
83. There are around 157 million micro-influencers on Instagram.
84. Brands often go for micro-influencers, who usually have 50,000 to 100,000 followers, to push their products.
Source
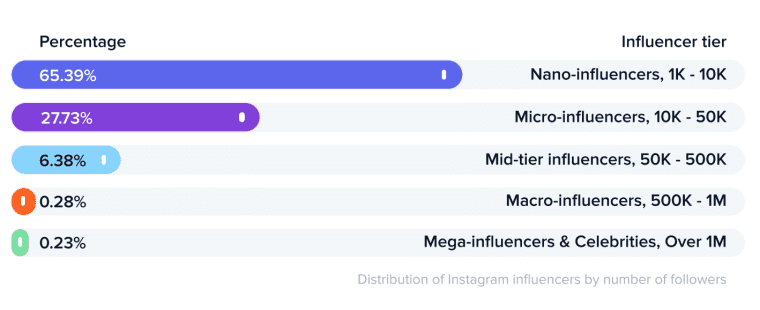
85. Nano influencers, with 1,000 to 10,000 followers, make up 65.4% of all Instagram influencers.
86. These nano-influencers get the most engagement, hitting a high 5.6% rate.
87. Mega-influencers and celebs with over 1 million followers are just 0.23% of the Instagram influencer scene.
Source
88. The Instagram influencer industry is set to hit $22.2 billion by 2025.
89. Brands get $4.12 in media value for every $1 they spend on Instagram influencer marketing.
90. In 2024, the average cost of an Instagram sponsored post is $418, up 15.17% from last year.
91. 30% of marketers believe that Instagram provides the highest return on investment (ROI) for influencer marketing.
Conclusion
These Instagram stats highlight how much the platform is growing and evolving. It’s not just about more people using it—Instagram keeps adding new stuff that makes it even more useful for businesses. And working with influencers? That’s a big deal because they help spread the word about products in a way that feels real and relatable.
Whether you’re posting a regular photo, trying out Reels to show off your creativity, or sharing Stories to connect with your audience, knowing how to use Instagram well can really boost your marketing game and help you reach more people who love what you do.