Have you ever stopped to think about how much of your day is spent in front of a screen?
From endless meetings to scrolling reels on Instagram, screens have become a constant part of our lives. Studies show that global screen time averages around 6 hours and 40 minutes daily, and the numbers are still climbing.
This growing trend is very concerning as it has many negative effects on our health, focus, and overall happiness.
Research has linked heavy screen use to problems like poor sleep, lower grades, anxiety, and even depression.
Let’s take a closer look at the latest screen time stats and see how deeply screens shape how we live.


Top Screen Time Stats
Screen time has become a huge part of everyday life for people around the world, and whether it’s checking social media, watching videos, or working on a laptop, most people now spend a big part of their day in front of a screen without even thinking about it.
Let’s take a look at the top screen time stats:
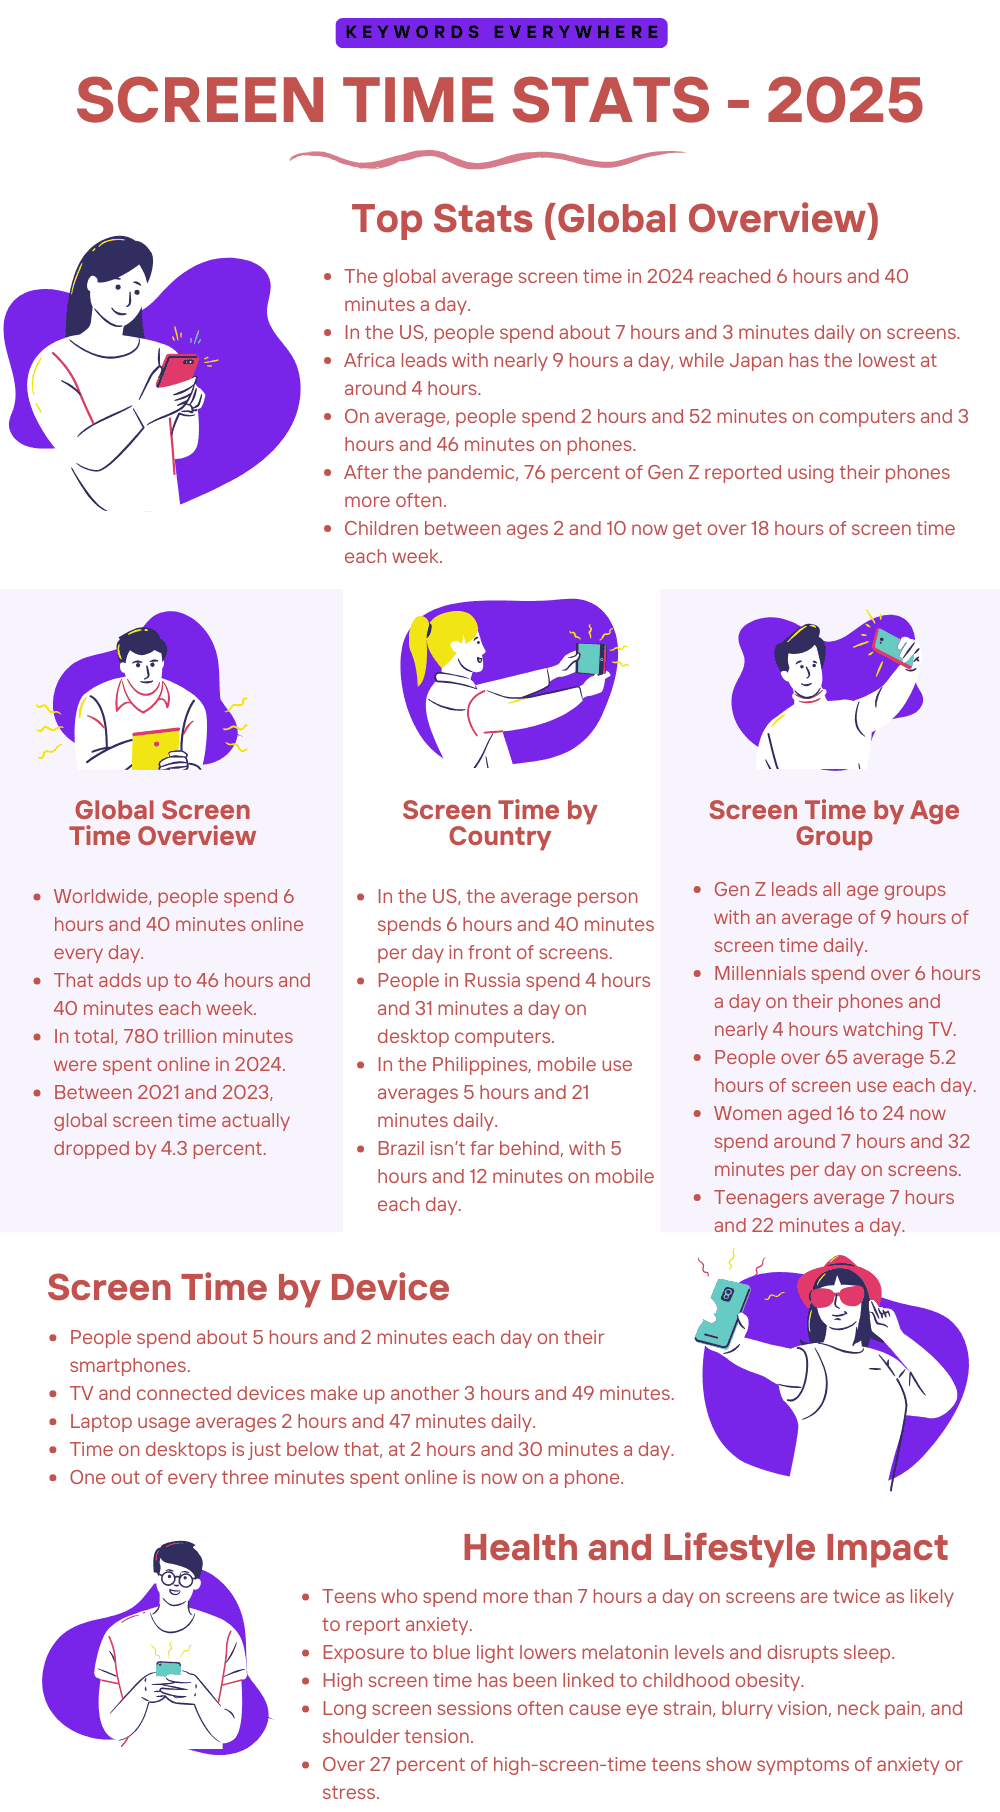
1. In 2024, the average daily screen time is 6 hours and 40 minutes, which is 17 minutes more than in 2015, showing that people are spending even more time on their screens now.
2. The highest daily screen time is in an African country, where people spend almost 9 hours on screens, while Japan has the lowest average at just over 4 hours a day.
3. In the United States, people spend 7 hours and 3 minutes on screens each day, making it one of the countries where screen use is very high.
Screen time in the USA
4. On average, people spend 143 minutes daily on social media, with 67 minutes on TikTok, 55 minutes on YouTube, and 39 minutes on Facebook.
5. A survey found that Gen Z spends the most time on their phones, using them for more than six hours daily, while Baby Boomers spend about three and a half hours daily.
6. Around the world, users spend about 2 hours and 52 minutes each day looking at computer screens and about 3 hours and 46 minutes on their phones.
7. After COVID-19, computer and mobile screen usage increased a lot around the world, with 76% of people aged 16 to 24 now spending more time on their phones and 45% using their laptops more often.
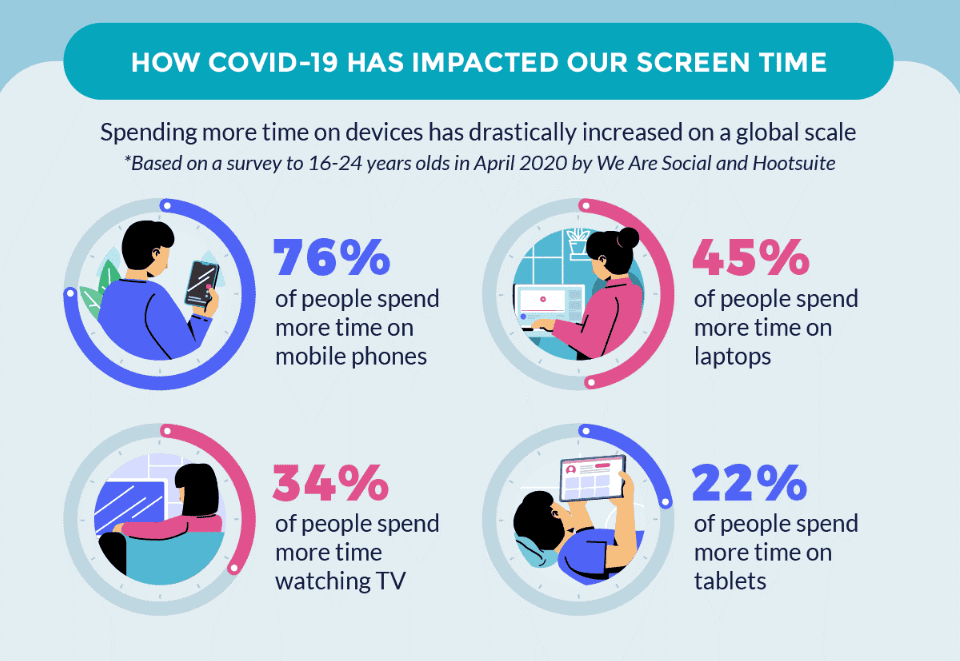
Impact of COVID-19 on screen time
8. Kids aged 2 to 10 years are spending about 18.6 hours every week doing activities that involve screens, which is a big part of their week.
9. Females aged 16 to 24 are spending an extra 8 hours daily on computer screens, and their male counterparts are paying about the same amount of time.
10. In the US, children’s entertainment screen time rose from 4 hours and 44 minutes daily in 2019 to 5 hours and 33 minutes daily in 2021.
11. Behavioural Optometrist Bhavin Shah explained that staring at screens for long periods can cause blurry vision, a higher need for glasses, eye discomfort, and problems with performance at work, plus it can also strain the neck and shoulders.
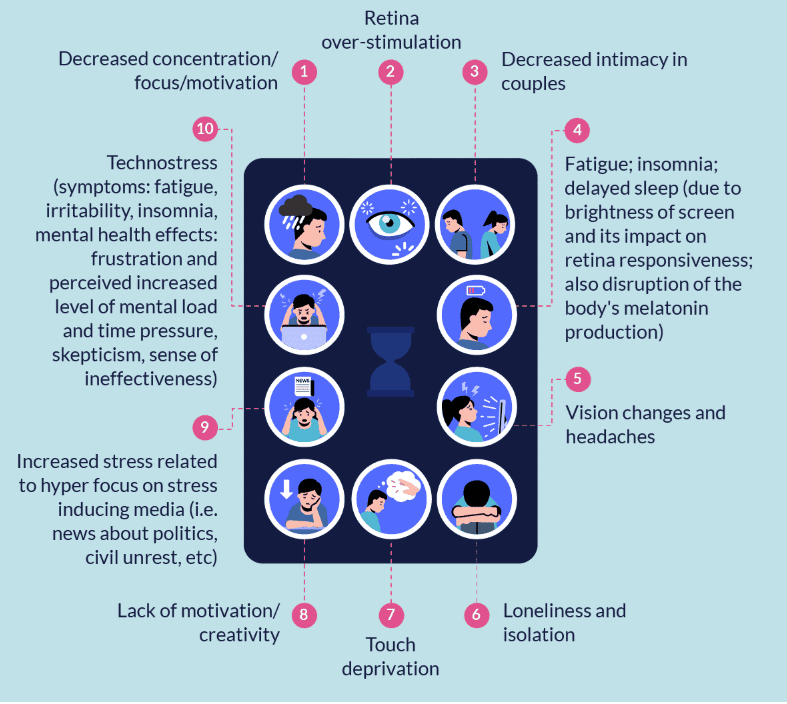
Negative effects of devices on health
12. The negative effects of too much screen time are not just about physical discomfort, as it has also been linked to very high stress levels, feeling less motivated, and experiencing more loneliness.
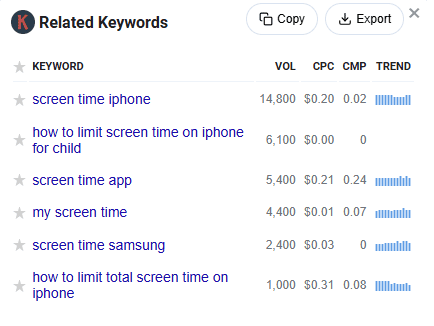
13. According to Keywords Everywhere, over 6000 people search every month for “how to limit screen time on iPhone for a child,” showing how worried many parents are about their kids’ screen habits.
Global Average Screen Time Stats
The amount of time people spend looking at screens each day has been growing steadily in almost every country.
It has now become normal to spend several hours a day using phones, computers, tablets, and TVs, making screen time one of the biggest parts of modern daily routines.
The following stats will reveal the alarming global average screen time:
14. Ongoing research from GWI shows that as of 2024, the average internet user spends 6 hours and 40 minutes online every day.
15. This daily screen time adds up to about 46 hours and 40 minutes each week for internet users around the world.
16. Daily screen time has gone up by almost 1% compared to 2023, when people were spending an average of 6 hours and 36 minutes each day using connected technology.
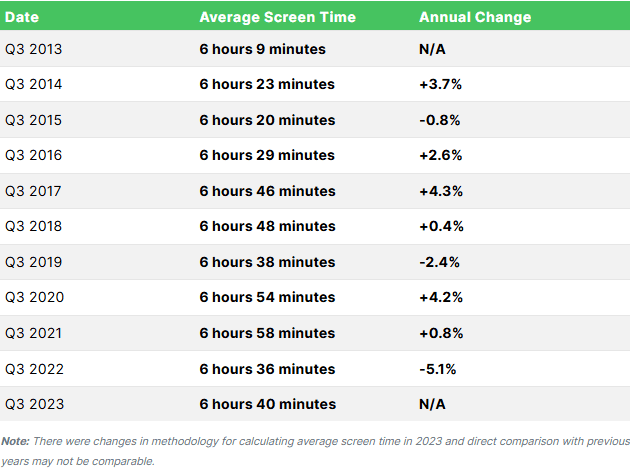
Global average screen time
17. Between 2021 and 2023, there was a drop in average daily screen time by about 4.3%, which is roughly 18 minutes less each day.
18. With users spending an average of 400 minutes online daily, the world will spend 780 trillion minutes on screens in 2024, almost the same as 1.5 billion years of human life combined.
Screen Time By Country
Screen time habits can look very different depending on where you live.
While some countries have extremely high daily averages, with people spending most of their free time online, others have slightly lower numbers, often because of lifestyle differences, work habits, or even cultural attitudes toward technology.
Here are the important screen time stats you should know:
19. According to DataReportal, the average American spends about 6 hours and 40 minutes looking at a screen daily, which is 2 minutes above the global average and over an hour more than people in Britain, who average 5 hours and 36 minutes daily.
20. Russians spend the most time on desktop screens, averaging 4 hours and 31 minutes each day on their computers.
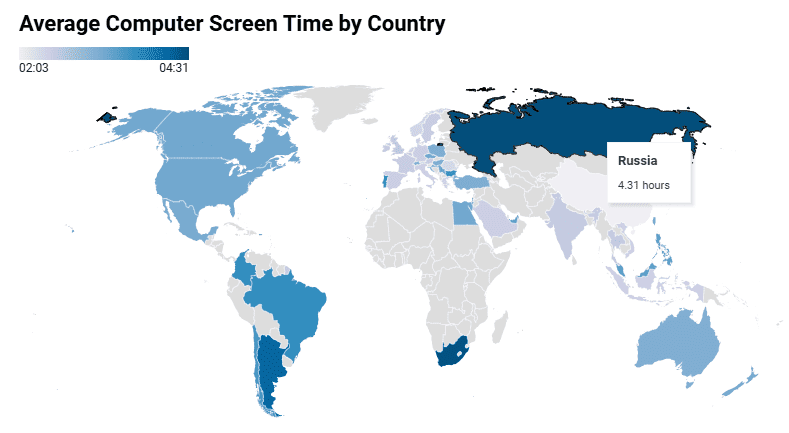
Average computer screen time by country
21. Filipinos spend the most time on mobile screens, looking at them for 5 hours and 21 minutes a day, which is 1 minute more than their 2024 average.
22. Brazilians and South Africans are close behind, with Brazilians spending 5 hours and 12 minutes and South Africans spending 5 hours and 11 minutes a day on their mobiles.
23. If people sleep 8 hours a night, it means the average person spends almost 42% of their waking hours looking at a screen, while South Africans spend more than 60% of their waking time on a computer or mobile.
24. Most countries (27 out of 49) managed to cut down their screen time this year, with Hong Kong seeing the biggest drop, where the average person reduced their screen use by 50 minutes.
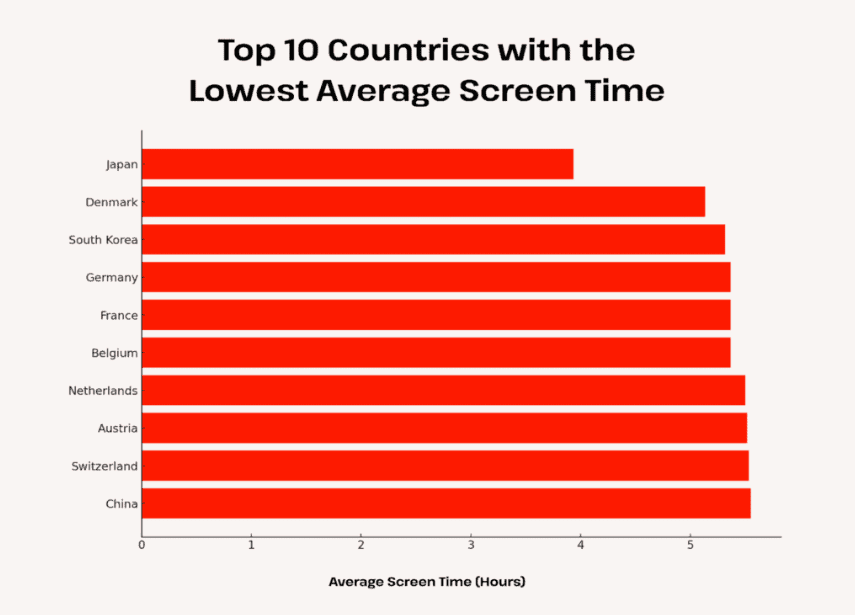
Countries with the lowest average screen time
25. However, 22 countries ended up spending more time on screens than last year, with Russia seeing the biggest increase by 17 minutes and Turkey right behind with a 16-minute rise.
26. Even though Egyptians are among the heavy screen users, they managed to cut their average screen time by 29 minutes, from 7 hours and 55 minutes down to 7 hours and 26 minutes.
27. Saudi Arabians spend the highest portion of their screen time on social media, with 42.89% of their screen use going to it, closely followed by Indonesians at 42.63%.
28. In the US, 32.25% of screen time is spent on social media, which adds up to about 2 hours and 9 minutes each day, while British users spend 1 hour and 37 minutes on social media, making up just under 30% of their daily screen time.
29. A large part of screen time in many countries is spent streaming TV, with Chileans and Filipinos leading the way as 98.1% of their populations use the internet to stream TV, closely followed by people in Greece, Mexico, and South Africa.
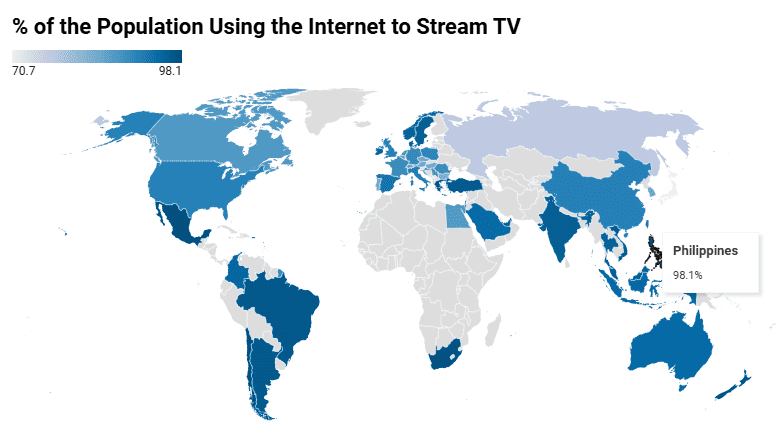
Percentage of countries using the internet to stream TV
Screen Time By Age
Younger people tend to spend much more time on screens than older generations, and teenagers are especially often deeply connected to their devices for social media, gaming, and entertainment.
In contrast, older adults still use screens regularly but usually balance their time a bit differently between work, news, and leisure.
Here are the screen time stats that show how much time different age groups spend on screens:
30. Younger people spend more time on screens than older age groups, with women aged 16–24 using internet-connected devices for about 7 hours and 32 minutes daily, and men the same age averaging 7 hours and 4 minutes, while users aged 55–64 spend much less, averaging around 5 hours and 17 minutes for women and 5 hours and 14 minutes for men.
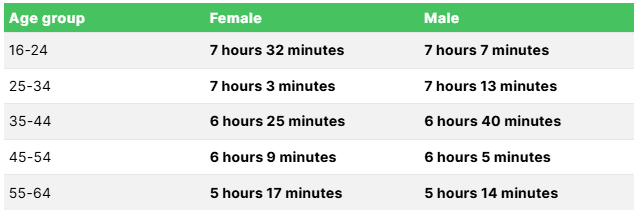
Screen time by age
31. Adults between 18 and 34 years old average 8.8 hours of screen time per day, compared to just 5.2 hours for adults aged 65 and above.
32. Gen Z spends 9 hours a day in front of screens, which is nearly 2 hours more than both the US and global daily averages.
33. Teenagers now average around 7 hours and 22 minutes of screen time each day, making up about 43% of their waking hours. This is a noticeable jump from 6 hours and 40 minutes in 2015 and rose even more to around 8 hours and 39 minutes by 2021 due to higher digital engagement.
34. Black non-Hispanic teenagers are the most likely to spend 4 or more hours on screens daily, with 60.4% reporting this level of use, compared to teens from other racial or ethnic backgrounds.
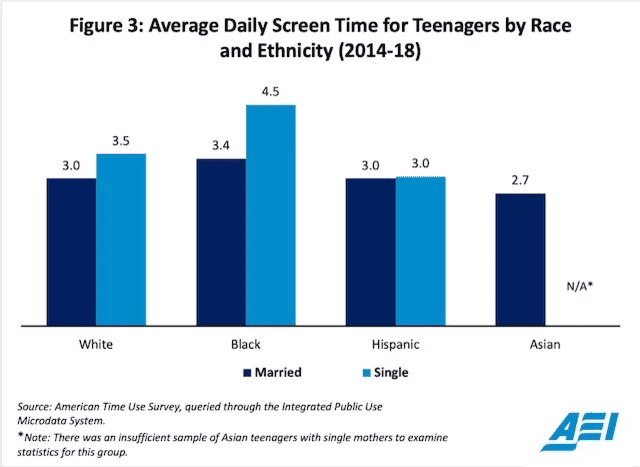
Average screen time for teenagers by race and ethnicity
35. Teens in metropolitan areas are more likely to spend 4 or more hours on screens daily than those living in rural or nonmetropolitan regions.
36. Around 1 in 4 teens who spend 4 or more hours daily on screens have reported signs of anxiety (27.1%) or depression (25.9%) in the past two weeks.
37. The most common screen used by young children is the television, with 88% of parents saying their child has used or interacted with one. A large number also reported their child using a tablet (67%) or smartphone (60%).
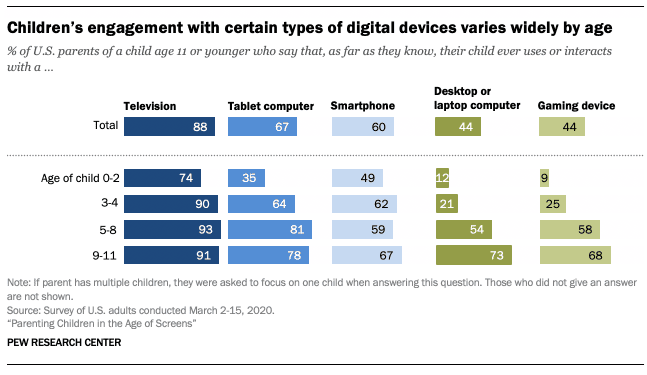
Children’s engagement with digital devices, by age
38. The American Academy of Pediatrics recommends children and teens limit their screen time to no more than 2 hours per day, showing just how serious the concerns are about too much screen use in younger age groups.
Screen Time By Device
Phones have become the number one device when it comes to daily screen time, with most people reaching for their smartphones first thing in the morning.
At the same time, computers, laptops, tablets, and TVs are still widely used but are slowly taking a back seat to smaller, more portable screens.
Here are the screen time stats that show how much time users spend on different device screens:
39. Smartphones now account for almost one-third of all the time people spend online, with users averaging about 5 hours and 2 minutes per day on their phones, most of that just browsing social media.
40. Connected TVs are the next most-used device, with people spending an average of 3 hours and 49 minutes daily watching content on them.
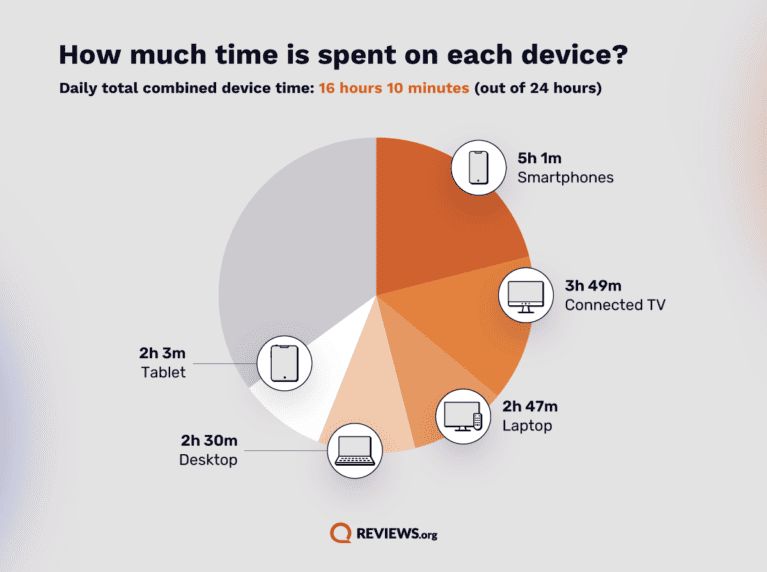
Average screen time by device
41. Computers get less attention overall, but desktop use isn’t disappearing completely—people spend around 2 hours and 47 minutes daily on laptops and about 2 hours and 30 minutes on desktops.
42. Streaming TV alone takes up about 3 hours of the average American adult’s day, while social media browsing isn’t far behind, coming in at around 2 hours and 43 minutes each day.
43. Most of the time people spend online is used for watching videos, whether it’s shows, movies, or short-form content—even though social media tends to feel more interactive or productive.
44. Baby Boomers spend most of their screen time watching TV through connected devices, but smartphone use still ranks high for them too.
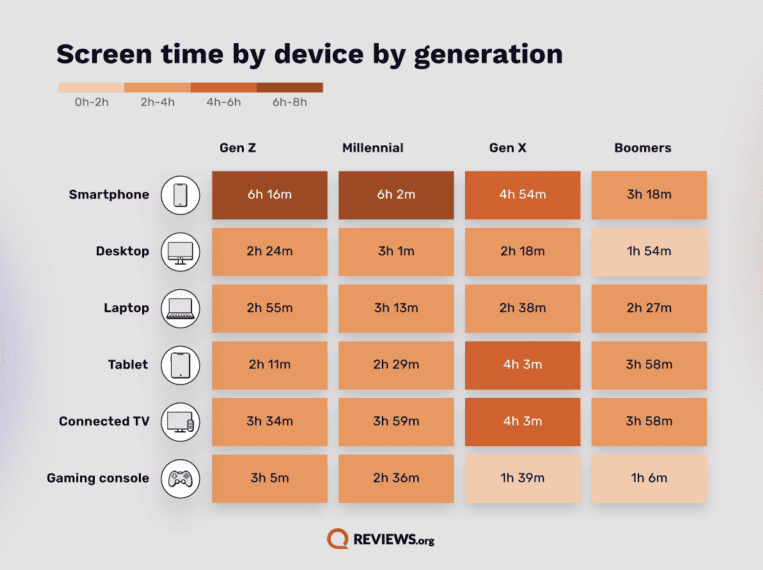
Screen time by device by generation
45. Gen X watches the most TV out of all generations but still ends up spending more time overall on smartphones.
46. Millennials spend more than six hours daily on smartphones, plus another four hours watching TV, and they still manage to find time for gaming and computer use.
47. Zoomers (Gen Z) use smartphones more than any other group but still clock about the same amount of TV time as other generations.
Screen Time Impact Statistics
Spending long hours in front of screens every day has started to show real effects on people’s health and well-being.
While screens make life easier and more fun, heavy use has been linked to issues like trouble sleeping, feeling stressed, having sore eyes, and even higher chances of feeling anxious or lonely over time.
Here are the stats that explain the impact of screen time:
48. Studies show that adolescents who spend more than 7 hours a day on screens are over twice as likely to report feeling anxious or even depressed compared to peers who spend less time on screens.
49. There’s also a clear link between screen time and obesity among children between the ages of 5 and 17, which is likely due to the sedentary lifestyle that comes with long hours of screen use.
50. In the UK, research found that children aged 9 to 10 who spend over 3 hours a day on screens were more likely to show signs of insulin resistance.
51. HMS researchers have shown that using devices with blue light, like smartphones, before bedtime can mess with sleep patterns by lowering melatonin levels, which is the hormone that helps you fall asleep.
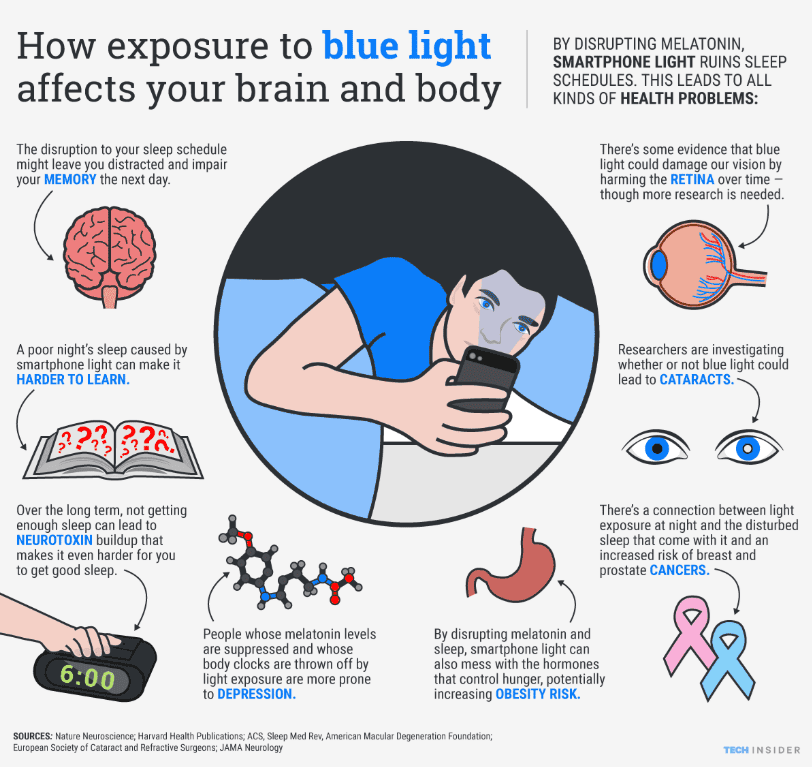
Impact of screen time on brain and body
52. Besides physical issues, screen overuse is tied to mental and cognitive problems like worsened mental health, trouble with executive functioning, and higher rates of depression and anxiety, especially among 14- to 17-year-olds spending 7 or more hours a day on devices.
53. CDC analysis shows that around 27.1% of teenagers with high screen time experience anxiety symptoms, and 25.9% deal with depression, making it a big concern.
54. Even though 72% of U.S. teens say they feel peaceful without their smartphones, 44% also admit to feeling anxious without them, showing how screen time can create a complicated relationship with mental well-being.
55. It’s not all negative—one 2018 study found that using digital media like games for anxiety relief worked better than valium, showing that when used right, technology can actually help manage anxiety.
Conclusion
In conclusion, screen time is a big part of life today, and it is not going away anytime soon. While screens bring a lot of good things, it is clear that too much time on them can cause problems for our health and well-being.
By paying attention to how much time we spend on devices and making small changes, we can enjoy the benefits that technology brings without letting it take over our lives.
Moving forward, finding a better balance between screen use and real-world activities will help people of all ages live healthier and happier lives.