Do you shop online, or do you shop on social media?
And—
Is your brand just scrolling on socials, or is it selling?
Let’s break this down.
Social media has transformed into much more than a place for selfies and status updates. It’s now a powerful marketplace, and social commerce is leading the charge.
It’s no longer just about likes and shares—it’s about clicks and carts.
But is social commerce the future of online shopping or just another buzzword?
In this article, we’ll explore the world of social commerce and uncover the top social commerce stats to show how brands like yours can thrive in this exciting space.
What is social commerce?
First things first. Before diving into the stats, let’s get a clear understanding of what social commerce is all about.
Social commerce is about buying and selling goods or services directly on social media platforms.
It goes beyond the traditional role of social media in helping users discover products. Instead, it allows them to complete the entire purchase journey—discovery to checkout—without ever leaving the platform.
In other words, users can shop right where they scroll without switching apps.
Top social platforms like Facebook, Instagram, Pinterest, and TikTok now offer specialized tools to help businesses tap into this trend.
With features like in-app storefronts, brands can create a smooth shopping experience for customers to browse and buy products without ever needing to visit another site.
Let’s go to the top social commerce stats.
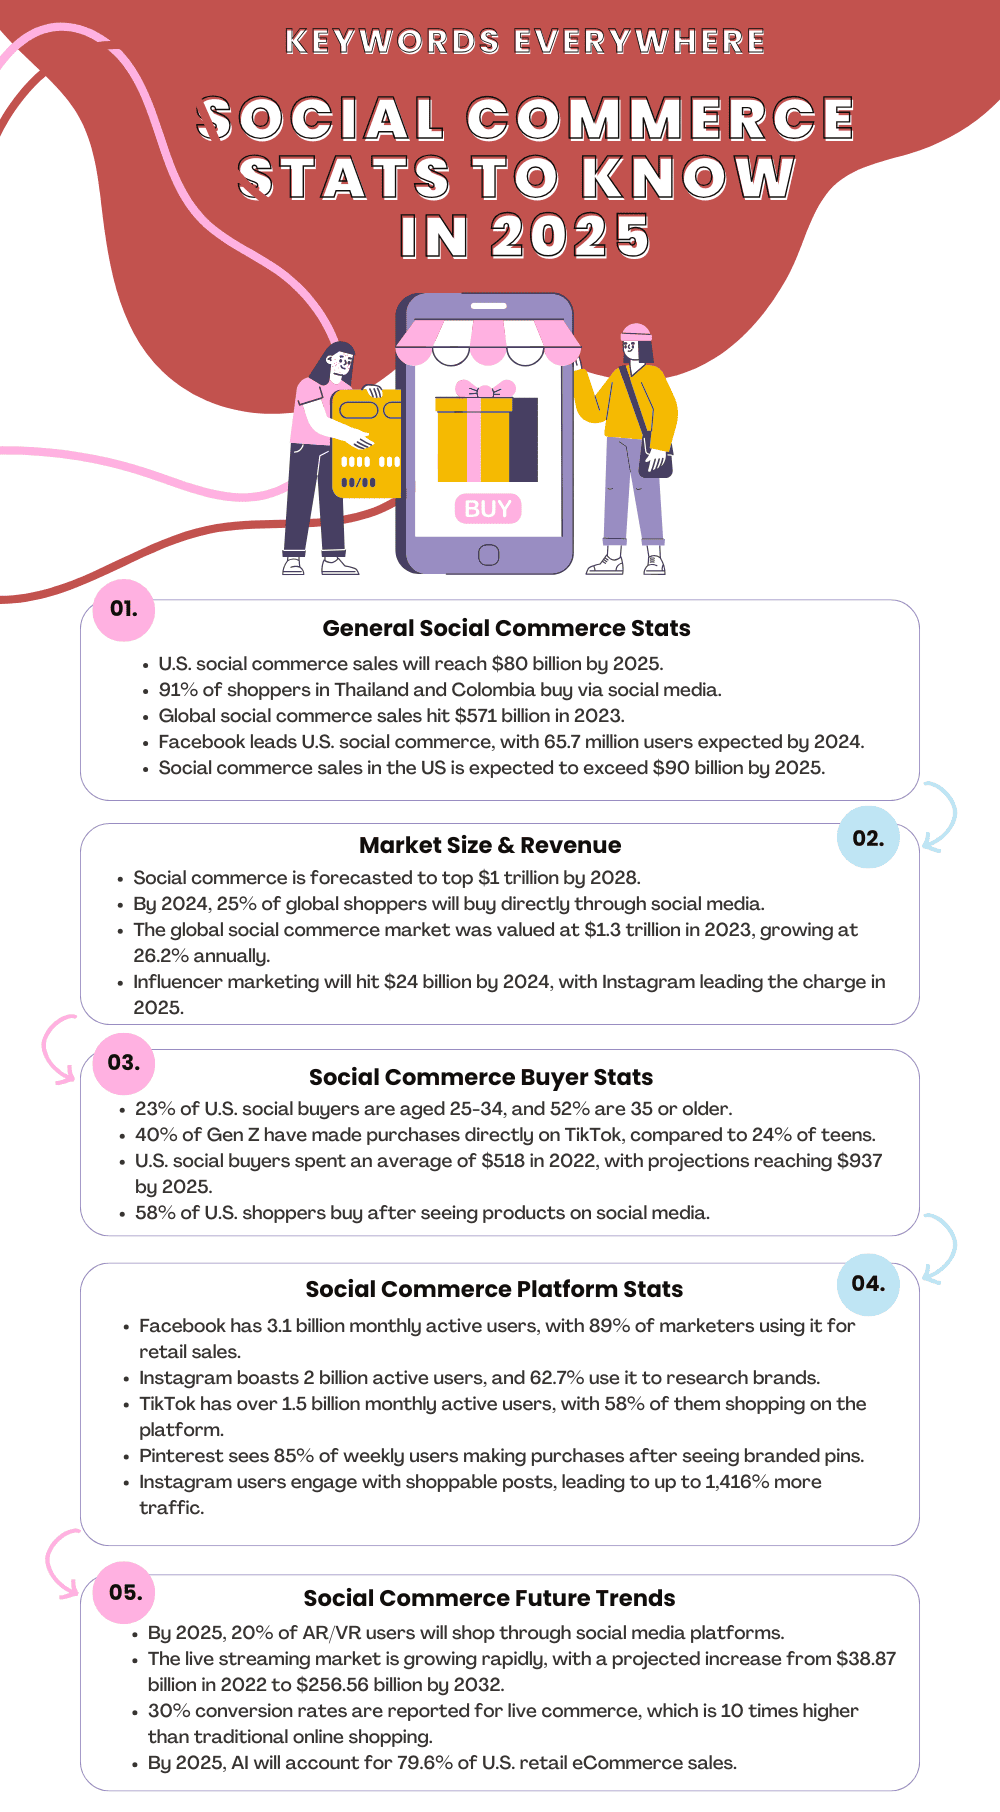
General Social Commerce Stats
Social commerce may still be a newcomer in the world of digital shopping, but it has definitely turned heads.
While it hasn’t completely revolutionized ecommerce—traditional online shopping remains more popular—it has created exciting opportunities and tackled lots of challenges for both businesses and consumers.
So what’s the deal with social commerce right now?
We’ve rounded up the latest social commerce stats, and here’s what we found:
1. In the U.S., social commerce sales are expected to hit nearly $80 billion by 2025. With 4.89 billion people using social media, it’s a no-brainer for brands to get noticed by more customers.
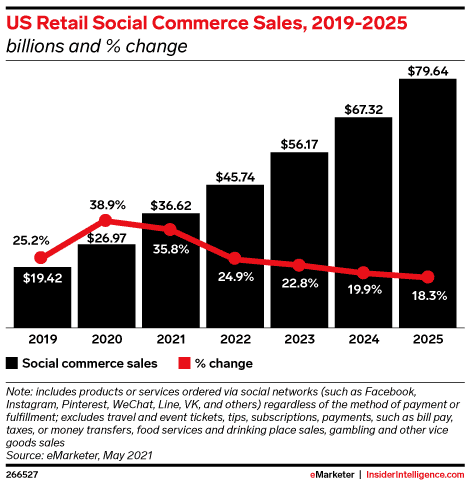
US social commerce sales 2019-2025
2. Globally, social media-driven shopping is booming, with revenues predicted to reach almost $700 billion in 2024—a 23% jump from the previous year.
3. Some countries are leading the pack when it comes to social shopping. In 2023, 91% of online shoppers in Thailand and Colombia bought through social media. China wasn’t far behind at 90%, followed by the UAE and India.
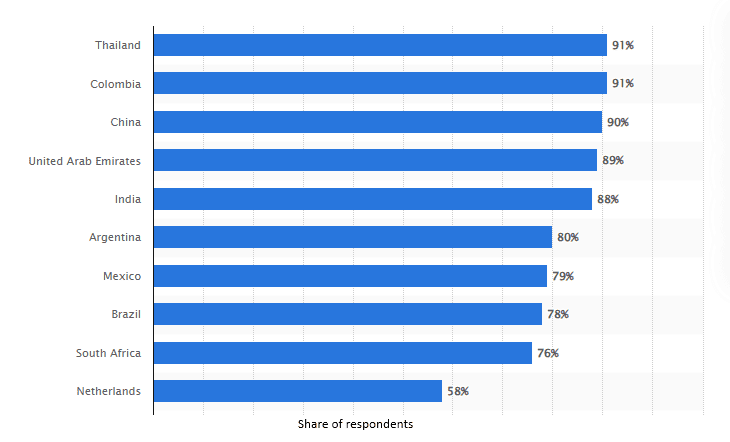
Percentage of online consumers buying from social networks
4. Worldwide, social commerce brought in around $571 billion in 2023. With revenues growing at an impressive 13.7% yearly, this figure is set to cross the $1 trillion mark by 2028.
5. The average person hops between seven different social networks every month and spends about 151 minutes a day on social media. That’s a lot of time for brands to make an impression!
6. Facebook is the top social commerce platform in the US, with an estimated 65.7 million people expected to shop through it. It also remains the most popular social media network, used by 74.2% of the US adult population.
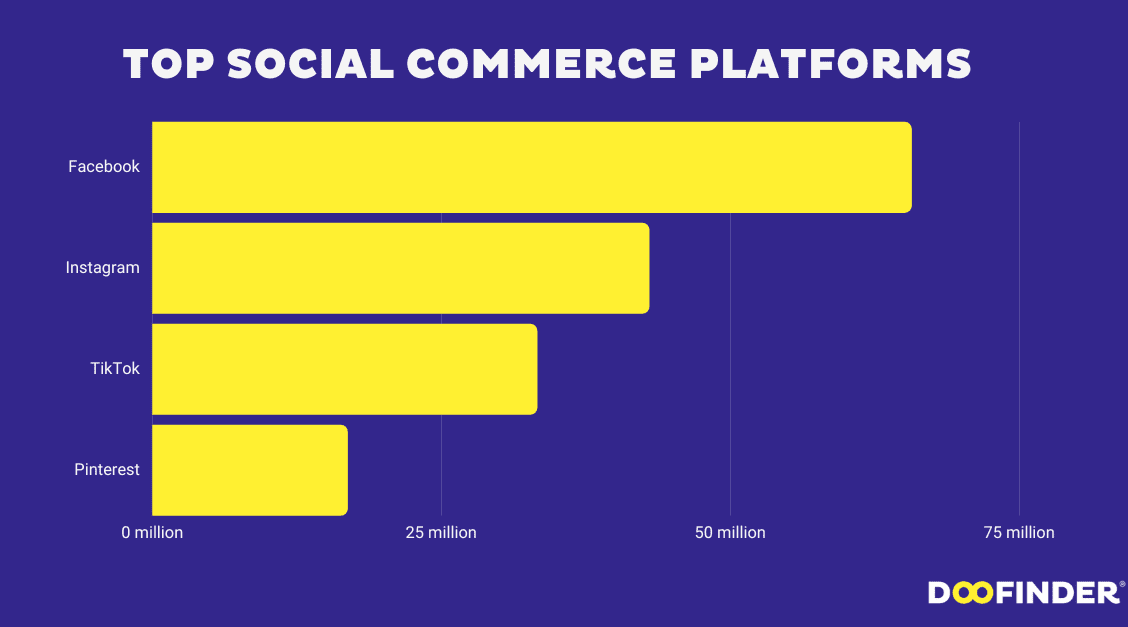
Top social commerce platforms 2024
7. Interestingly, TikTok is the most trusted platform for Gen Z shoppers but the least trusted across all generations.
8. Influencers also play a huge role in social commerce. Almost half (49%) of consumers decide what to buy based on influencer recommendations, and 80% have made purchases because of them.
9. During the holiday season, 34% of shoppers turned to social media to buy gifts, and 70% of U.S. consumers use social media to spark ideas for what to buy.
Social Commerce Market Size & Revenue Stats
Knowing the size and revenue of the social commerce market is important because it shows how big the opportunity is. If the market is growing quickly and is expected to reach billions, it means that there is a lot of potential for your businesses to tap into.
Here are some social commerce stats about the market size and revenue:
10. In 2023, social commerce pulled in $571 billion in sales. With an annual growth rate of 13.7%, it’s on track to top $1 trillion by 2028.
11. By 2024, social commerce is expected to hit a 25% penetration rate, meaning one in four potential shoppers will buy directly through social media.
12. Globally, the social commerce market was valued at $1.3 trillion in 2023. With an amazing growth rate of 26.2% per year, it’s forecasted to reach $8.5 trillion by 2030.
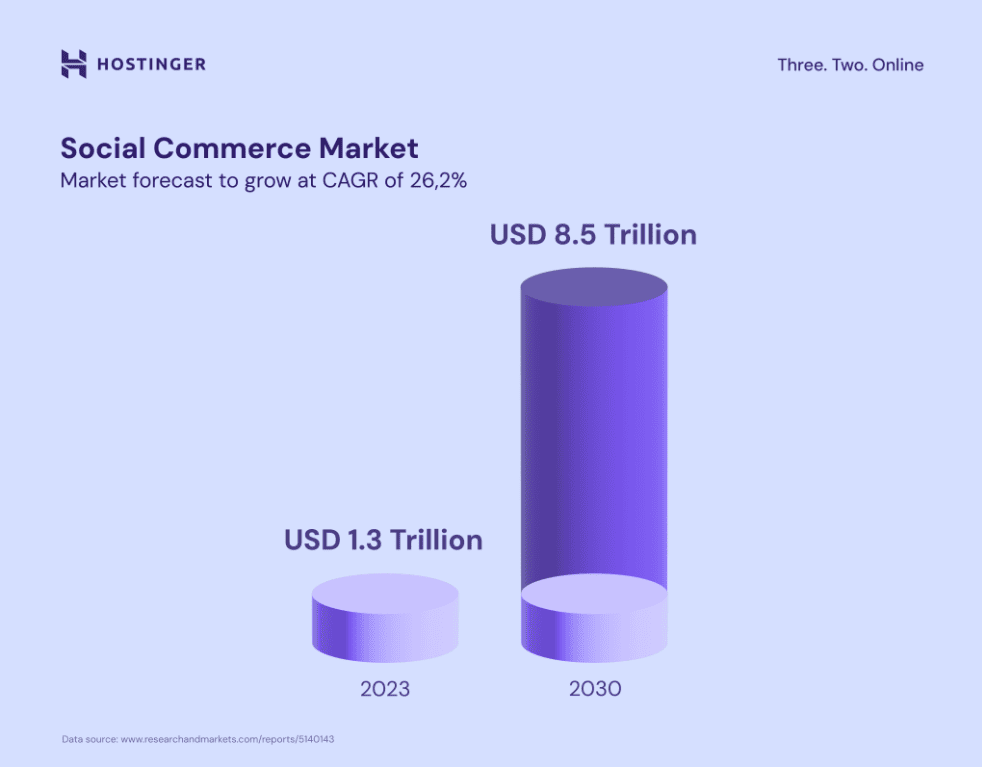
Social commerce market growth predictions
13. In the U.S., social commerce sales reached nearly $64.8 billion in 2023. By 2025, this market will surpass $90 billion and climb close to $150 billion by 2028.
14. As of April 2024, more than five billion people were using social media—62.6% of the global population! Northern and Western Europe lead the way, with social media usage reaching 80.2% and 78.2% penetration, respectively.
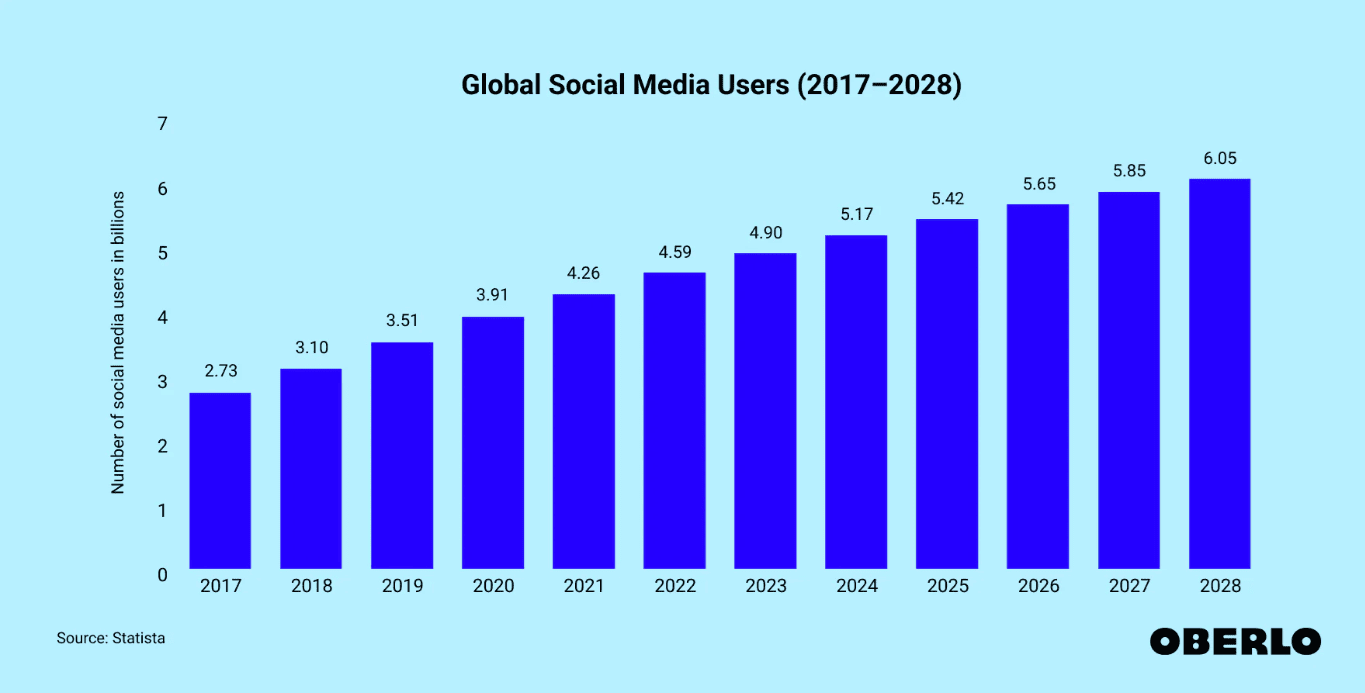
Global social media users 2024
15. Influencer marketing is also booming. By 2024, this industry is expected to hit a record value of $24 billion.
16. Instagram is leading the influencer marketing charge, with the global market growing from $13.8 billion in 2021 to a predicted $22.2 billion by 2025.
Social Commerce Buyers Stats
When you know who your buyer is, what their interests are, and what they want from you, you can sell products easily on platforms like Instagram, TikTok, or Facebook.
These social commerce stats reveal important details like the age, gender, and interests of shoppers, as well as how they behave when buying online.
For example, you can see if most of your buyers are young adults into fitness or parents looking for kid-friendly products.
When you have this information, you can tailor your ads, offers, and content to match what your audience wants, making it easier to grab their attention.
17. Nearly 23% of social buyers in the US are between the ages of 25 and 34, and more than 52% are aged 35 or older.
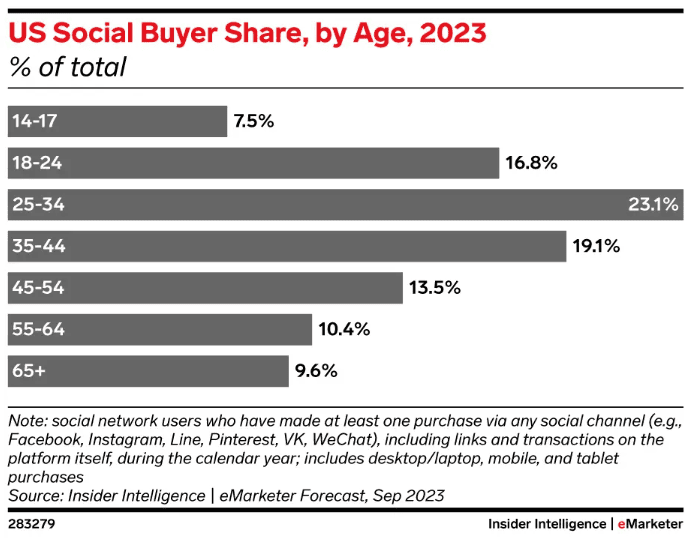
US social buyer share by age
18. Among US digital buyers aged 18 to 34, 35% have made purchases on Instagram, 36% on Facebook, and 31% on TikTok, according to a survey from February 2024. These platforms are major players in social commerce for this age group.
19. When it comes to TikTok Shop, around 40% of Gen Zers (ages 18–26) and 24% of teens (ages 13–17) have made at least one purchase. This is much higher than 37% of millennials and 14% of Gen Xers. Gen Z, in particular, is in charge of purchasing directly through TikTok.
20. In 2022, the average US social buyer spent $518, which is a 27% increase from the previous year.
21. Social commerce spending is on the rise and will continue, with annual spending per buyer projected to increase by $419, reaching $937 by 2025.
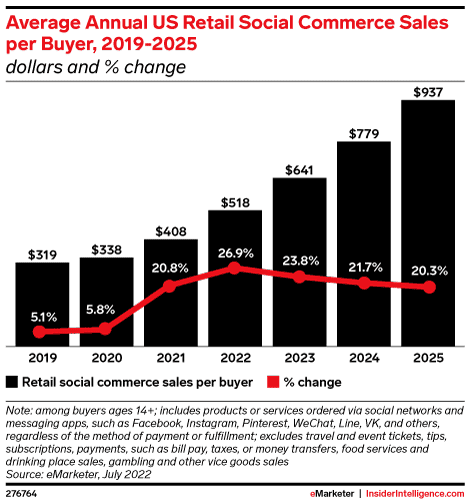
Average US social commerce sales per buyer
22. Social media users now spend around 15% of their waking hours on platforms, which equals about 2 hours and 26 minutes per day across an average of 6 social media apps.
23. About 58% of shoppers in the US have bought something after seeing it on social media. This trend is also evident in other countries, with 44% of UK shoppers and 40% of German shoppers saying the same.
24. A total of 54% of social media users use these platforms to find products, and 71% are more likely to make a purchase based on referrals they see on social media.
25. According to Salesforce, half of shoppers worldwide have turned to social media to discover products, while an even larger percentage (59%) have made a purchase through the platform.

Social media is top platform for shoppers worldwide to discover and buy products
26. 27% of buyers prefer to discover new products on social media rather than through any other channel.
27. 41% of consumers have discovered a product through social media in the past three months, which is a 14% increase year-over-year.
28. 11% of social users make an immediate purchase after finding a product on social media, while 44% tend to buy later.
29. A solid 81% of consumers say their purchasing decisions are influenced after seeing their friends’ posts on social media, and 78% are swayed by posts from brands. This reflects the power of social proof—people trust recommendations from friends and brands on social media when making purchase decisions.
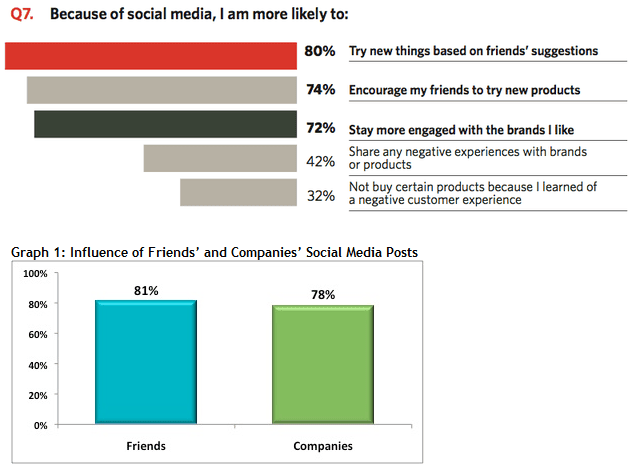
Influence of friends’ and companies’ social media posts
30. 53% of global consumers say they will shop more through social platforms in the future, suggesting that social commerce is expected to grow.
31. People who have already made a social commerce purchase in the past are twice as likely to buy from a brand they’ve never heard of before.
32. 44% of Gen Z have bought something on the recommendation of an influencer, compared to 26% of the general population.
33. About half of US Gen Z and millennials make purchases on social media channels, compared to 38% of US adults overall.
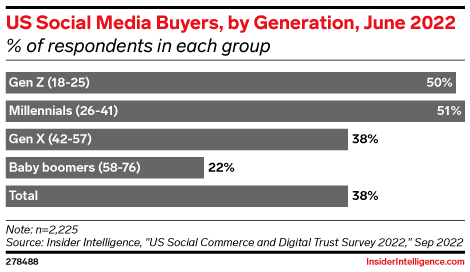
US social media buyers by generation
34. About 54% of Gen Z buyers and 58% of millennials agree that social media platforms are better than online searches for discovering new products.
35. Baby Boomers (people born between 1946–1964) are the least likely to buy via social media, but 73% have made a purchase on Facebook in the past three months.
Social Commerce Platform Stats
Social media platforms are central to the world of social commerce as they drive billions in sales. These platforms aren’t just for socializing—they’ve become major players in the world of digital shopping.
To give you a better understanding of how important they are, here are some important social commerce stats that show how these platforms are shaping the market and influencing consumer behavior.
Facebook Shopping Stats
For some time, people have been saying that Facebook might decline as other social media platforms become more popular.
But the truth is Facebook is still at the top when it comes to social commerce.
It continues to offer lots of opportunities for brands to engage with customers and drive more sales, thanks to its power to deliver personalized marketing and make the shopping experience smooth and easy.
36. By Q4 of 2023, Facebook reached 3.065 billion monthly active users, following the milestone of 3 billion in Q2 of 2023. Out of these, 2.1 billion users access the platform daily.
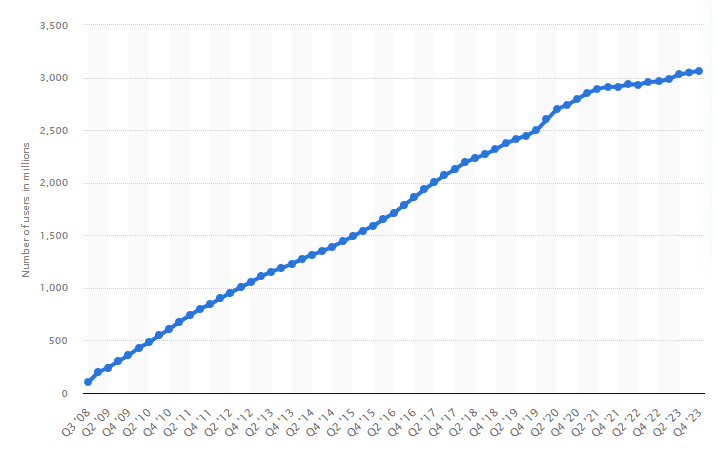
Number of monthly active Facebook users
37. On average, American users spend 30.9 minutes per day on Facebook, placing it ahead of other major platforms like X, Instagram, and TikTok.
38. According to eMarketer, US adults were more likely to make a purchase directly on Facebook in Q1 2023. However, for Gen Z buyers, Facebook ranked fourth behind TikTok, Instagram, and YouTube.
39. The same eMarketer study projects Facebook commerce to continue its growth, reaching 64.6 million shoppers by the end of 2024.
40. Facebook remains the top platform for social commerce, with 89% of marketers using it to drive retail sales.
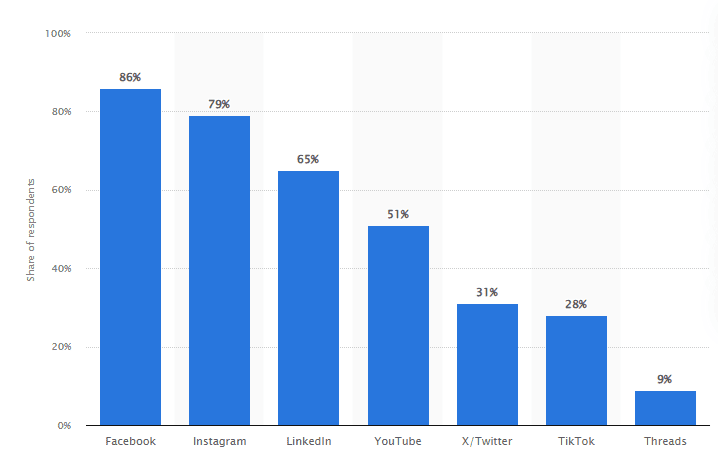
Top social media platforms used by marketers
41. Facebook’s popularity among consumers is reflected in Statista, which reports that one-third of social commerce buyers prefer to make purchases on the platform.
42. According to an Insider Intelligence survey, 62% of US social buyers said their most recent social media purchase took place on Facebook, with features like Marketplace and Shops facilitating these transactions.
Instagram Shopping Stats
Instagram is a powerful tool for all the businesses looking to boost sales and grow their reach. Its huge user base and visually engaging platform provide endless opportunities for brands to connect with customers.
So how powerful is Instagram Commerce when it comes to driving business growth and engagement?
These social commerce stats will show you just that:
43. Instagram has 2 billion monthly active users, making it a massive platform for brands, though still behind Facebook’s 3 billion.
44. U.S. adults spend 33.1 minutes per day on Instagram, a 3-minute increase from last year.
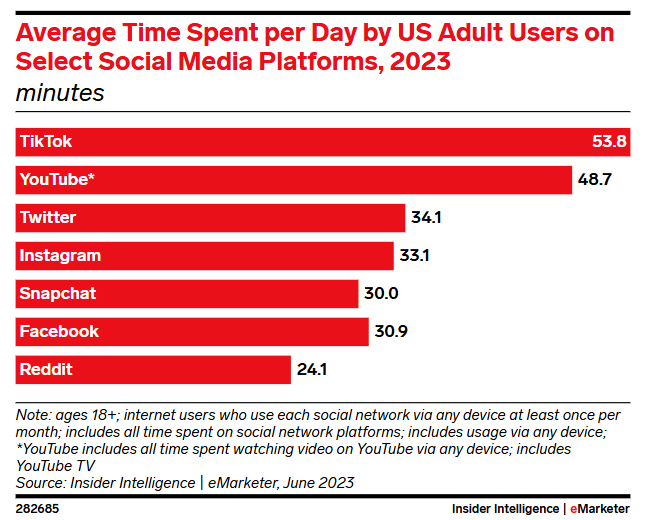
Average time spent per day by users on social media platforms
45. The channel is most popular among users aged 18 to 34, who make up over 60% of Instagram’s user base.
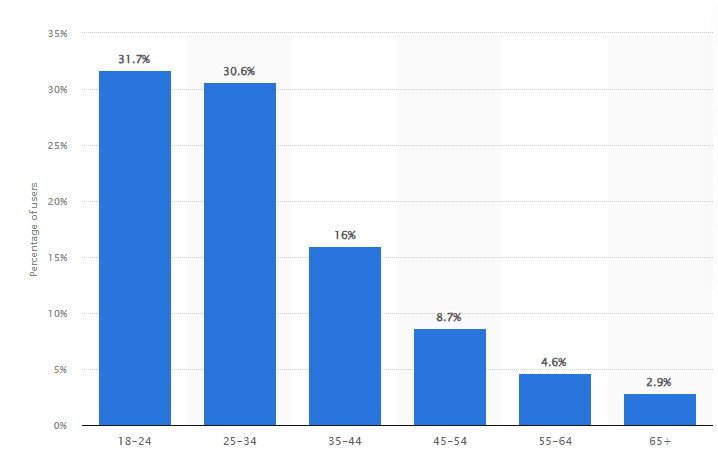
Instagram users worldwide by age
46. 62.7% of Instagram users follow or research brands and products on the app, making it the third most common activity and key in influencing buying decisions.
47. About 90% of Instagram accounts follow at least one brand, and 130 million people engage with shoppable posts every month.
48. Instagram’s shopping features have helped brands double their revenue, with shoppable posts increasing website traffic by up to 1,416%.
TikTok Shopping Stats
Retailers can now make money on TikTok more easily than ever, thanks to the platform’s social commerce features. Businesses can create a TikTok Shop to show their products and drive sales directly on the app.
Here are some important social commerce stats that show how TikTok can help your brand succeed in 2025:
49. TikTok has more than 1.5 billion monthly active users, making it the fifth most popular social media platform worldwide.
50. In 2022, 24 million people in the U.S. made a purchase on TikTok, and this number is expected to grow to 40 million by 2026.
51. While more than half of TikTok users are men, female Gen Z shoppers drive most of the sales. Research shows that TikTok Shop reaches a higher percentage of women in Gen Z (75%) than men (62%).
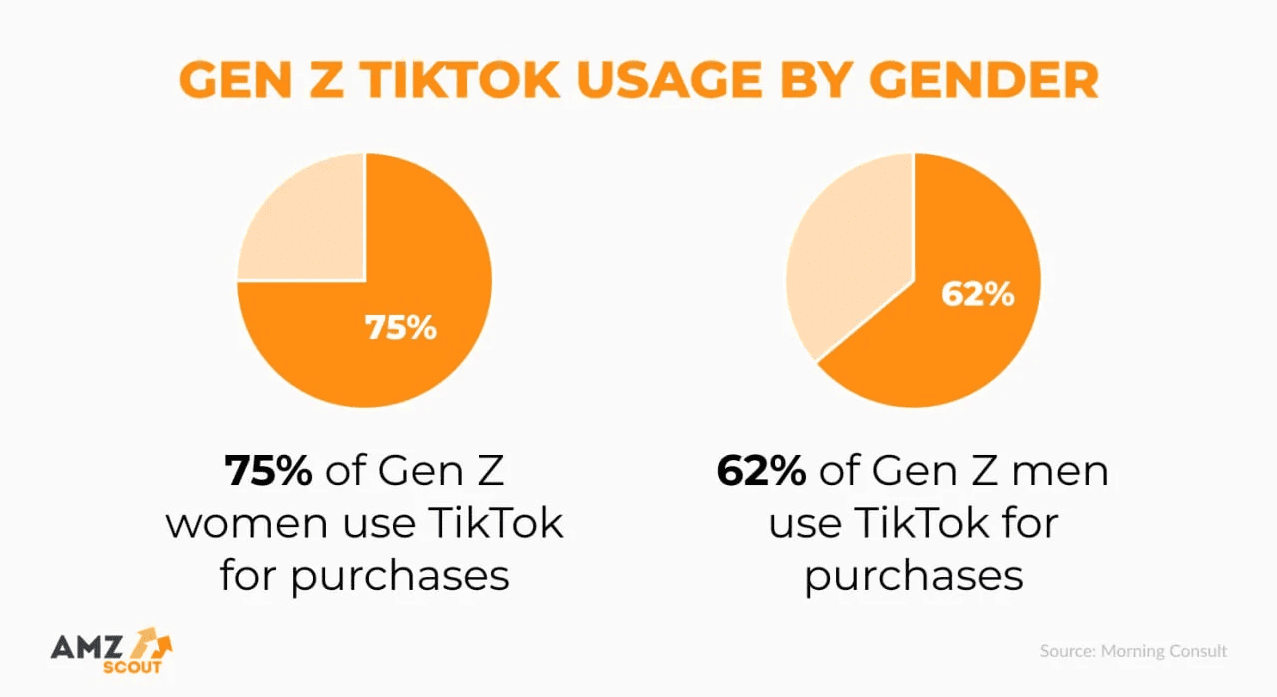
Gen Z TikTok usage by gender
52. 58% of TikTok users shop directly on the platform, which means over 1 billion people globally and around 70 million in the U.S. are engaging in TikTok shopping.
53. TikTok shoppers use the app in many ways: 71.2% have bought something after coming across it in their feed or Stories, 58.2% use the app for shopping inspiration, 45% shop based on paid influencer recommendations, and 39.1% actively search for products in TikTok Shop.
54. TikTok leads the way for impulse purchases, with 55% of its users making an impulse buy on the platform.
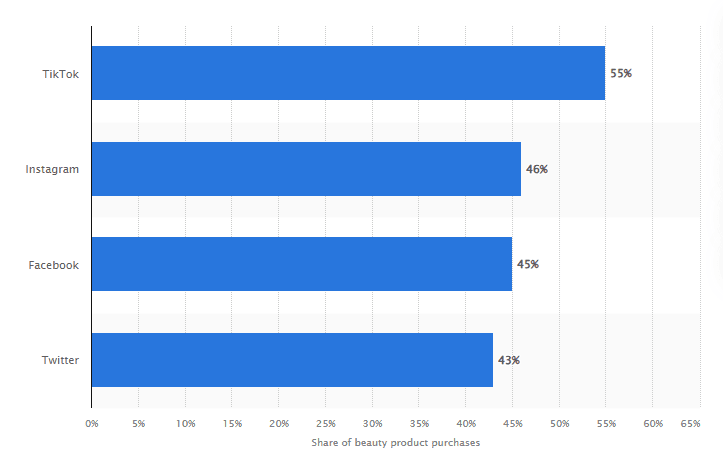
Social media users who made impulse purchases in 2022
Pinterest Shopping Stats
Pinterest Shopping has made it simpler for retailers to sell on Pinterest. It allows you to upload your product catalog to your Pinterest business page and then tag products in your Pins so people can click on those tags to learn more.
However, remember that these Product Pins are not direct social commerce tools. Users will still be redirected to a product-specific landing page to finish their purchase.
Now, let’s take a look at some key Pinterest social commerce stats:
55. Pinterest has 500 million monthly active users. While that’s a small fraction compared to Facebook’s nearly 3 billion, Pinterest is growing steadily each year.
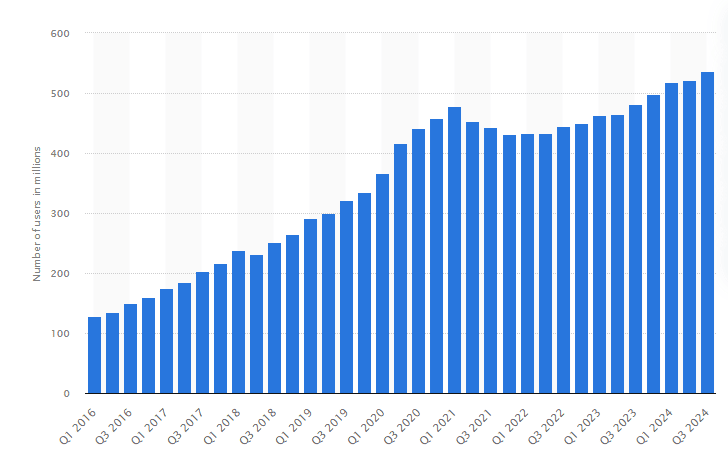
Number of monthly active Pinterest users worldwide
56. Pinterest is a great platform for social commerce. One-third of its users have an annual income of over $100,000, meaning they’re ready to make a purchase when browsing for products.
57. Pinterest users are actively shopping. A huge 85% of weekly Pinners have bought something after seeing a pin from a brand.
58. The U.S. is Pinterest’s most popular country, making up over a third of its traffic. The next most frequent countries visiting Pinterest are Brazil, Russia, India, and Colombia.
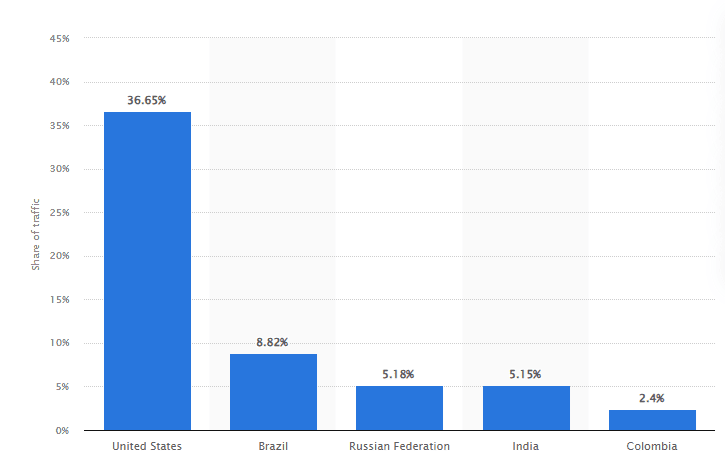
Regional distribution of desktop traffic to Pinterest.com by country
59. Pinterest is a great place for businesses to get noticed. 4 out of 5 users have found a product or company on Pinterest, leading to a purchase or a follow.
60. Pinterest users spend twice as much when shopping on the platform as other social media sites. This makes it perfect for higher-priced products like furniture, designer clothing, or accessories.
Social Commerce Trends For 2025
The future of social commerce is looking dynamic and exciting.
In the last section of our social commerce stats, we’ll dive into upcoming trends, changing consumer behavior, technological innovations, and potential market growth.
Let’s take a look at what we can expect in the years ahead.
61. Augmented and virtual reality are becoming very popular. In 2024, about 104.3 million Americans are expected to use AR, and nearly 73.7 million will use VR. By 2025, 19.8% of these users will access AR and VR through social networks.

AR and VR users in the United States
62. The global live-streaming market is set to grow a lot, from $38.87 billion in 2022 to $256.56 billion by 2032, thanks to the rising demand for video content.
63. Retail businesses that embrace livestream shopping can expect big rewards. Brands report that live commerce has a conversion rate of around 30%, which is 10 times higher than traditional commerce.
64. The global AI market will reach $305.9 billion by the end of 2024, and it’s expected to keep growing. AI’s role in social commerce is expected to account for 79.6% of retail eCommerce sales in the U.S. by 2025.
65. While partnering with micro-influencers isn’t new, it’s still important in 2025. Around 81% of consumers trust influencers’ recommendations more than a brand’s marketing messages.
Conclusion
Social media has completely changed how businesses and consumers connect, and social commerce is the latest frontier.
Now that you know all the basics of social commerce—like the benefits you can gain and the platforms to use—it’s time to dig deeper.
To stand out in the growing social commerce space, you need to tap into the above-given trends.
Identify the social media platforms your potential audience uses, then create a strategy to engage with your ideal shoppers on those platforms.


