Two decades since its inception, Facebook remains as influential as ever.
The latest Facebook advertising stats highlight its continued dominance in the social media arena.
Even with rising competition from newer platforms like TikTok, Facebook has expanded to a massive 3.07 billion monthly active users, solidifying its position as the most widely used social media platform around the world.
And that’s just the surface!
In this article, we’ll explore the top Facebook advertising stats, including ad performance, costs, best practices, benchmarks & trends, and future forecasts.
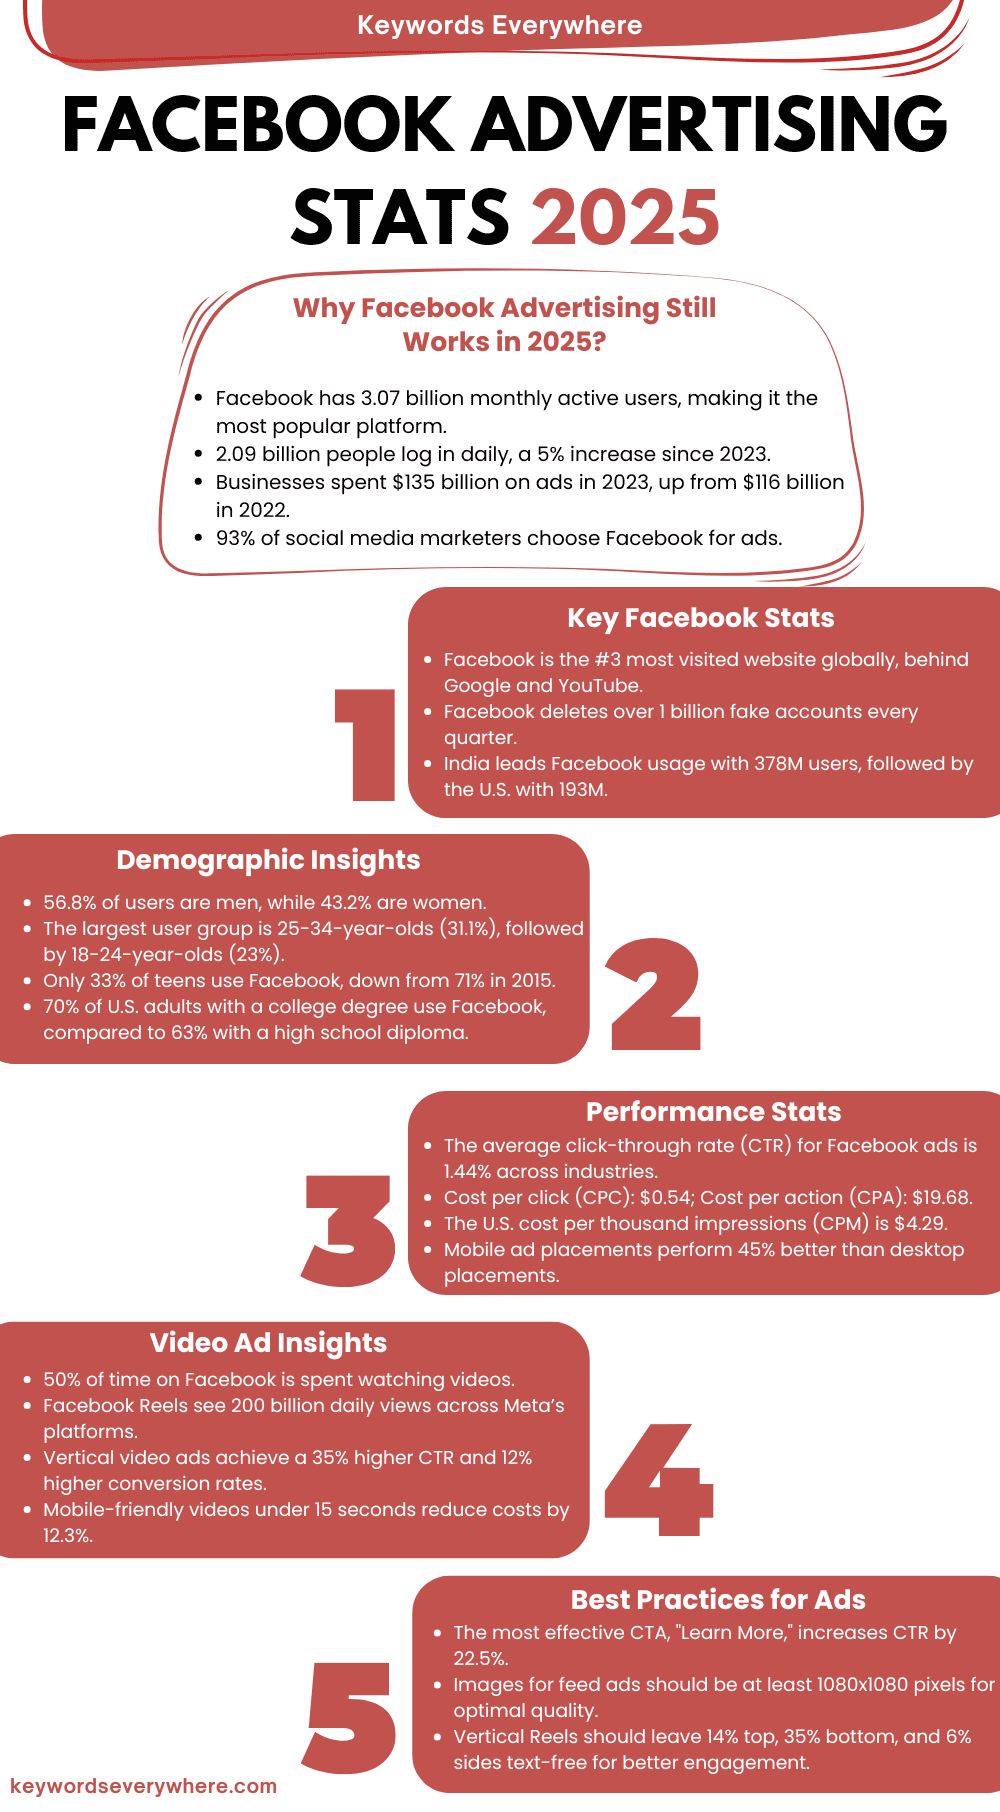
Key Facebook Advertising Stats
There’s one platform that’s been under intense scrutiny in recent years.
Facebook continues to make headlines—and not always for the best reasons.
As privacy concerns have grown, so has the pressure on Facebook to overhaul its data and advertising practices.
The introduction of Apple’s iOS 14 update only fueled the fire, drastically limiting Facebook’s ability to track users across devices.
And the most concerning part?
Facebook ad costs have steadily increased year after year for over a decade.
So the BIG question is…
“Are Facebook ads still worth it today?”
Below are the latest Facebook advertising statistics that highlight why this platform continues to be one of the most powerful tools in digital marketing:
1. Facebook is still hugely popular, with 3.06 billion people using it every month. While younger users might be moving to other platforms, billions still rely on Facebook regularly.
2. Every single day, 2.09 billion people log into Facebook—that’s a massive number, and it’s even grown by 5% since the start of 2023.
3. Facebook is the top social network worldwide. To put it in perspective, YouTube, the second most popular platform, has 2.4 billion monthly users—far fewer than Facebook.
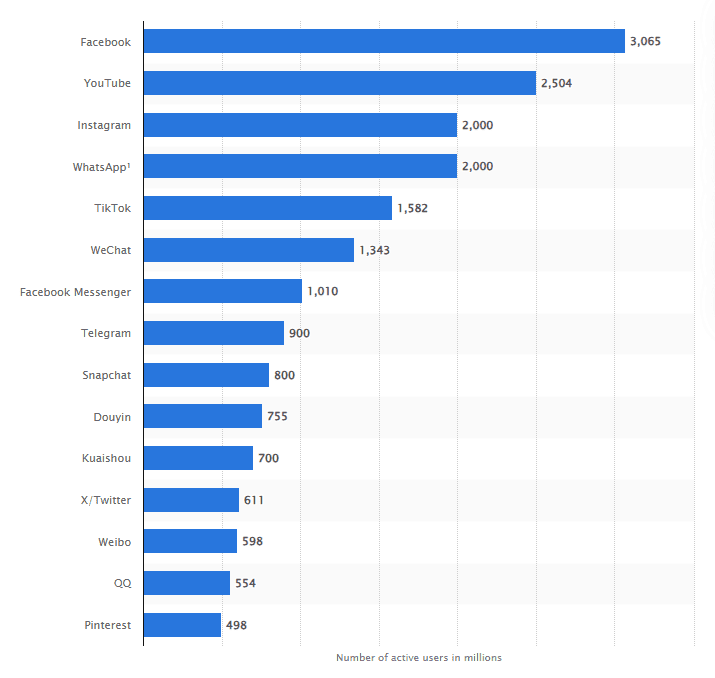
Most popular social networks worldwide
4. When it comes to advertising, Facebook is a giant. In 2023, businesses spent so much on ads that Facebook earned $135 billion in ad revenue, up from $116 billion the year before.
5. Marketers love Facebook! About 93% of social media marketers use Facebook ads to reach their audience, compared to 73% who advertise on Instagram.
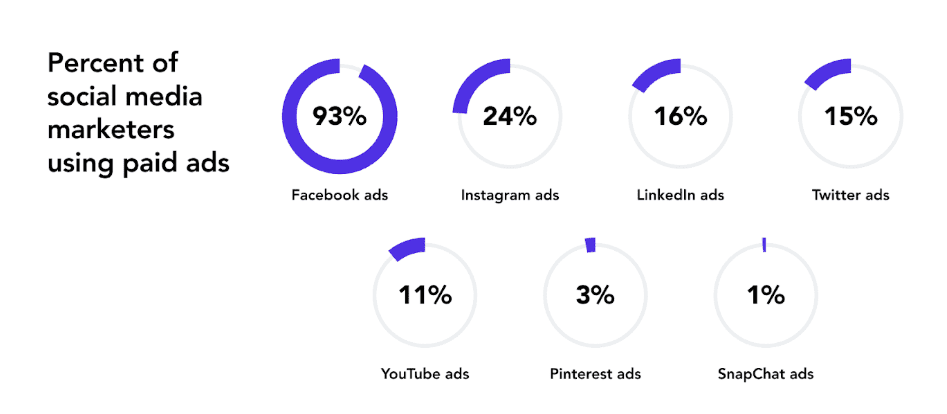
Percent of social media marketers using paid ads
6. Facebook is the third most visited website in the world. Only Google and YouTube rank higher, and Facebook is ahead of platforms like Twitter and Instagram.
7. To keep the platform safe, Facebook deletes over 1 billion fake accounts every quarter, tackling spam and scams constantly.
8. Globally, India has the most Facebook users at 378 million, followed by the U.S. with 193 million. Indonesia, Brazil, and Mexico round out the top five.
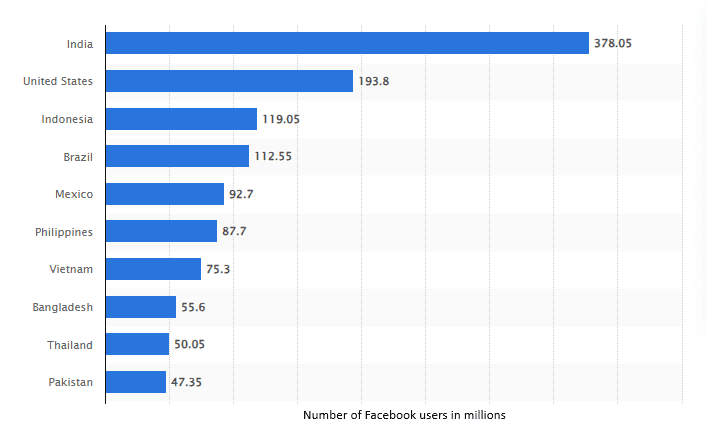
Leading countries based on Facebook audience size
Facebook Demographic Stats
Ask any marketer, and they’ll tell you: the secret to running successful Facebook ads isn’t just about great visuals or a clever CTA. It’s actually about knowing your audience.
That’s why we’re diving into these Facebook user stats—to help you understand who’s on the platform and how to reach them effectively.
9. Most Facebook users are men (56.8%), while women make up 43.2% of the user base.
10. The largest group of Facebook users worldwide are adults aged 25-34, making up 31.1% of all users. The next biggest group is young adults aged 18-24, who account for 23%.
11. In the U.S., nearly a quarter (24.2%) of Facebook users are aged 25-34, with the 18-24 age group following at 18.6%.
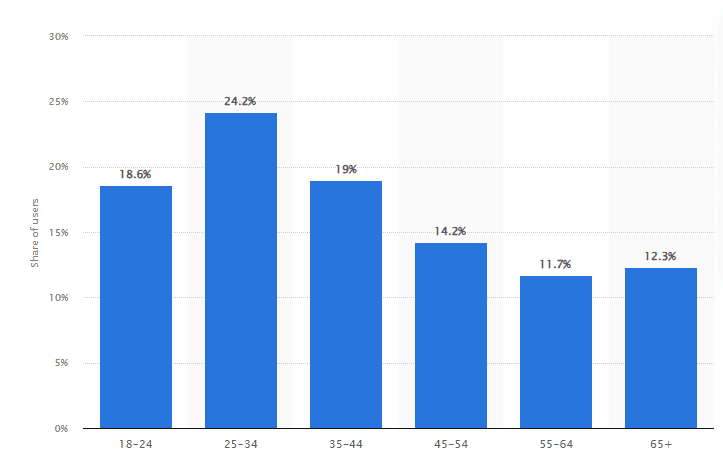
Share of Facebook users in the US by age group
12. Just 33% of teenagers use Facebook today, putting it behind platforms like YouTube, TikTok, Snapchat, and Instagram among that age group.
13. Facebook used to be a favorite among teens in the U.S., but its popularity has dropped significantly—from 71% of teens using it in 2014-2015 to just 33% now. Similarly, Twitter (now called X) has seen a smaller decline in teen users over the years.
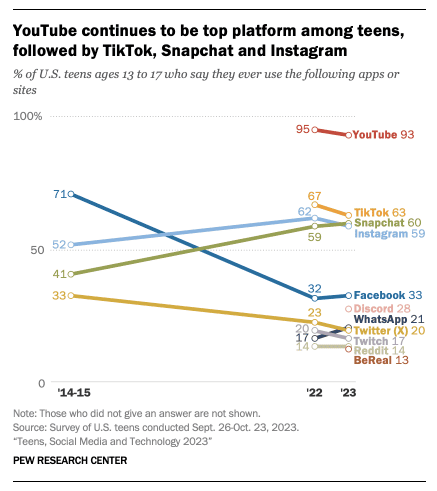
Teens are less likely to be using Facebook and Twitter than they were a decade ago
14. Education makes a difference in Facebook usage: 70% of U.S. adults with a college degree use Facebook, as compared to 63% of those with a high school diploma or less.
15. Most people access Facebook through mobile devices, with only 2.6% of users relying solely on laptops or desktop computers.
16. On average, U.S. adults spend 30.9 minutes a day on Facebook, but this varies by age. Adults aged 55-64 spend about 45 minutes daily, while those aged 18-24 spend just 22 minutes.
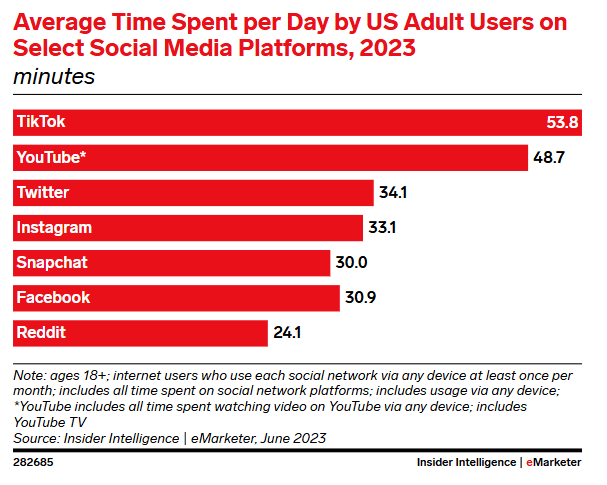
Average time spent per day by US Facebook users
Facebook Ads Performance Stats
The following Facebook ad stats focus on what matters most to advertisers: performance. We’ll dive into essential metrics like CTR, CPC, and other benchmarks that help measure success.
We will also reveal which ad formats are currently delivering the best results on Facebook (so you can target only those).
17. 54% of marketers say Facebook ads are “very effective” at driving sales, while just 8% think they don’t work well at all.
18. 29% of marketers report Facebook gave them the best return on investment (ROI) compared to other social media platforms.
19. According to a Databox study, the average click-through rate (CTR) on Facebook ads across all industries is 1.44%.
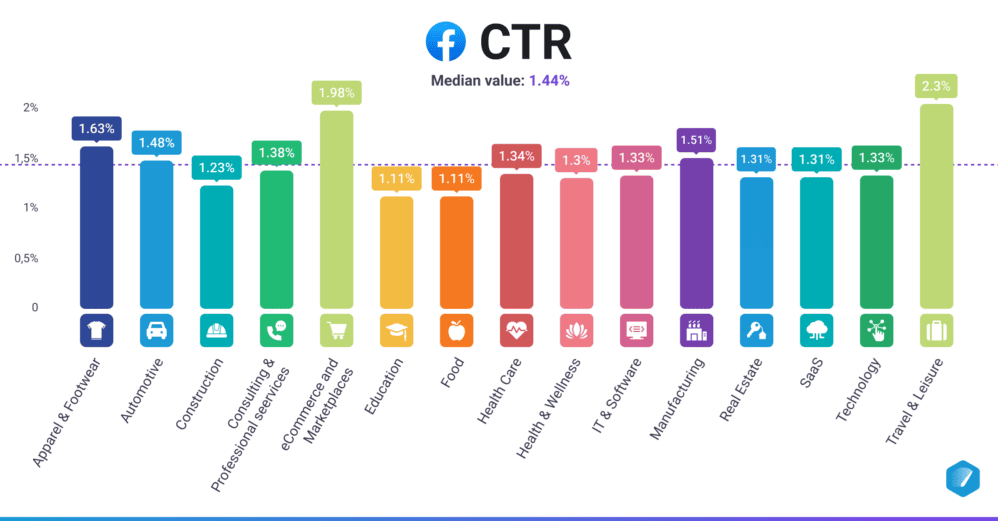
Facebook ads CTR across all industries
20. The median cost-per-click (CPC) for Facebook ads is $0.54.
21. In Q1 2024, the cost per thousand impressions (CPM) for Facebook ads dropped by 2% compared to the previous year.
22. In the U.S., the average cost per thousand impressions (CPM) for Facebook ads hit $4.29 in 2024—almost four times higher than the global average.
23. A study by Wordstream found that the average cost per action (CPA) on Facebook ads is $19.68.
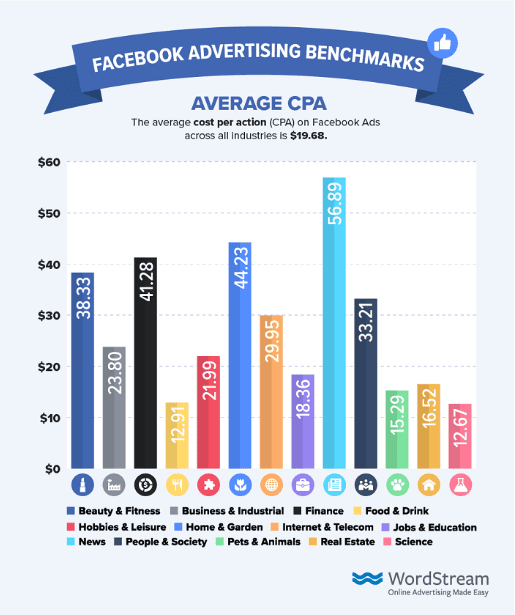
Average cost per action on Facebook ads
24. The average conversion rate (aka CTR) for Facebook ads across industries is 8.95%, ranging from 3.95% to 11.34%, depending on the industry.
25. For businesses in the legal services industry, the cost per lead on Facebook ads is the highest at $78.26, while real estate companies pay the least, at $12.43.
26. 70% of businesses say Facebook ads give them the highest ROI, and about one-third of business owners say Facebook ads alone are their top performer for ROI.
27. An experiment by AdEspresso showed that mobile ad placements perform 45% better than desktop placements.
28. Buffer found that spending just $5 a day on Facebook ads resulted in 9 new page likes, 1 click to the landing page, and reached 787 new people overall.
29. Adding a call-to-action (CTA) is key to success in Facebook ads. A test by AdEspresso showed that switching the CTA from “Sign Up” to “Learn More” boosted the click-through rate by 22.5%. However, using the “Sign Up” CTA button led to a 14.5% higher conversion rate.
30. Facebook is the second most popular platform for influencer marketing, after Instagram. According to EMARKETER, 97.6% of U.S. influencers use Instagram for marketing, while 71.5% turn to Facebook as well.
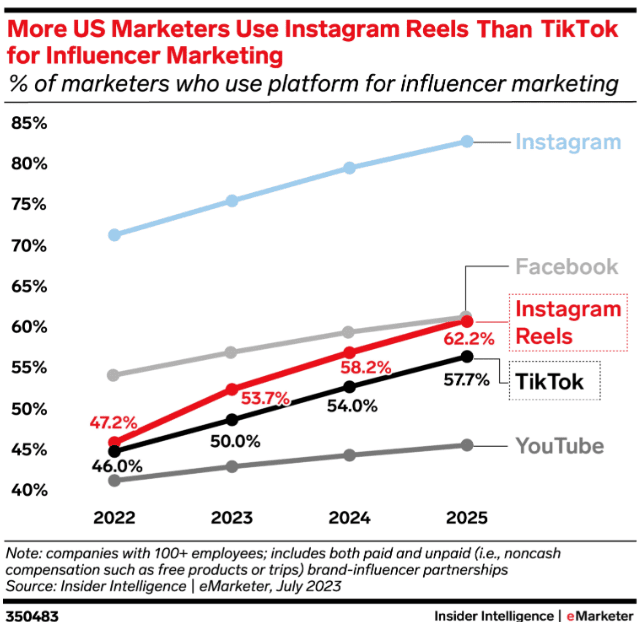
Facebook for influencer marketing
31. In 2024, marketers are expected to spend $1.00 billion on influencer campaigns specifically on Facebook.
32. Ads with a direct CTA to make a purchase usually have a conversion rate of 0.1% to 0.2%.
33. Videos play a big role in Facebook ad success. A survey of Australian users found that 48% of people bought something after watching a company’s video ad.
34. Facebook’s U.S. ad revenue is projected to hit $33.68 billion in 2024, reflecting a 7.2% growth from the previous year.
35. Metricool found that App Promotion campaigns have the highest CPC at $0.32, while Traffic campaigns have the lowest at $0.04.
36. Analysis of 675 B2C companies shows a median return on ad spend (ROAS) of 1.79 for Facebook ads, with similar results of 1.8 in a separate study of 636 B2C companies.
37. When asked what had the biggest impact on improving their Facebook Ads’ return on ad spend (ROAS), 42.31% of respondents said creating compelling ad content was key. In comparison, 34.62% said the right target audience was the most important factor.
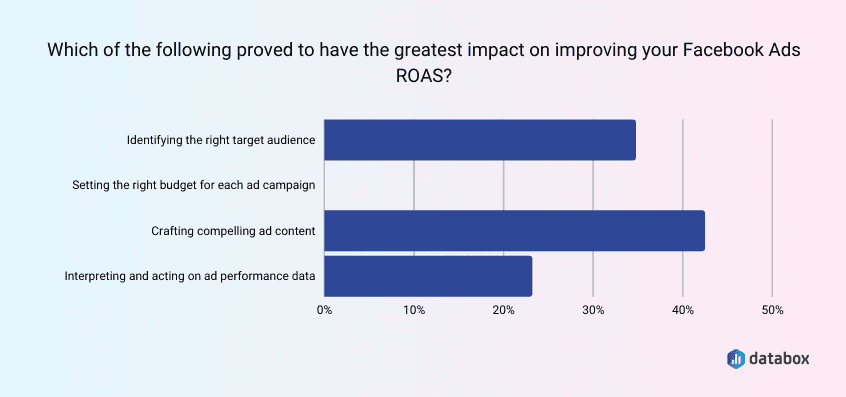
Factors improving your Facebook Ads ROAS
Facebook Video Stats
You’ve likely seen an increase in video ads popping up in your Facebook feed. And there’s a simple reason for that: video is an incredibly effective way to get attention in a feed full of static images and status updates.
Not only do video posts tend to get more organic reach than text-based ones, but there’s also strong evidence showing that video can be a game-changer in Facebook ad campaigns.
38. According to Facebook, about half of the time people spend on Facebook and Instagram is spent watching videos. This shows that your audience is likely watching video content, and creating more videos can help you reach a larger group of people.
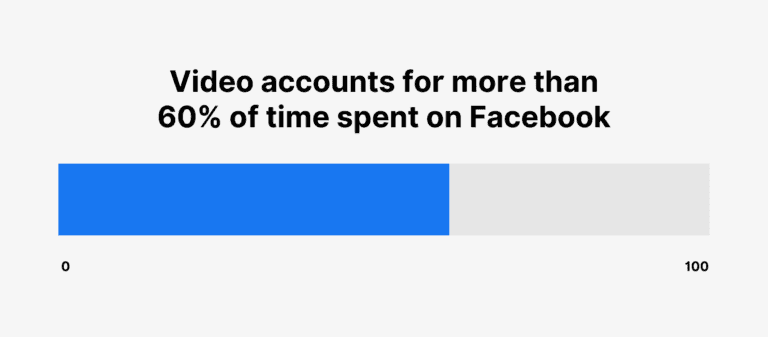
Power of video accounts on Facebook
39. Since Facebook Reels were introduced, they’ve been a hit. Facebook found that vertical videos with audio (like Reels) have a 35% higher click-through rate (CTR) than other video types.
40. Reels are here to stay. They get about 200 billion views daily across Facebook’s apps, showing their popularity.
41. A survey of holiday shoppers worldwide revealed that 55% of them find online videos helpful for discovering gift ideas.
42. An analysis of 12 million Facebook ad sets showed that vertical videos with audio had a 12% higher conversion rate than other video types.
43. Reels ads featuring vertical video with audio saw a 35% higher click-through rate (CTR) than other types of Reels ads.
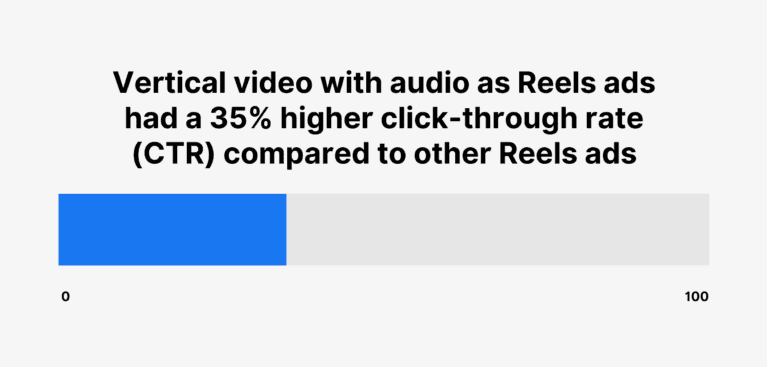
Facebook reels ads CTR
44. Mobile-friendly video ads on Facebook (those under 15 seconds and in vertical format) had a 12.3% lower cost per conversion compared to non-optimized ads.
Facebook Ads Best Practices Stats
If you’re running Facebook ads, you might be asking yourself how to get the best results. Luckily, you don’t have to guess. Numerous industry studies, including some by Facebook itself, have shared data-backed best practices for Facebook marketing.
Here are Facebook advertising stats about the best practices you should follow:
45. Facebook recommends that images for feed ads should be at least 1080 x 1080 pixels to ensure good quality.
46. When using Facebook Reels, it’s best to leave about 14% of the top, 35% of the bottom, and 6% on each side of the video free from text, logos, or other visuals.
47. Your ad copy matters too! According to AdEspresso, after analyzing 752,626 Facebook ads, the average headline length was just 5 words.
48. That same study found that the average ad text has 14 words. Short and to-the-point copy with a clear message performs best.
49. The top 5 most commonly used call-to-action buttons in Facebook ads are “Learn More,” “Contact Us,” “Sign Up,” “Call Now,” and “Download.”
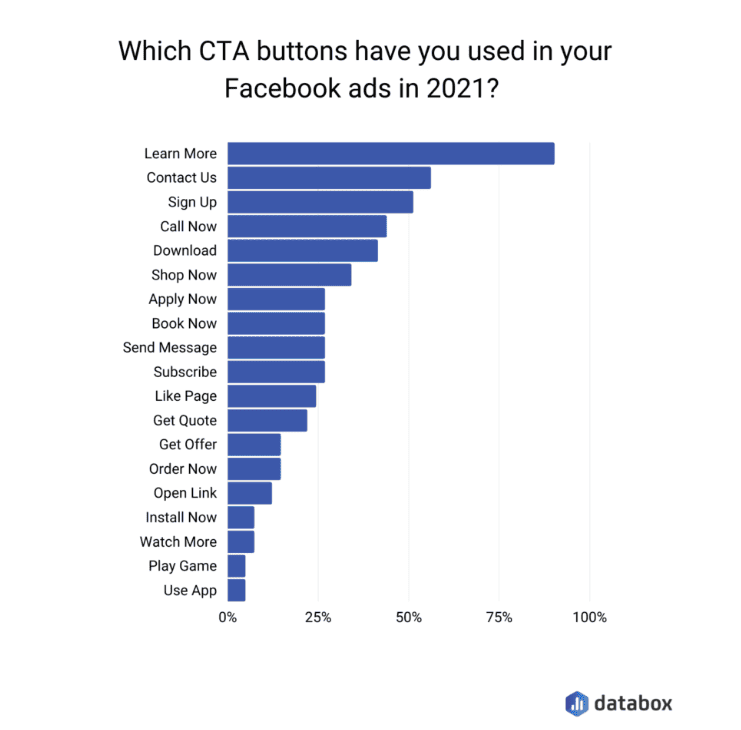
Top CTA buttons for Facebook Ads
50. Visuals still dominate on Facebook. Photo posts get the most engagement, with an average rate of 0.10%. Video posts come next at 0.08%, while status posts do okay at 0.06%. Link posts get the lowest engagement, with just 0.03%.
51. Posting more often doesn’t always mean more engagement. According to RivalIQ, influencers and the higher education industry see the best engagement rates despite posting less frequently.
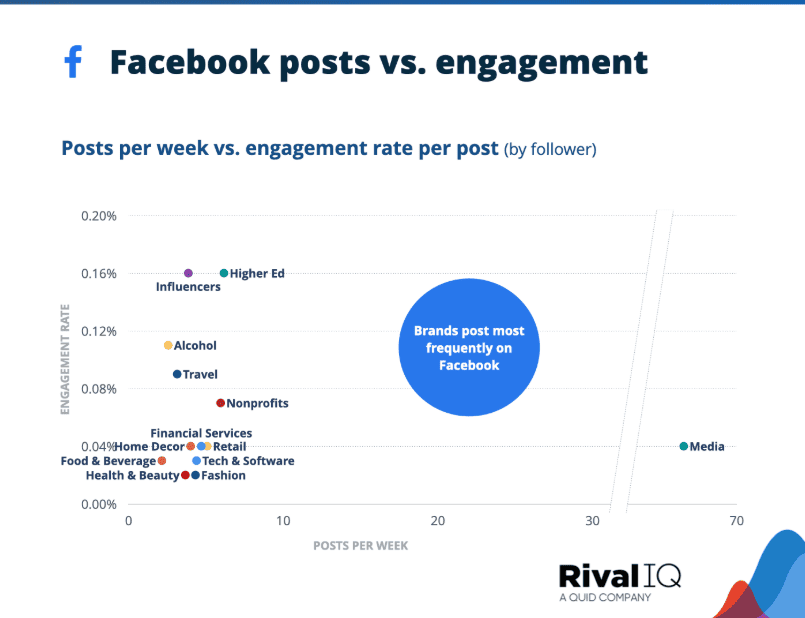
Facebook posts per week vs engagement rate per post
Facebook Benchmarks and Future Trends
These Facebook stats dive into how users engage with content on the platform and how they interact with ads.
We’ll also explore some fascinating insights about how Facebook ads stack up against ads on other platforms, along with some predictions for the future of Facebook advertising.
52. According to Hubspot, Facebook is the leading social media platform for marketing.
53. Facebook ads reach 27.7% of the global population.
54. 84% of B2C marketers who used paid social advertising in the past year turned to Facebook, making it the most popular platform for ads.
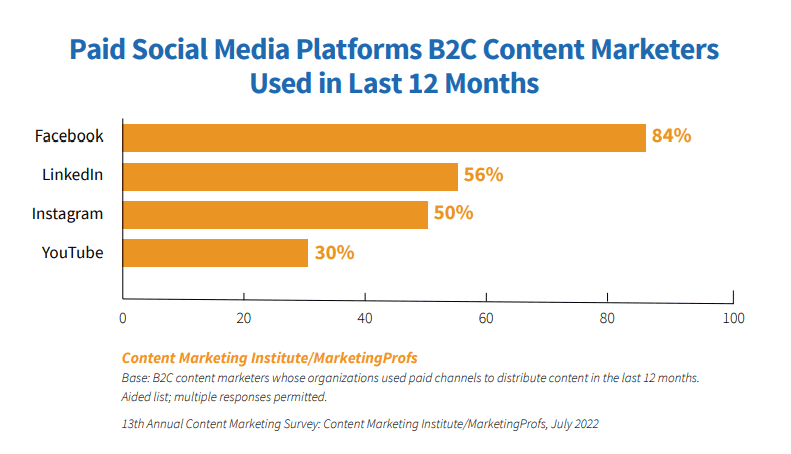
Paid social media platforms B2C content marketers used since last year
55. A survey of B2C marketers showed that 88% find Facebook ads to be at least “somewhat effective.”
56. 28% of B2B content marketers say Facebook offers the best value for their organization, ranking just behind LinkedIn, which leads with 85%.
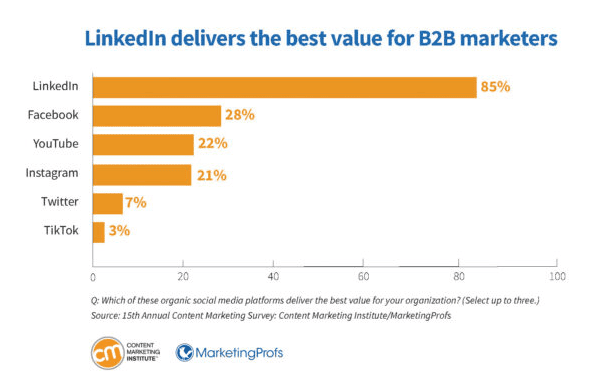
Facebook offers best value for B2B marketers
57. Nearly half (49.2%) of Facebook advertisers track their ad performance daily.
58. Ecommerce businesses usually spend less than $2,500 per month on Facebook ads.
59. Facebook’s total ad revenue is expected to hit $127 billion a year by 2027.
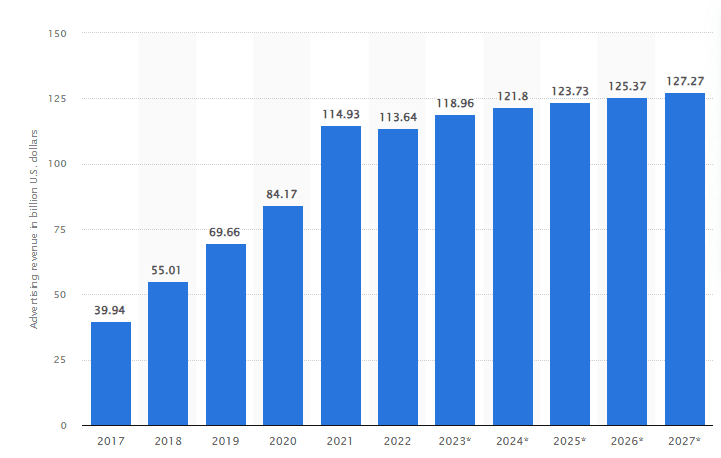
Facebook advertising revenue for 2027
60. By 2025, TikTok is forecast to surpass Facebook in total time spent by US adults, with TikTok at 5.19 billion daily minutes and Facebook at 5.02 billion.
61. Meta (including Facebook and Instagram) is projected to account for 40.7% of the total time spent on social video in the US by 2025.
Conclusion
Are Facebook ads still effective today?
Bottom line: Absolutely.
These Facebook advertising statistics prove that millions of businesses are still seeing excellent returns on investment from Facebook ads. In fact, businesses continue to consider Facebook and Instagram as the most profitable paid advertising channels available.
With billions of monthly active users, Facebook remains the largest social media platform.
However, the platform isn’t magical. You need to work and create engaging, high-quality ads that capture users’ attention to get solid ROI.
