Over the past two decades, social media has transformed from a niche online activity into a massive digital ecosystem that connects billions of people across every corner of the globe.
What started as a way to stay in touch has become a daily habit, with the average user now spending over 2 hours and 23 minutes per day scrolling, watching, and sharing.
While growth has slowed in some regions, global engagement remains stronger than ever.
So, just how big is social media today—and what trends are shaping its future?
Let’s dive into the latest social media usage stats that reveal where things stand in 2025.


Top Social Media Usage Statistics
Social media has completely changed the way people communicate, connect, and even shop, with billions of users logging in daily just to catch up on news, watch videos, message friends, and do so much more.
What started as a way to stay in touch has now become one of the biggest forces shaping opinions, trends, and even global business.
Here are the top social media usage stats that give you a quick overview of how massive and impactful this space is today.
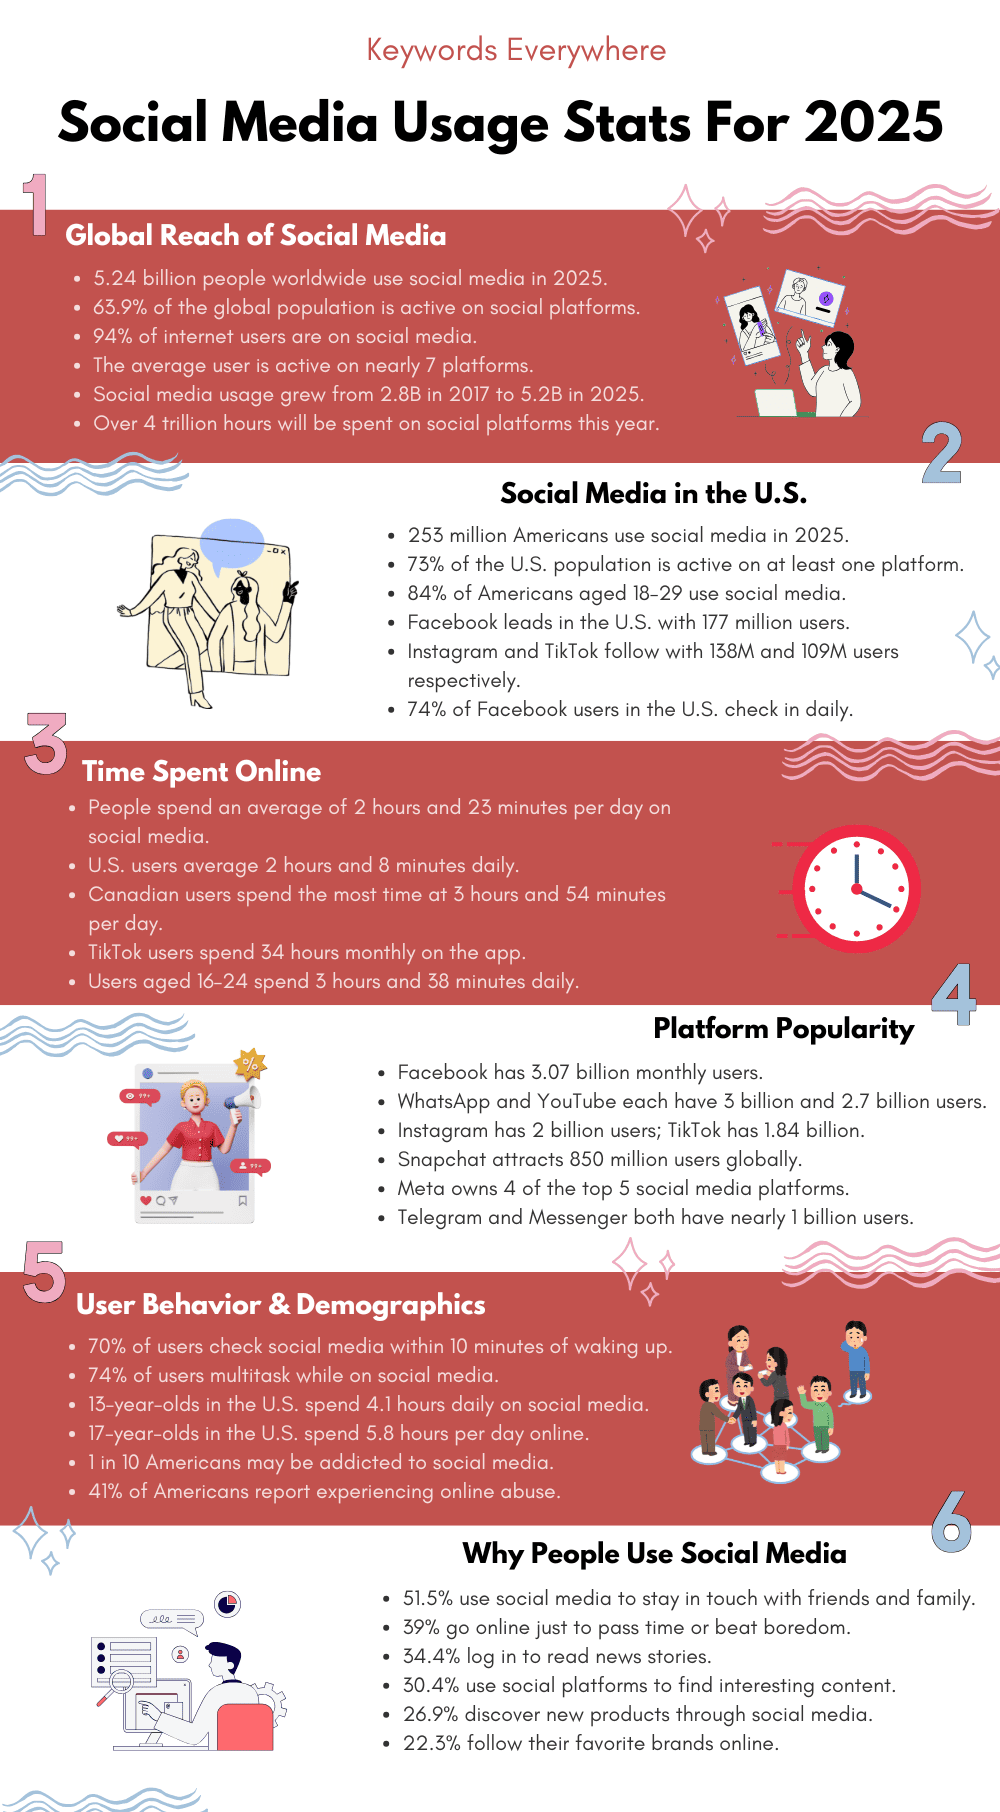
1. Over 5.2 billion people around the world now use social media, which is more than twice as many as there were back in 2015.
Active social media users 2025
2. On average, each person uses nearly 7 different social media platforms, jumping between apps throughout the day.
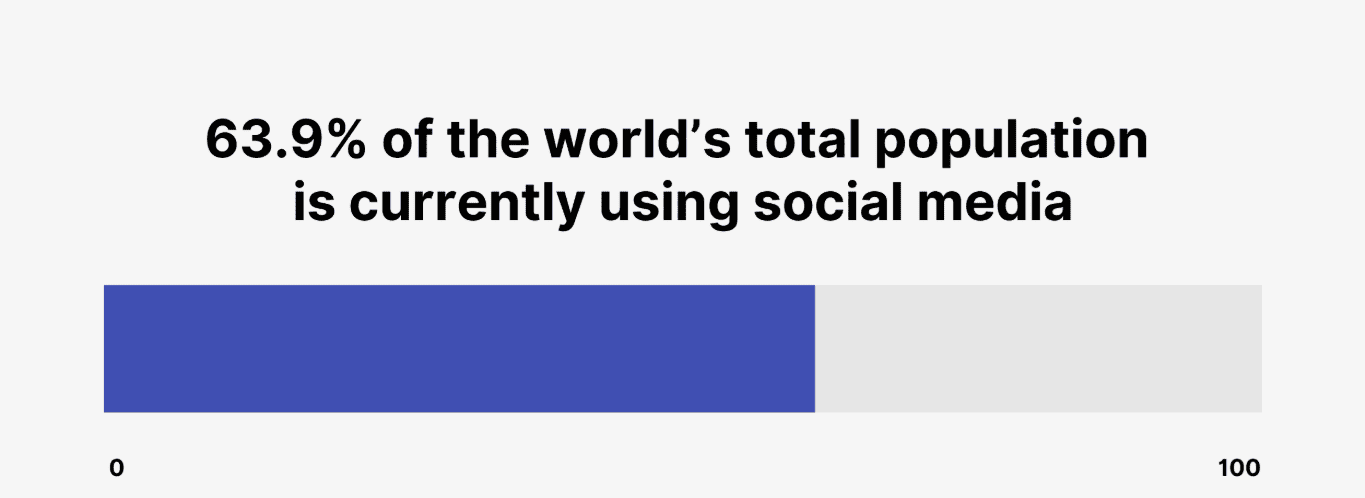
3. 63.9% of the world’s population is on social media, and among adults aged 18 and older, that number jumps to over 86%.
4. People across the globe spend an average of 2 hours and 23 minutes every day on social platforms.
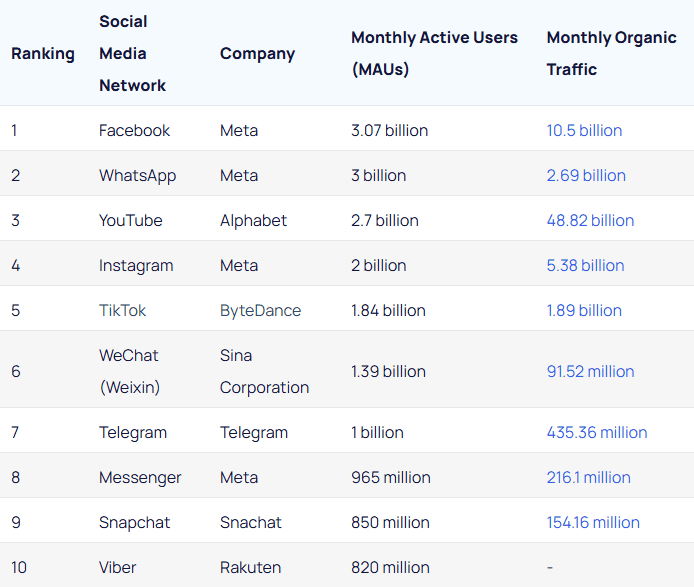
5. Facebook still leads the pack with 3.07 billion monthly users, followed by YouTube (2.5 billion), WhatsApp and Instagram (2 billion each), and TikTok (1.58 billion).
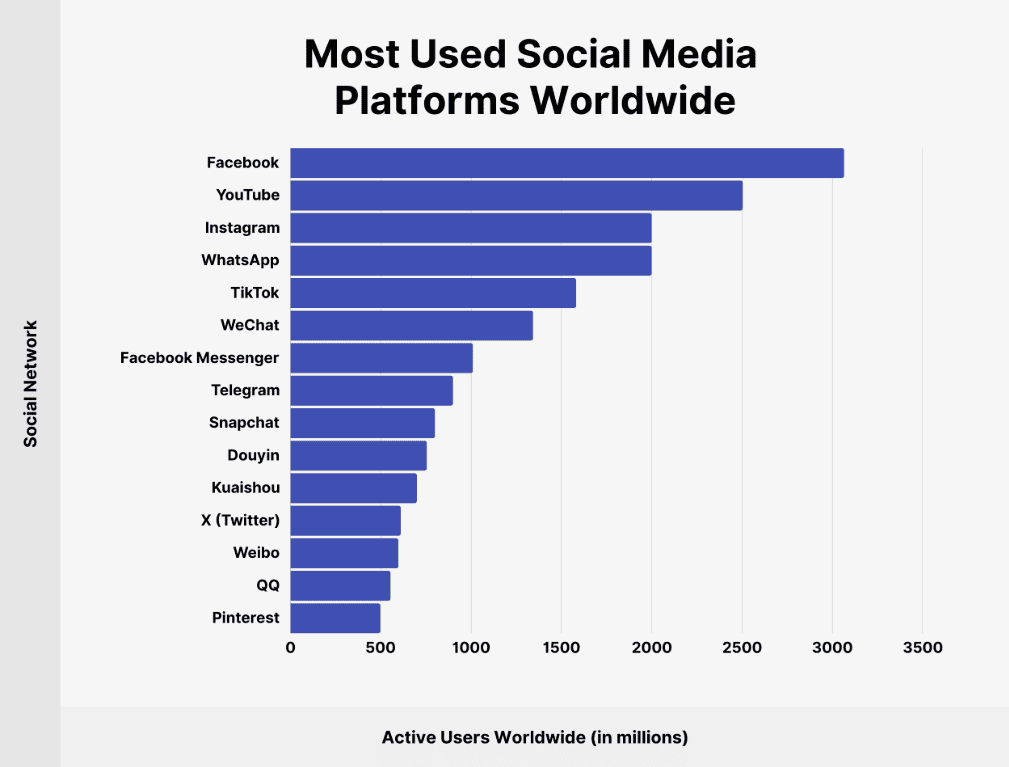
Most used social media platforms
6. In the U.S., the average person checks their phone about 159 times a day, often for social media updates.
7. Altogether, users are expected to spend over 4 trillion hours on social media this year alone.
8. Mobile phones make up 98% of the time people spend on social platforms, while computers only account for 2%.
9. The top things people do on social media are watching videos (82%), reading news (76%), and chatting with friends and family (72%).
10. The gender split for users is pretty balanced, with around 48% male users and 52% female users globally.
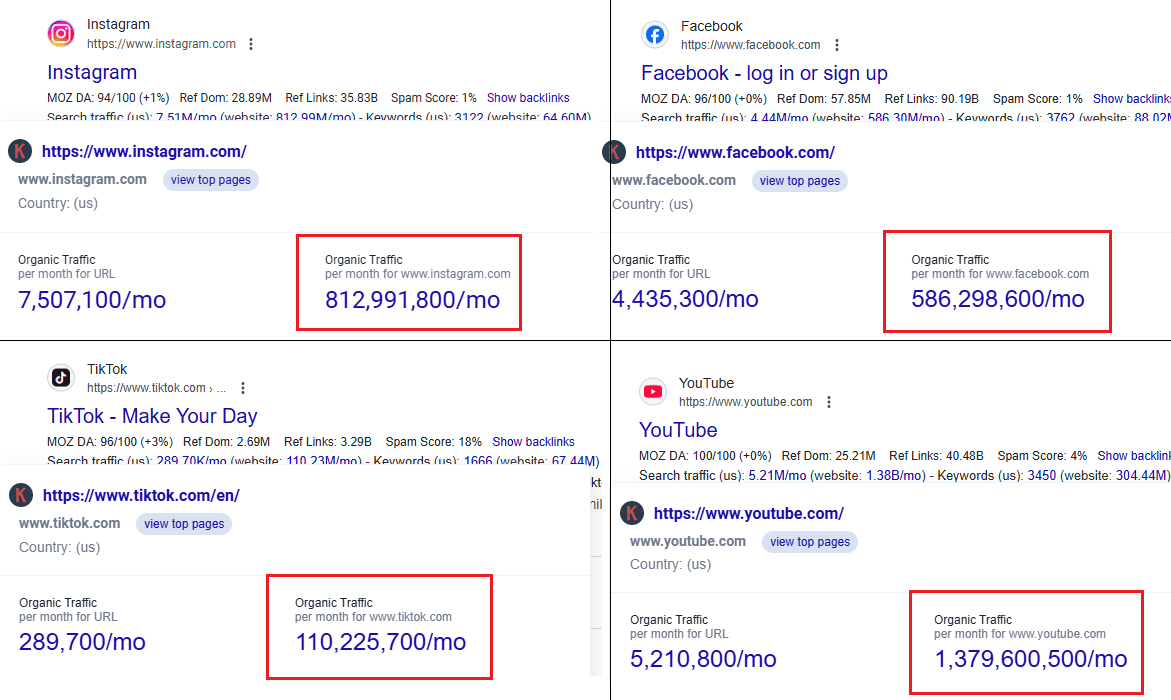
11. According to Keywords Everywhere, when it comes to Google searches, YouTube leads with 1.38 billion monthly visitors, followed by Instagram (812 million), Facebook (586 million), and TikTok (110 million).
How Many People Use Social Media in 2025?
From just a few million users in the early 2000s to more than half the global population today, social media has seen explosive growth in just a couple of decades, and it doesn’t seem to be slowing down anytime soon.
Below are the social media usage stats that show just how many people are plugged in across the world in 2025.
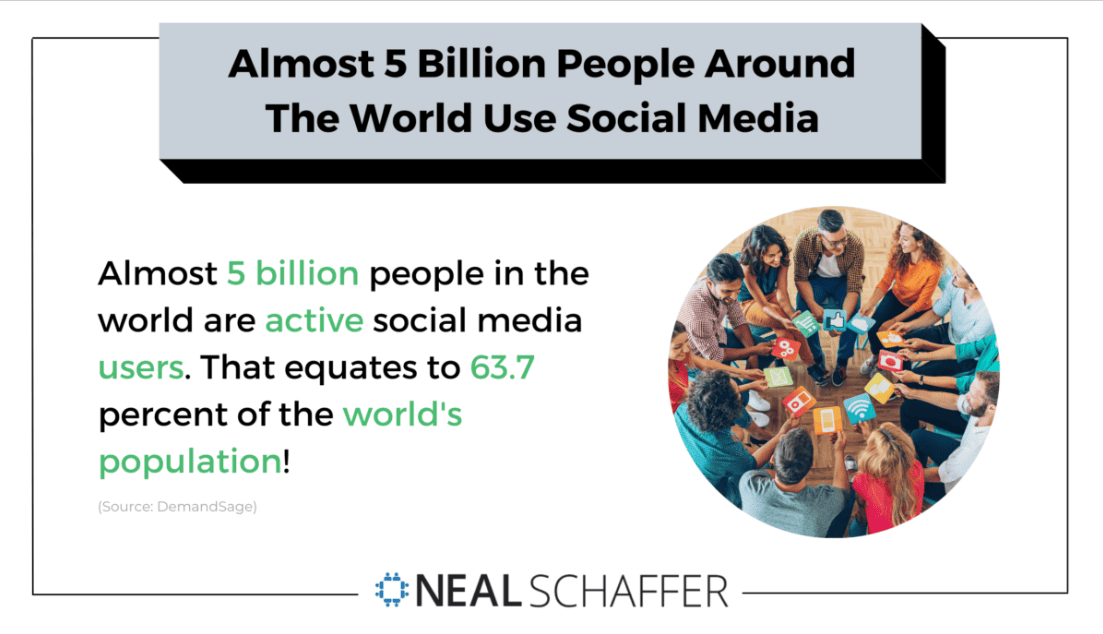
12. As of January 2025, more than 5.24 billion people around the world are using social media, which means nearly 64% of the global population is now online and active on these platforms.
Nearly 64 percent population worldwide is on social media
13. When looking at adults aged 18 and above, the number is even higher, with almost 87% of eligible people using social media regularly.
14. Out of the world’s 8.12 billion people, a little over 63% use social networks, no matter their age or whether they have reliable internet access.
15. Among the 5.56 billion people who do have the internet, a massive 94% are active on social media, showing just how essential it has become in daily life.
16. Social media use is highest in North America and Europe, where over 80% of people are active users, but Asia and Africa are catching up fast thanks to the growing availability of cheap smartphones and mobile data.
17. Over the past several years, social media growth has remained steady, especially between 2017 and 2020, when user numbers jumped from 2.8 billion to nearly 4 billion, driven in part by people spending more time online during the pandemic.
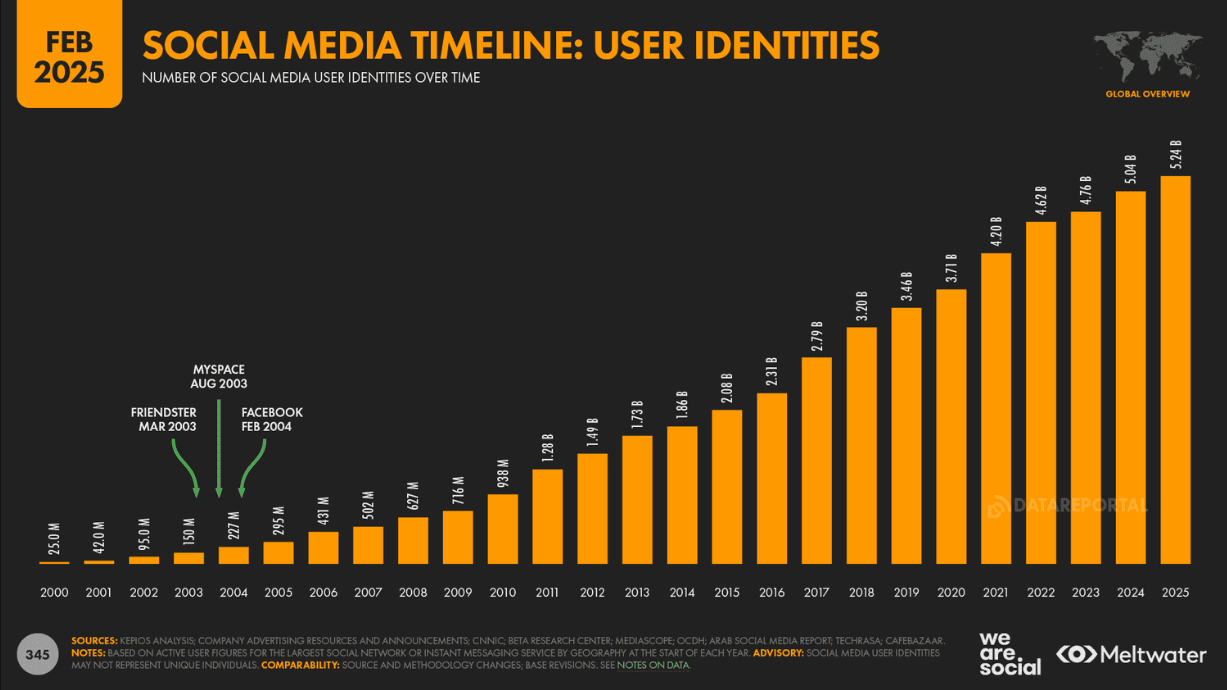
Social media user growth
Social Media Usage in the United States
With high internet access and a culture that embraces digital trends fast, Americans are among the most active social media users anywhere.
The following social media usage stats reveal how the U.S. stacks up in terms of users, habits, and platform popularity.
18. In 2025, about 253 million people in the U.S. are active on social media, which means roughly 73% of Americans use at least one platform to stay connected, scroll through content, or just pass the time.
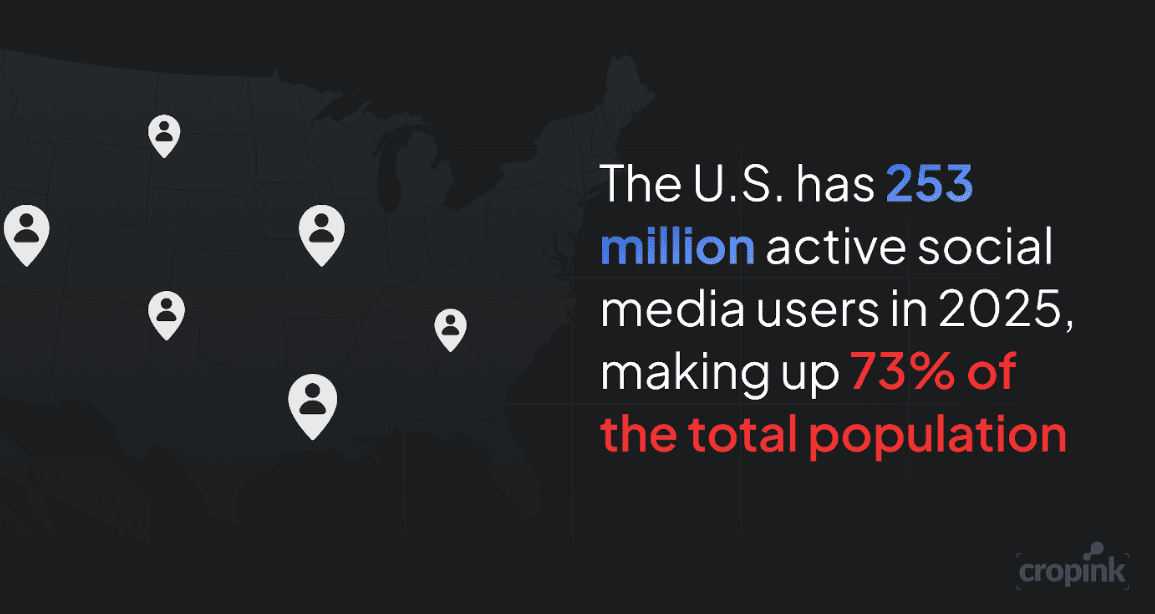
Social media users in the US
19. Looking at gender, around 78% of women and 66% of men in America are active social media users.
20. When broken down by race, social media use is highest among Hispanic Americans at 80%, followed by Black Americans at 77%, and White Americans at 69%, highlighting some interesting cultural patterns in digital engagement.
21. Younger generations are leading the way online—84% of Americans aged 18–29 use social media, followed closely by 81% of those 30–49, while usage drops to 73% for ages 50–64 and just 45% for people 65 and older.
22. In terms of platform popularity, Facebook is still on top with 177 million monthly users, followed by Instagram with 138 million, TikTok with 109 million, Snapchat with 90 million, Pinterest with 86 million, and X/Twitter with 50 million users in the U.S.
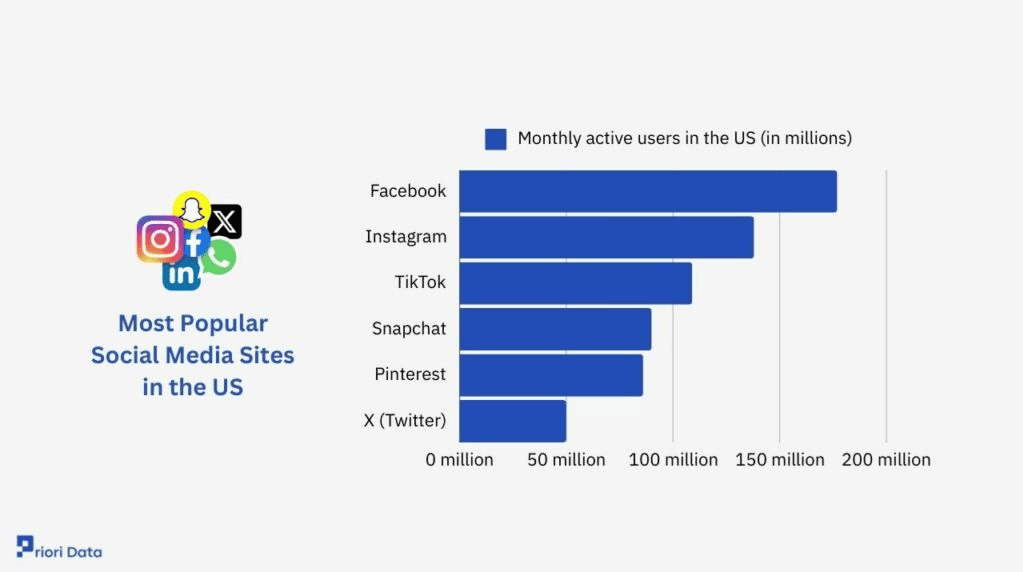
Most popular social media sites in the US
23. Facebook also sees the most daily activity, with 74% of its users checking in every day, while Snapchat (61%) and Instagram (63%) aren’t far behind in keeping people engaged daily.
24. Usage on X/Twitter is more spread out, with 42% using it daily, but nearly 30% of users only check it weekly or even less often.
Most Popular Social Media Platforms
Not all platforms are created equal.
While new ones pop up every year, only a few really dominate our screens, grabbing the most users and keeping people coming back multiple times a day with fresh content, engaging tools, and addictive algorithms.
Here are the social media usage stats that show which platforms are leading the race in 2025.
25. Facebook is the world’s most popular social media platform, with more than 3 billion people using it every month, which means nearly 37% of the global population logs on at least once monthly to scroll, share, or stay connected.
26. WhatsApp has climbed into second place with 3 billion users.
27. YouTube, once the top platform, now sits in third with 2.7 billion monthly users, still holding strong thanks to its massive video library and global reach.
Most popular social media websites 2025
28. Other big players include Instagram with 2 billion users, TikTok with 1.84 billion, and WeChat with 1.39 billion, each offering different ways to share and consume content.
29. Telegram has grown steadily, reaching 1 billion users, while Meta’s Messenger follows close behind at 965 million.
30. Snapchat continues to attract a younger crowd with its short-lived content and filters, pulling in 850 million users, and Viber rounds out the top ten with 820 million monthly users.
31. Meta dominates the landscape, owning four of the top five platforms—Facebook, WhatsApp, Instagram, and Messenger—making it a major force in how people around the world stay connected online.
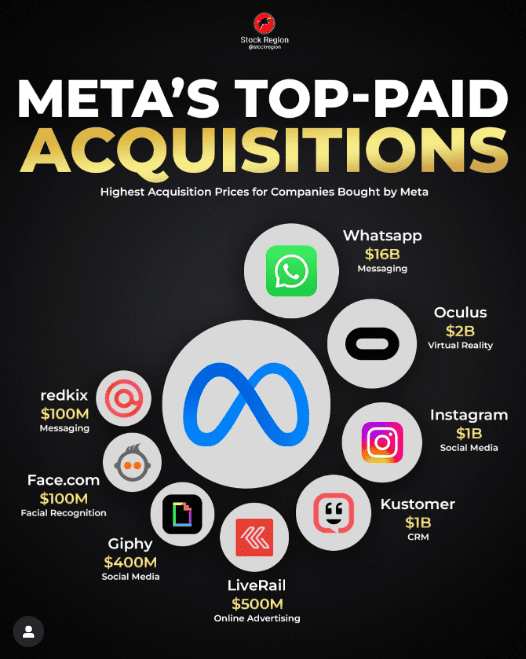
Meta’s top-paid acquisitions
Time Spent on Social Media
Scrolling through social media has quietly turned into one of the most time-consuming habits of modern life, with people spending hours a day—often without realizing how fast the time flies.
Whether you’re using it to unwind after work or just filling in the quiet moments between tasks, social media now competes with TV, books, and even sleep for your attention.
Below are the social media usage stats that reveal how much time people are really spending online every day and from where.
32. On average, people around the world spend about 2 hours and 23 minutes each day on social media, whether they’re watching videos, messaging friends, or scrolling through endless feeds.
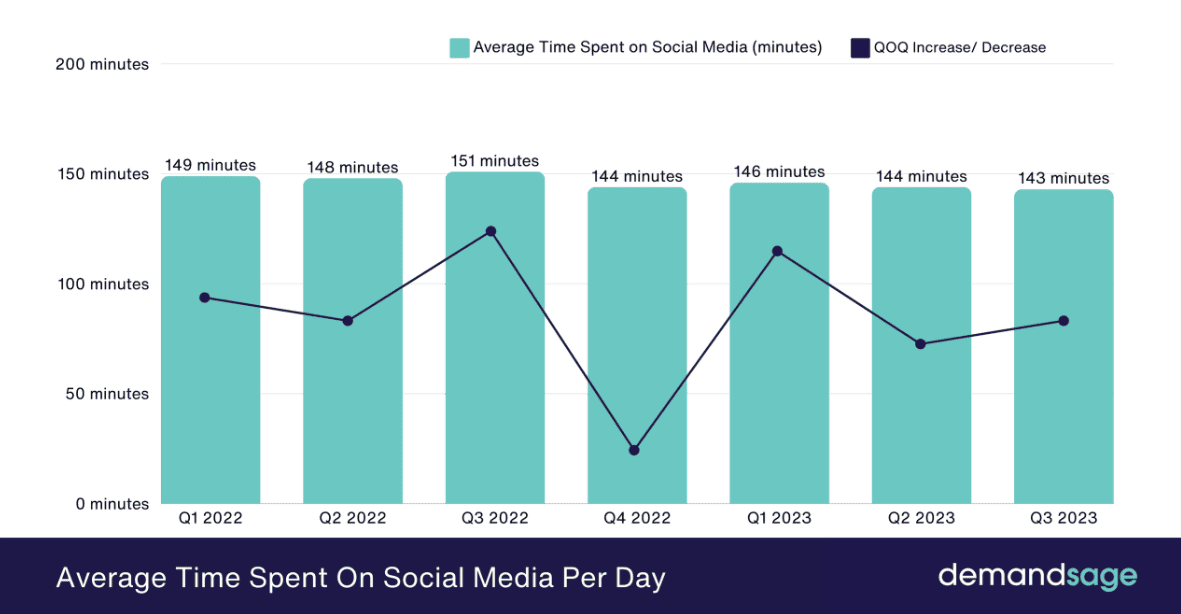
Average time spent on social media
33. In the United States, daily use is just a bit lower, with Americans spending about 2 hours and 8 minutes on social media—still a big part of the day for many.
34. Young people between 16 and 24 years old are by far the most active, spending an average of 3 hours and 38 minutes every day online.
35. When it comes to which app gets the most attention, TikTok leads the pack by far, with users spending an incredible 34 hours and 15 minutes per month on the app—far more than any other platform.
36. In fact, only five apps—TikTok, YouTube, Facebook, WhatsApp, and Instagram—see more than 15 hours of use per month, showing just how sticky and engaging these platforms have become for everyday users.
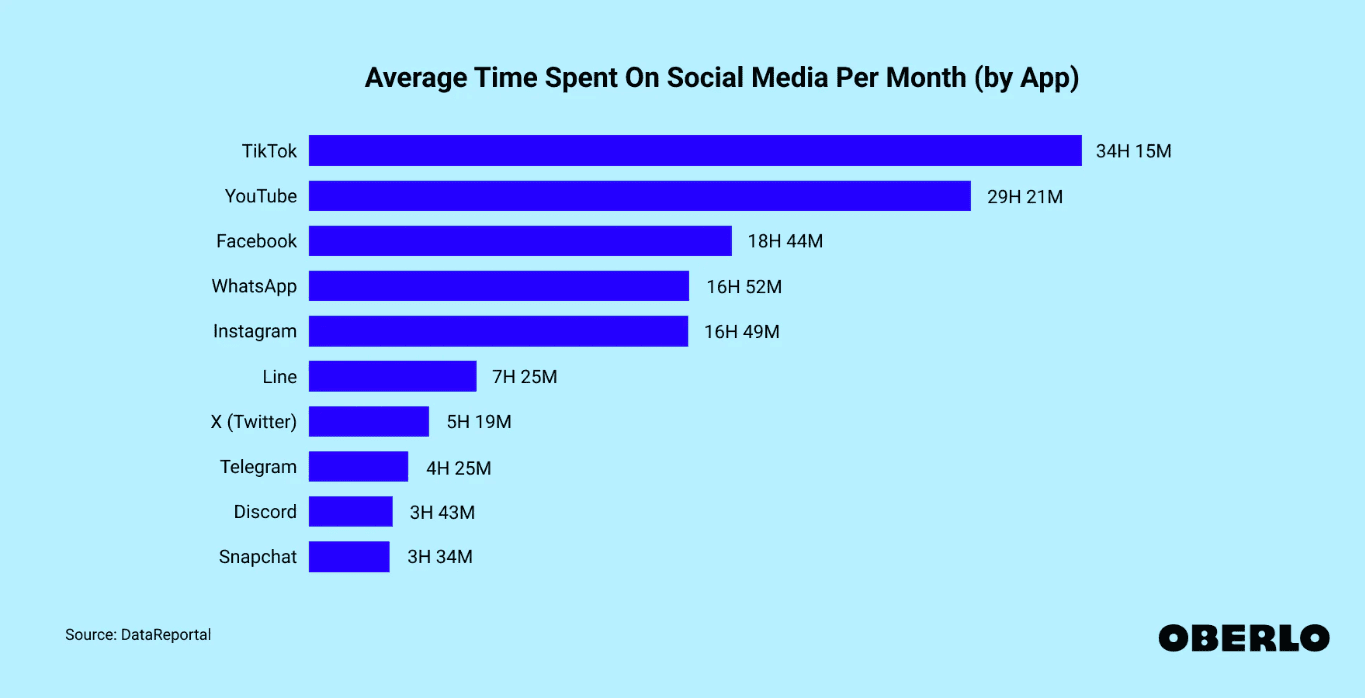
Average time spent on social media platforms
37. Latin America leads the way globally, with users spending about 3 hours and 32 minutes daily on social platforms.
38. In the Middle East and Africa, users still spend plenty of time online, averaging about 3 hours and 10 minutes per day, which points to strong social media engagement across the region.
39. The Asia-Pacific region has slightly lower daily averages at 2 hours and 16 minutes, but with such a massive population, it still represents one of the largest user bases worldwide.
40. Canada reports the highest daily usage overall, with people there spending an average of 3 hours and 54 minutes per day on social media—almost a full work shift per week spent online.
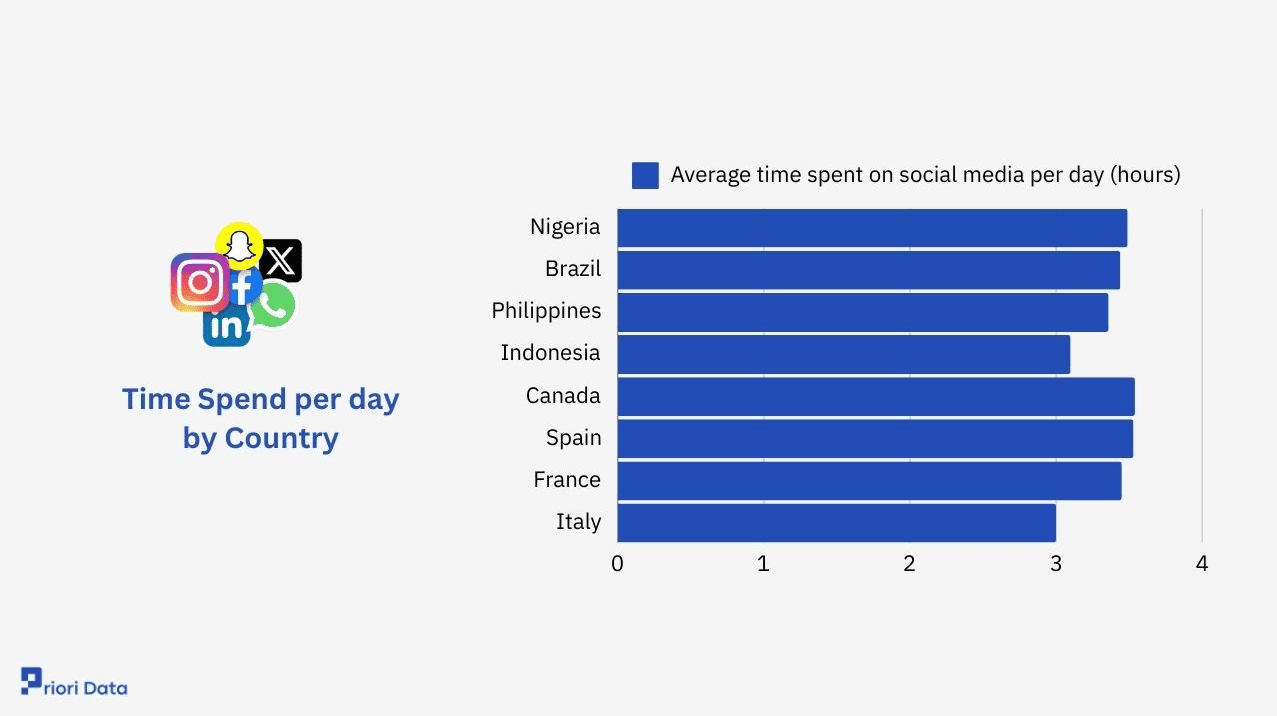
Time spent per day on social media by country
41. Right behind Canada is Spain, where users average 3 hours and 53 minutes, followed closely by Nigeria at 3 hours and 49 minutes, showing how important social media has become in everyday life.
42. France and Brazil also report high usage, with French users spending 3 hours and 45 minutes and Brazilians close behind at 3 hours and 44 minutes, proving that no matter the country, social media plays a major role in how people spend their time.
Social Media Penetration by Country
While social media feels universal, usage levels still vary widely depending on where you live.
In some regions, it’s a basic part of communication, while in others, it’s still gaining traction—but either way, the reach of social platforms keeps expanding year after year.
The following social media usage stats reveal which countries have the deepest digital footprints.
43. As of early 2025, Saudi Arabia holds the top spot for social media penetration, with a staggering 102% rate, meaning there are more social media accounts than people—likely due to users managing multiple profiles.
44. Right behind is the UAE at 96% and South Korea at 94%, showing just how deeply social platforms are woven into everyday life in these tech-forward countries.
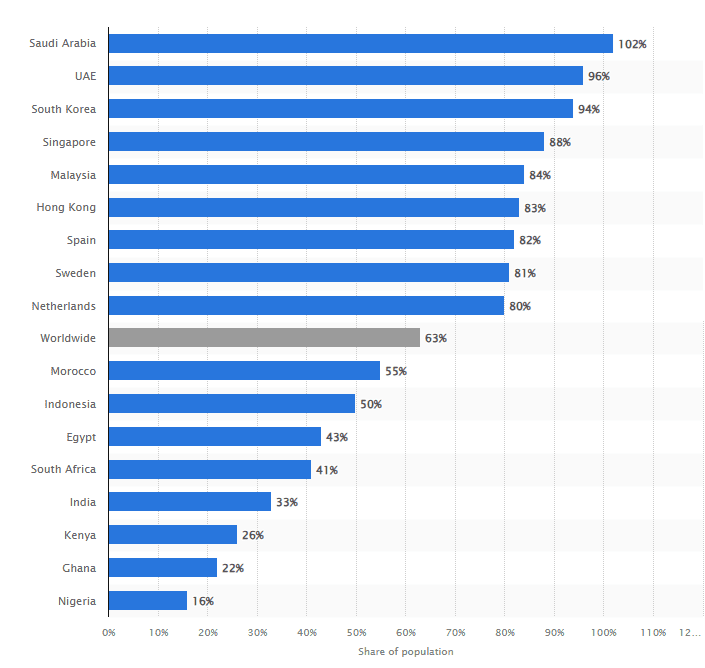
Social media penetration rate by country
45. On the other end of the spectrum, Kenya, Ghana, and Nigeria have some of the lowest social media penetration rates, with fewer than 26% of their populations regularly using social platforms. This is due to limited internet access or infrastructure challenges.
46. Interestingly, while Asia has some of the top-performing countries, it’s Northern Europe that leads by region, with 83.6% of people actively using social media, followed closely by Western Europe at 83.3% and Southern Europe at 76.7%.
47. Back in 2022, over 4.59 billion people were using social media globally, and that number is expected to keep growing, with projections showing it could reach nearly 6 billion users by 2027.
Social Media User Behavior
Who’s using social media isn’t just a question of how many but also who they are because different age groups, genders, and backgrounds all interact with platforms in their own unique ways.
Knowing who’s online and for how long helps us understand how social media shapes everything from pop culture to politics.
Here are the social media user behavior stats that break down the audience screen time, activity, and habits .
48. Millennials remain the most active age group on social media, with around 69% of them using it regularly in 2025.
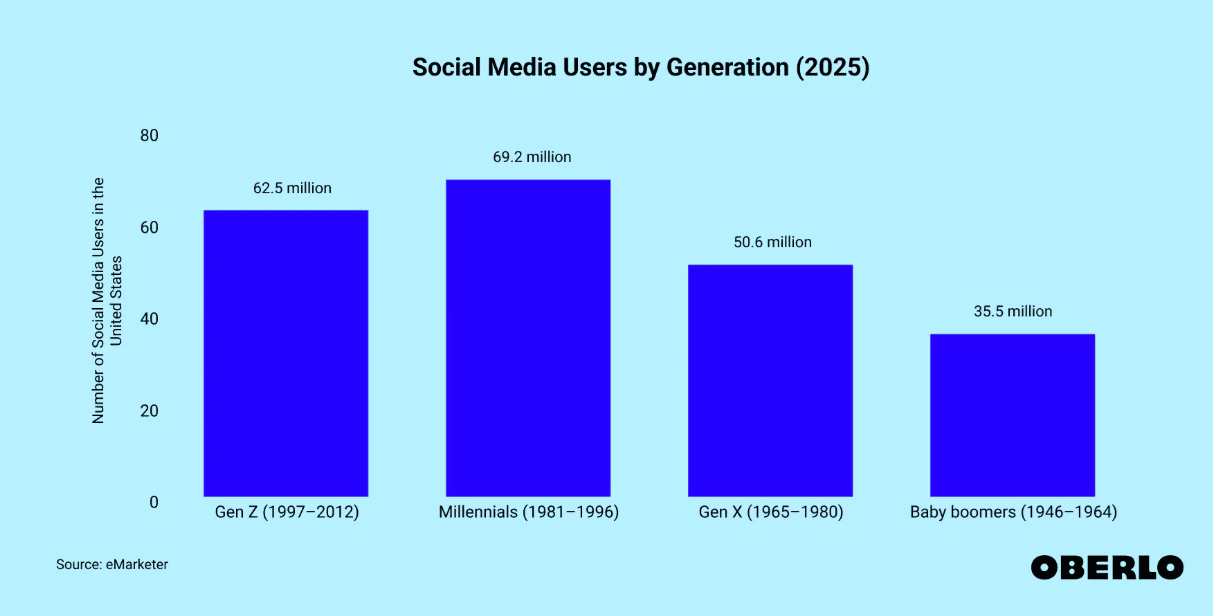
Social media users by generation
49. When it comes to daily time spent, young Gen Z women aged 16 to 24 are leading, spending an average of 2 hours and 59 minutes a day on social media, while Millennial women aged 25 to 34 are close behind with an average of 2 hours and 50 minutes.
50. Social media use starts early, with 13-year-olds in the U.S. spending about 4.1 hours a day on their feeds, and by the time they turn 14, that number climbs to 4.5 hours.
51. Seventeen-year-olds top the charts, spending an average of 5.8 hours a day on screens—making them the heaviest social media users in the U.S.
52. Around 74% of people multitask while using social media, whether they’re watching TV, commuting, or even doing chores.
53. Over half of users check their accounts multiple times during work hours, showing how social media has blurred the line between personal time and professional life.
54. About 70% of people admit to checking their social media within 10 minutes of waking up, making it one of the first things they do each day—even before brushing their teeth or grabbing coffee.
55. A study by the Addiction Center found that roughly 1 in 10 Americans may be addicted to social media, often feeling the need to check it constantly or struggling to cut back.
56. 41% of Americans say they’ve been targets of online abuse or bullying, with 25% reporting severe harassment, a number that’s risen sharply since 2014, when only 15% had reported such experiences.
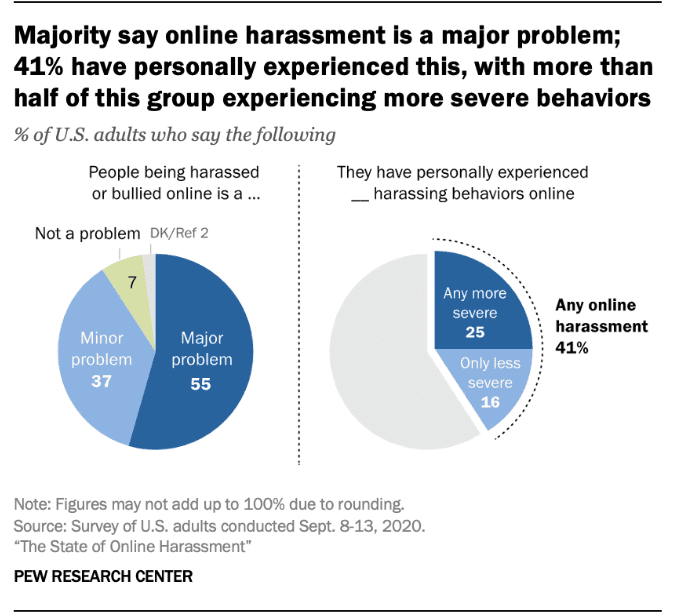
The state of online harassment
Main Reasons People Use Social Media
People use social media for all sorts of reasons, and while entertainment and staying in touch are always at the top, many are also turning to platforms for news, shopping, learning new skills, or even managing their careers.
The ways people use it keep evolving, and each platform serves a different need, from casual scrolling to serious networking.
Below are the social media usage stats that highlight the real reasons why people log on every day.
57. One of the biggest reasons people turn to social media is simple—they want to stay connected with friends and family, and according to a recent survey, about 51.5% of internet users say this is one of their main reasons for being online.
58. The next most common reason is something many can relate to—boredom—with 39% of users saying they hop on social media to fill spare time or pass a few minutes between tasks.
59. Reading news stories comes next at 34.4%, showing that social media has also become a key source of current events for many people around the world.
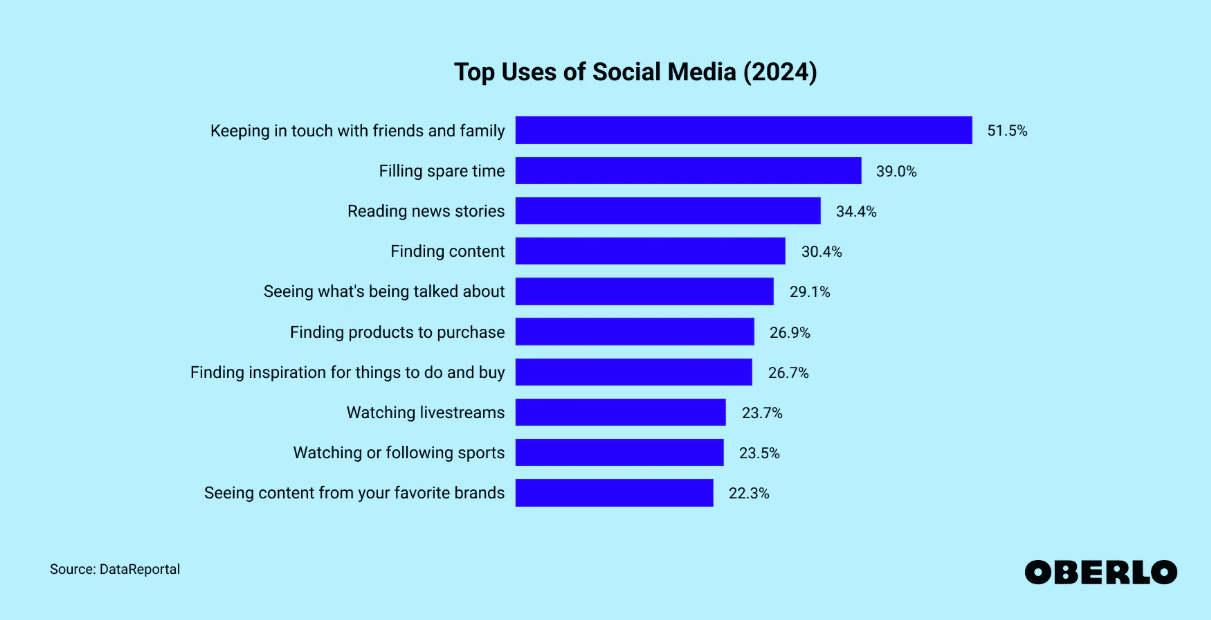
Reasons why people use social media
60. About 30.4% of users say they go online to find interesting content, while 29.1% want to see what topics are trending, whether it’s celebrity drama, breaking news, or the latest viral trend.
61. People also use social media to discover new products (26.9%) or to get inspiration for things to do or buy (26.7%), which helps explain why so many brands focus on visual and influencer-based content.
62. Watching live streams and following sports are also popular activities, with around 23.5% of users doing this regularly.
63. Rounding out the top 10 reasons is seeing posts from favorite brands, with 22.3% of users saying they enjoy this kind of content, showing that brand visibility and engagement really matter.
64. Another survey also revealed a slight difference by gender, with female users being more likely to use social media to stay in touch with people, while men were more evenly spread across different types of content.
Conclusion
Social media continues to shape the way we connect, communicate, and spend our time, with billions of people logging in daily across the globe.
From staying in touch with loved ones to discovering new products and trends, its role in everyday life is only growing.
As these social media usage stats show, social media isn’t just a trend—it’s a global habit that keeps evolving with each passing year.