Smartphones have completely changed how we stay in touch and get things done. They help us stay connected anytime, anywhere, making life more convenient.
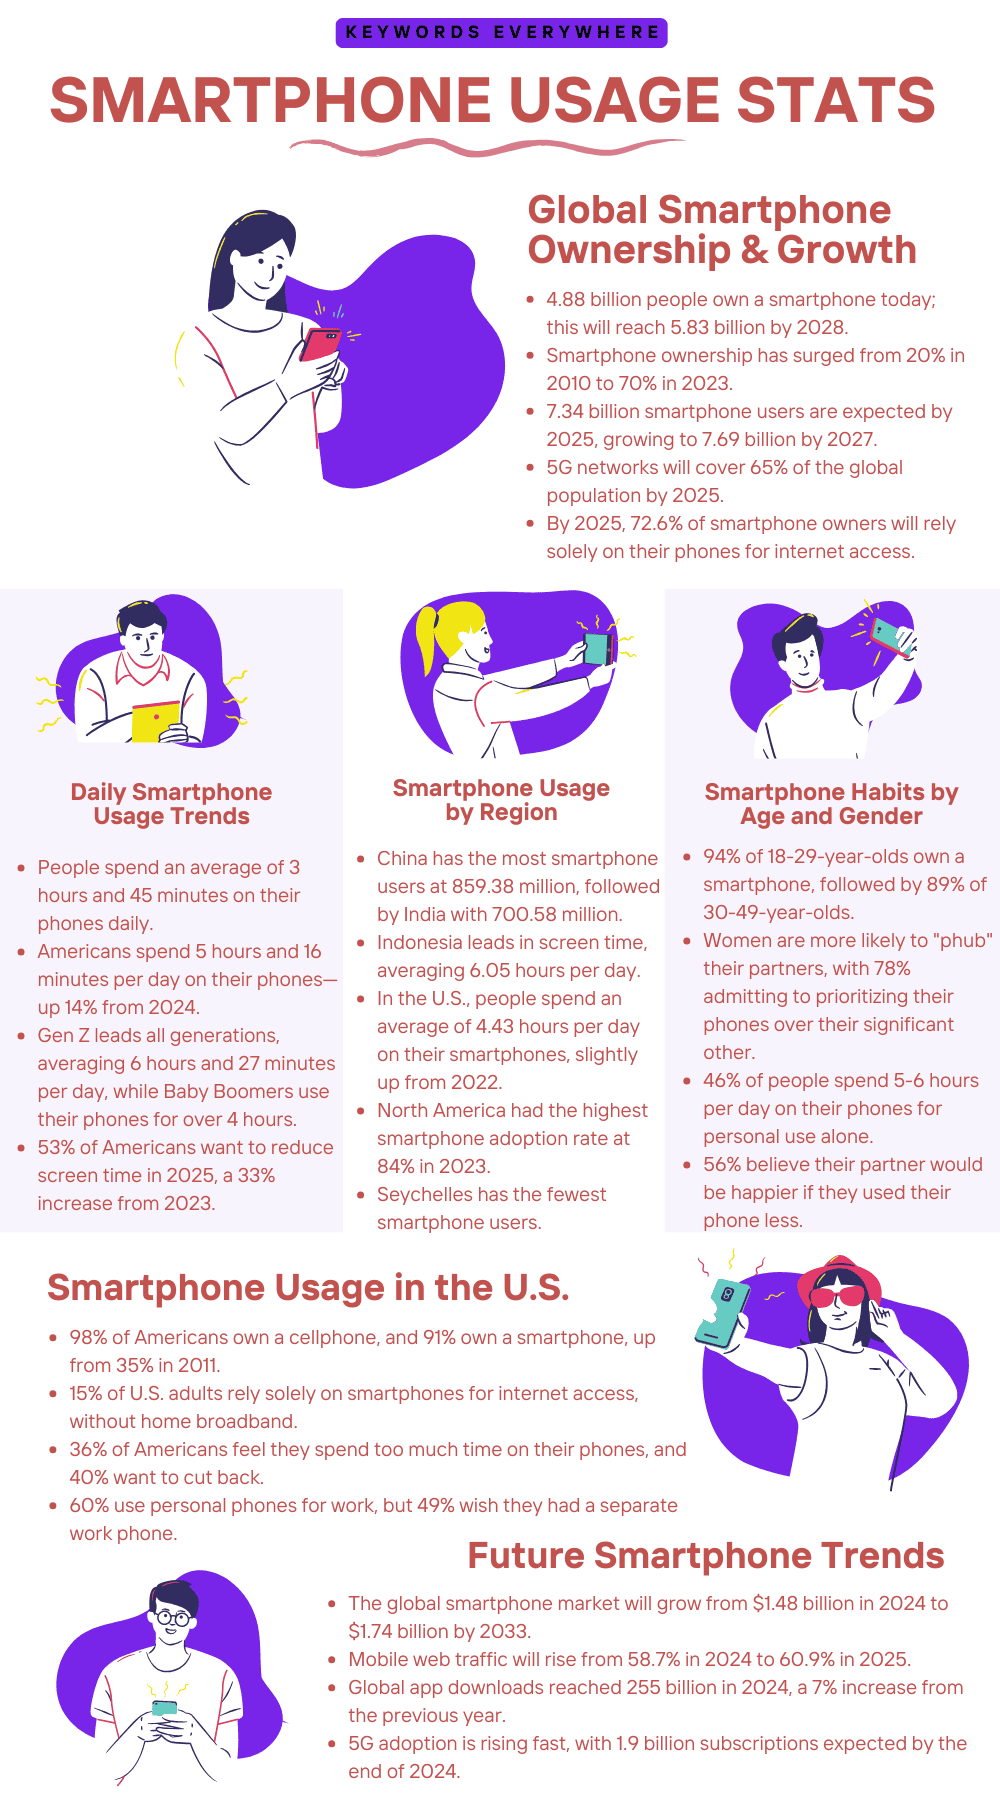
In 2010, only about 20% of people owned a smartphone. Fast forward to the end of 2023, and that number had jumped to nearly 70% of the global population.
In this article, we’ll dive into the latest smartphone usage stats—how much time people spend on their phones, how habits differ across regions (including the US), and how smartphone use has evolved over the years.


General Smartphone Usage Stats
If you’re short on time (though we highly recommend reading the full article—it’s packed with useful insights!), here are some key smartphone usage stats at a glance:
1. People spend an average of 3 hours and 45 minutes on their smartphones every day.
2. Right now, around 4.88 billion people own a smartphone, and this number is expected to reach 5.83 billion by 2028.
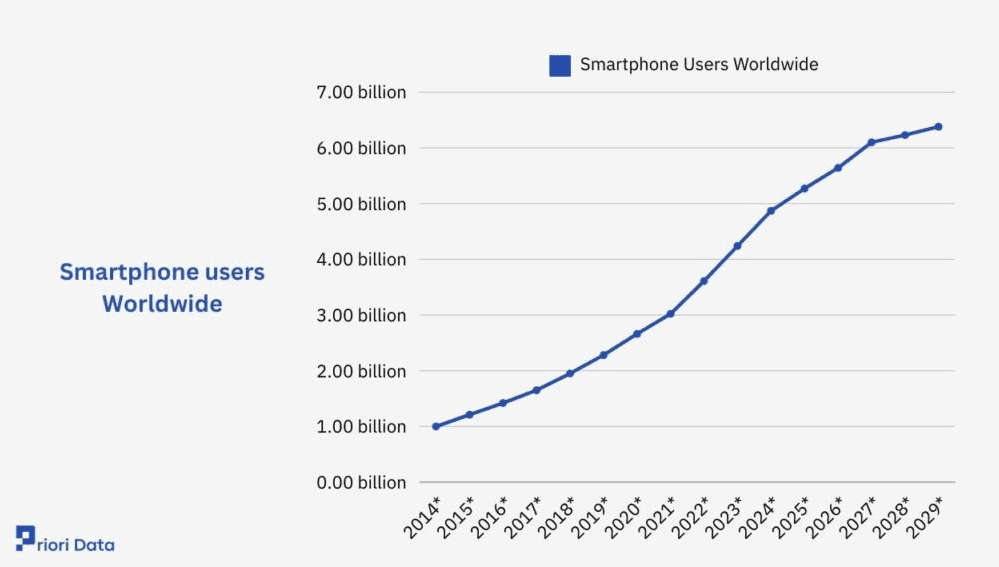
Smartphone users worldwide
3. Filipinos use their smartphones the most, spending more time on their phones daily than any other country.
4. In contrast, people in Japan spend less than half the global average time on their phones.
5. Among American adults, daily smartphone usage increased from 3 hours 38 minutes in 2021 to a projected 4 hours 2 minutes by 2025.
6. By 2025, sales made through smartphones (also known as m-commerce) are expected to double, reaching $710 billion, compared to $360 billion in 2021.
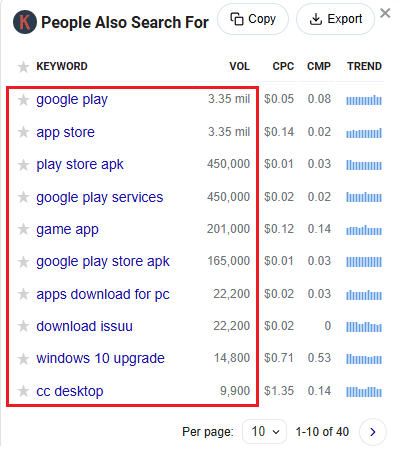
7. According to data from Keywords Everywhere, most people use web browsers to find and download mobile apps. This shows that a big chunk of their smartphone time is spent using these apps.
Average Time Spent on Smartphones Annually
Smartphones are more than just devices for calling and texting. They double as payment systems, health trackers, digital keys, measuring tools, and even remote controls for lights and appliances.
While they offer plenty of useful features, they can also be a huge distraction, pulling people in with social media, games, and endless streaming.
Health experts suggest limiting screen time to no more than two hours a day, but reality often looks quite different.
Let’s take a look at the smartphone usage stats to see how much time people actually spend on their smartphones each year.
8. Americans now spend an average of 5 hours and 16 minutes on their phones daily—a 14% jump from the 4 hours and 37 minutes reported in 2024.
9. Gen Z spends the most time on their smartphones, averaging 6 hours and 27 minutes per day, while Baby Boomers use their phones for a little over 4 hours daily (which is still double the recommended limit).
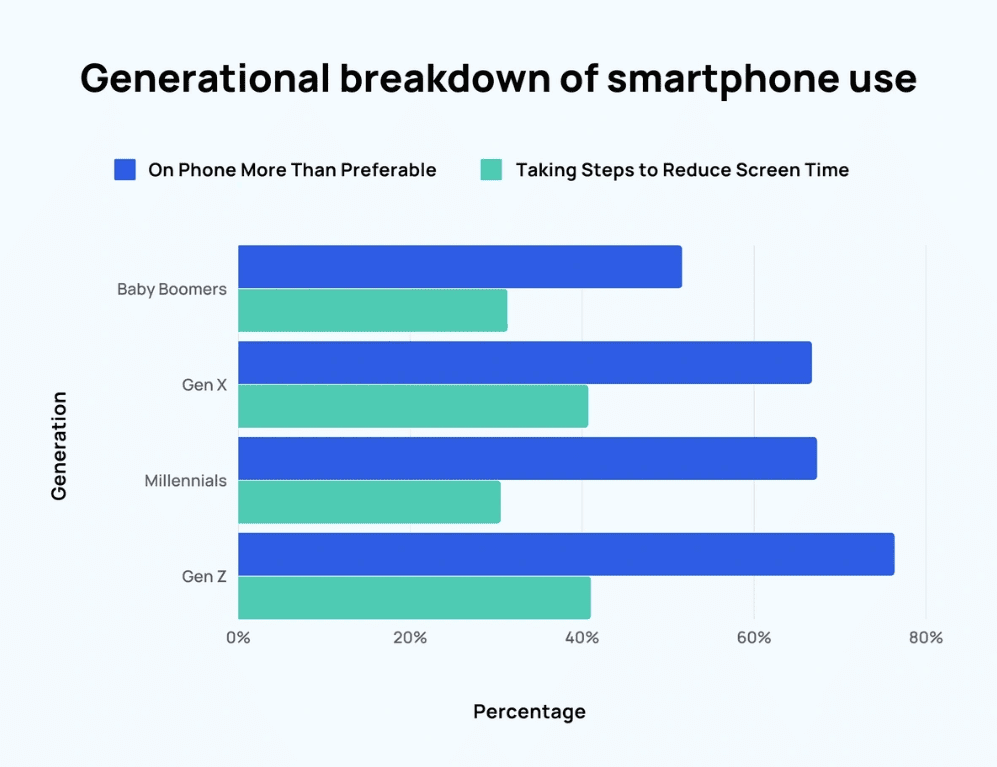
Generational breakdown of smartphone use
10. Compared to 2022, when Americans spent 2 hours and 54 minutes on their phones daily, phone usage has surged 52%, now averaging 4 hours and 30 minutes per day. This is expected to rise to 4 hours and 39 minutes this year.
11. More than half (53%) of Americans want to reduce their screen time in 2025, a 33% increase from 2023. The top reasons they want to cut back include:
- Better time management (67%)
- Improving mental health (64%)
- Boosting focus and attention span (57%)
- Getting better sleep (57%)
- Improving physical health (64%)
12. On average, people estimate spending 3 hours per day on their phones during work hours. But that doesn’t necessarily mean they’re slacking—60% use their personal phones for work.
- Nearly half (49%) wish they had a dedicated work phone, but 30% of those who asked their employer were denied.
- 67% haven’t asked their employer for a separate work phone.
13. As of late 2024, nearly 57% of all time spent online happens on mobile devices (including smartphones and basic phones), while the remaining 43% is on computers.
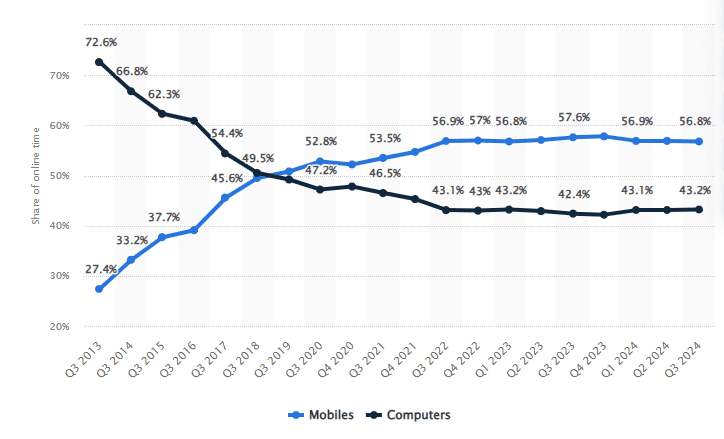
Average daily time spent online worldwide by device
Smartphone Usage by Region
Smartphones are now a daily necessity, especially in developed countries, where about 75% of people in the top 10 nations own one.
Let’s take a look at smartphone usage stats across different regions:
14. China leads the world in smartphone users, with a massive 859.38 million people owning a smartphone. India follows closely behind with 700.58 million users.
15. Seychelles has the fewest smartphone users, with just 50,000—a difference of 859.33 million compared to China.
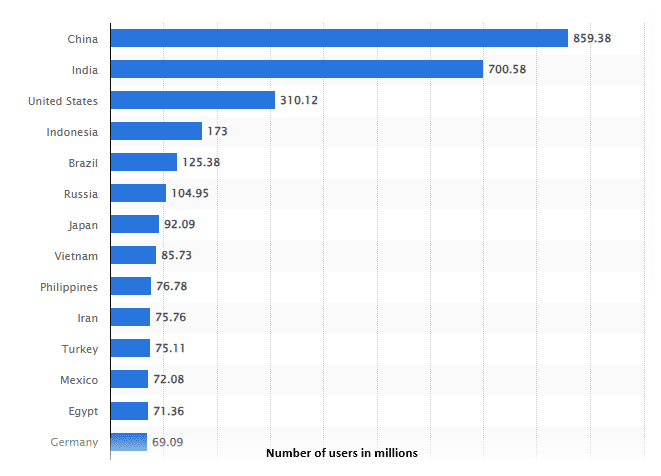
Ranking of the number of smartphone users
16. The United States has the highest percentage of its population using smartphones, with 81.6% of people actively using one.
17. Indonesia tops the list for daily smartphone usage, with people spending an average of 6.05 hours per day on their phones—the only country in the report to cross the 6-hour mark. Thailand (5.64 hours) and Argentina (5.33 hours) follow closely behind.
18. In the U.S., people spent an average of 4.43 hours per day on their smartphones in 2023, a slight increase from 4.42 hours in 2022.
19. Men in the U.S. are slightly more likely to own a smartphone than women, with 80% of men owning one compared to 75% of women. However, when it comes to owning a basic cell phone (non-smartphone), women are ahead by 3%.
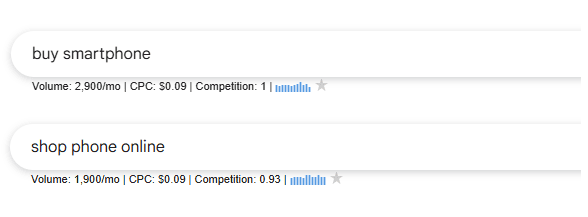
20. According to Keywords Everywhere, searches for terms like “buy smartphone” and “shop phone online” are quite popular in the U.S. This shows that more people now prefer to purchase their phones online rather than in stores.
21. Young adults (ages 18-29) have the highest smartphone adoption rate, with 94% owning a smartphone.
- 30 to 49-year-olds follow at 89%.
- 50 to 64-year-olds come next at 73%.
- Only 46% of those 65 and older own a smartphone.
22. North America had the highest smartphone adoption rate in 2023, with 84% of mobile connections being smartphones. By 2030, this is expected to grow to 89%, while Eurasia and the Asia-Pacific regions are projected to see even bigger increases.
Smartphone Consumption in the US
A huge number of Americans stay connected to the digital world through their smartphones, no matter where they are.
Here are some important stats that highlight how smartphones are used in the U.S.:
23. Almost all Americans (98%) own a cellphone, and 91% own a smartphone—a huge jump from just 35% in 2011, when the first smartphone ownership survey was conducted.
24. By 2025, U.S. adults (18+) are expected to spend about 4 hours and 2 minutes daily using the internet on their smartphones.
25. 15% of U.S. adults rely solely on their smartphones for internet access, meaning they don’t have a home broadband connection.
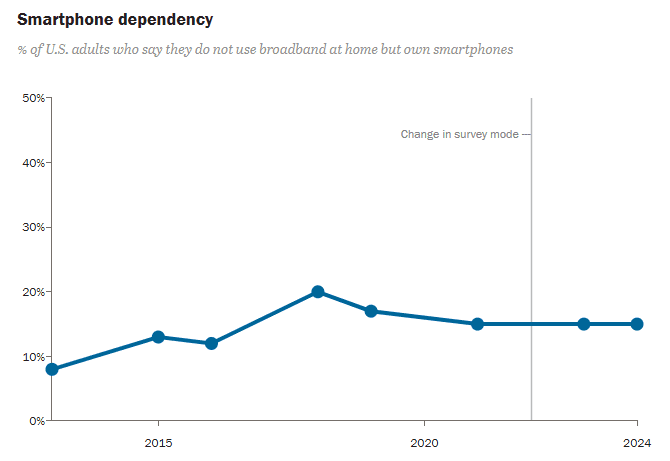
Smartphone dependency USA
26. Smartphone dependence is higher among lower-income households and those with less formal education. Young adults (18-29) rely the most on smartphones for internet access, while those aged 30-49 are the least dependent.
27. Over a third (36%) of Americans feel they spend too much time on their phones, and 40% want to cut back—but 27% doubt they’ll succeed.
28. Among smartphone owners, 15% live in “smartphone-only” households (no other connected devices). Only 8% of U.S. households own all four major connected devices—a smartphone, laptop, tablet, and smartwatch.
29. Apple dominates the U.S. smartphone market, holding more than half of the market share.
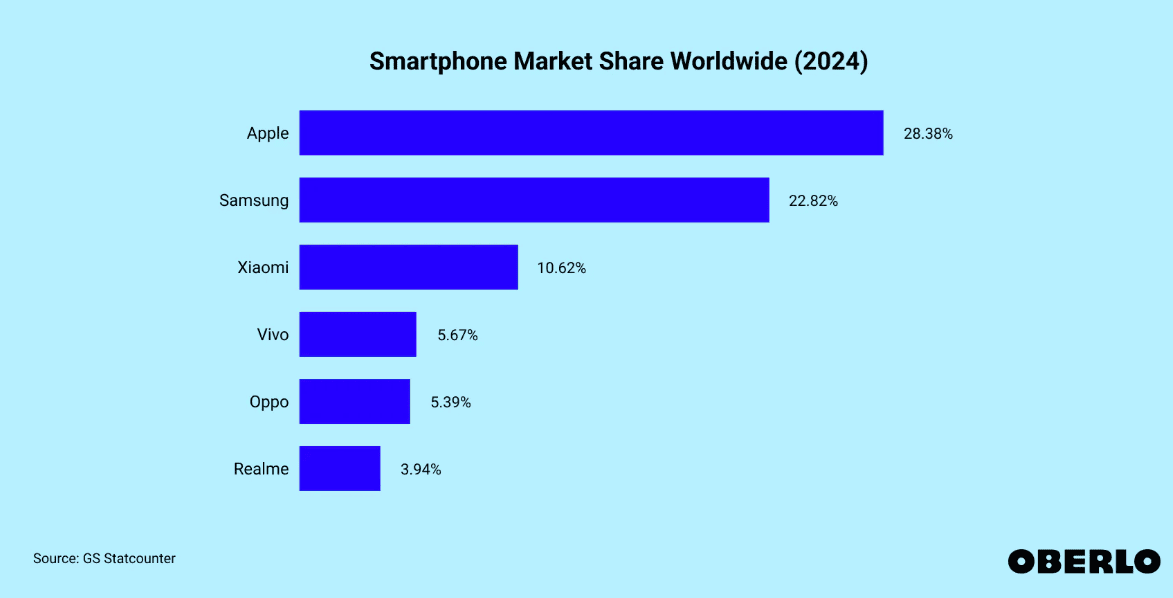
Smartphone market share worldwide
Smartphone Usage by Demographics
Which age group uses smartphones the most? Does income influence smartphone use? Do people want to cut back on smartphone time? And which generation spends the most time on their phones?
The smartphone usage stats below will answer all these questions about smartphone habits across different demographics.
30. Nearly 3 in 4 Gen Zers admit they spend more time on their phones than they’d like, while just over half of Baby Boomers feel the same way.
31. Women tend to use smartphones for longer than men. From a survey of over 30,000 people, the average daily screen time for women was 2 hours and 47 minutes, as compared to 2 hours and 34 minutes for men.
32. A shocking 46% of people say they spend 5-6 hours a day on their phones for personal use alone.
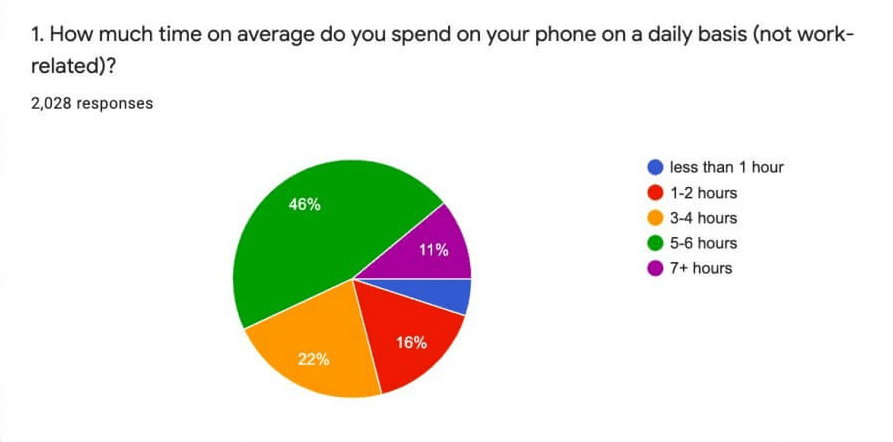
Daily smartphone screen time
33. Many people spend more time on their phones than with their romantic partner—at least 3-4 hours more per day. Only 7% of people reported spending less than an hour more on their phone than with their partner.
34. Gen X (ages 41-56) and Gen Z (ages 6-24) are the most likely to take action to reduce screen time.
35. 24% of Gen Z say their screen time has become a problem in their personal lives, which might be the push they need to cut back.
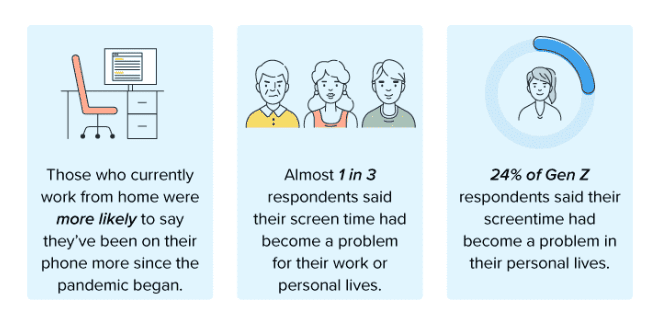
Screen time is a major smartphone problem among users
36. Women are more likely to “phub” (phone snub) their partners—78% admit to spending more time on their phones than with their significant other, compared to 64% of men.
37. More than half (56%) of people believe their partner would be happier if they cut down on phone use, with 34% strongly agreeing and 22% agreeing.
38. Smartphone ownership is higher in urban areas (83%) compared to suburban (78%) and rural areas (65%) in the U.S.
39. Ethnicity has little impact on smartphone ownership, with similar rates across different groups: 77% of White and Hispanic Americans own a smartphone, along with 75% of Black Americans.
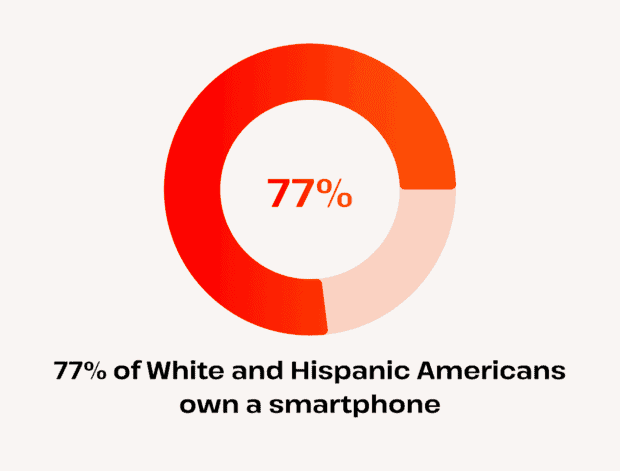
Smartphone use by race and ethnicity
40. Nearly all Black Americans (98%) own some type of cell phone, followed by 97% of Hispanic Americans and 94% of White Americans.
41. 67% of people earning under $30,000 a year own a smartphone. Ownership increases slightly among those earning $30,000-$49,999 (82%) and $50,000-$74,999 (83%).
42. Americans earning more than $75,000 a year are the most likely to own a smartphone, with 93% having one.
Future Projections for Smartphone Consumption
Smartphone usage has grown rapidly over the years, and it’s not slowing down anytime soon (as per the trends).
With advancing technology (like 5G), faster networks, and increasing global connectivity, smartphone consumption is expected to reach new heights.
Below, we’ve shared important stats that cover future projections for smartphone usage:
43. Smartphone use is expected to grow by 2-3%, reaching 7.34 billion users by 2025.
44. By 2027, the number of smartphone subscriptions is estimated to hit 7.69 billion.
45. By 2025, 72.6% of smartphone owners worldwide will rely on their phones as their only way to access the internet. Currently, there are about 10.37 billion mobile connections worldwide.
46. The global smartphone market was valued at $1.48 billion last year (2024) and is projected to grow to $1.74 billion by 2033.
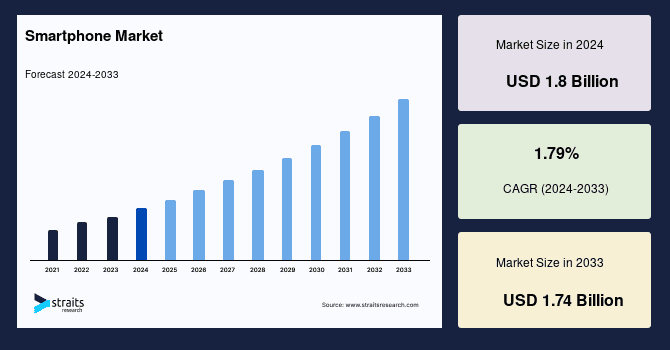
Smartphone market 2024-2033
47. Mobile devices accounted for about 58.7% of global website traffic in 2024, while desktops made up 41.3%. This gap is expected to grow, with mobile traffic reaching 60.9% in 2025.
48. In 2024, global app downloads hit 255 billion, a 7% increase from the previous year. The global app economy is expected to generate $613 billion in revenue by 2025.
49. 5G adoption is rising fast, with 1.9 billion subscriptions expected by the end of 2024. By 2025, 5G networks will likely cover 65% of the global population.
50. By 2025, nearly 80% of smartphone users (79.4%) are expected to make at least one purchase using their phone.
Conclusion
That brings us to the end of our look at smartphone usage statistics.
It’s evident that smartphones are more ingrained in our daily routines than ever, with screen time continuing to rise.
As technology advances and some new trends emerge, it will be interesting to see how our smartphone habits evolve and what the future of mobile connectivity holds.