SaaS has evolved from a cost-cutting solution into the backbone of modern business operations. As of 2025, the global SaaS market is valued at over $300 billion, projected to surpass $1 trillion by 2032.
This shows how deeply embedded these tools have become in every industry, from finance and healthcare to education and e-commerce.
But with growth comes complexity.
On average, companies now use 130 SaaS applications, and nearly 30% of these go unused, prompting tighter controls on spending and more focus on ROI.
At the same time, 73% of IT professionals say managing SaaS operations has become a top priority, especially as concerns around security and compliance rise.
In this article, we’ll dive into the most compelling SaaS statistics across growth, pricing, adoption, churn, AI integration, security, and more.


Top SaaS Statistics: A Quick Overview
The SaaS industry has become a driving force in how businesses operate, with widespread adoption across every major sector.
These general SaaS stats offer a big-picture view of just how embedded SaaS has become in the global economy and what that means going forward.
1. The global SaaS market is booming, with specialists predicting it will grow from $317.55 billion in 2024 to a massive $1.2 trillion by 2032.
2. SaaS revenue worldwide is growing fast, with an expected yearly growth rate of 19.38% from 2025 to 2029, reaching around $793 billion by 2029.

Global SaaS market
3. Almost 90% of IT pros say automation is crucial for handling SaaS tools, and 64% of companies say it’s helped cut down on manual work in a big way.
4. Companies use a lot of SaaS tools—about 275 on average—but over half the licenses go unused after just 30 days, leading to wasted money and resources.
5. Half of the businesses using many SaaS apps are moving to manage them all in one place, using SaaS Management Platforms to stay organized and save time.
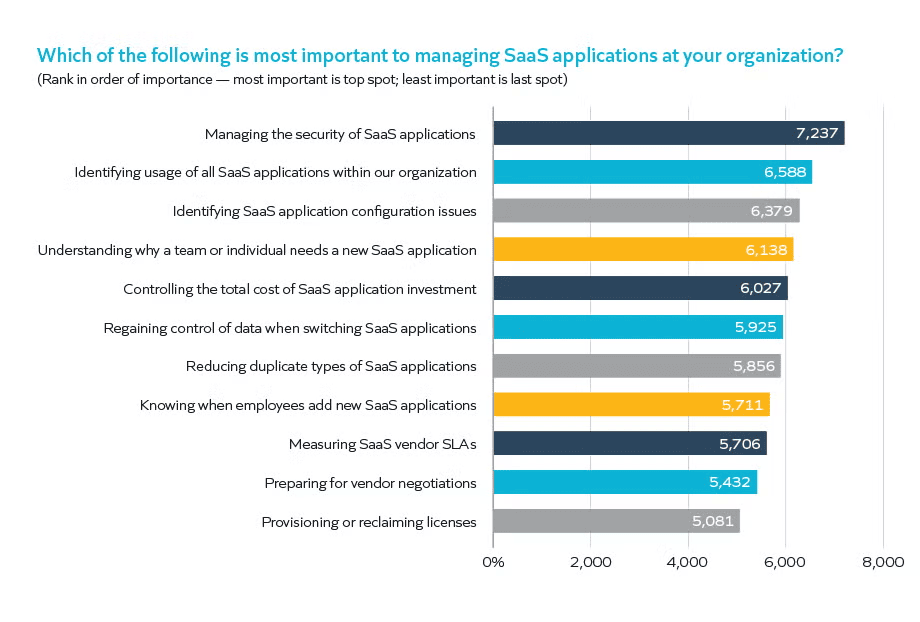
Most important thing to managing SaaS applications at your organization
6. About 72% of IT experts think zero-touch automation—where things run without needing hands-on help—will shape how SaaS is used in the near future.
7. Over 90% of organizations believe SaaS helps them grow, letting them use new technologies and increase their revenue more easily.
8. AI-powered SaaS is growing at lightning speed, with the market expected to hit $770 billion by 2031, thanks to a huge 40.2% yearly growth rate.
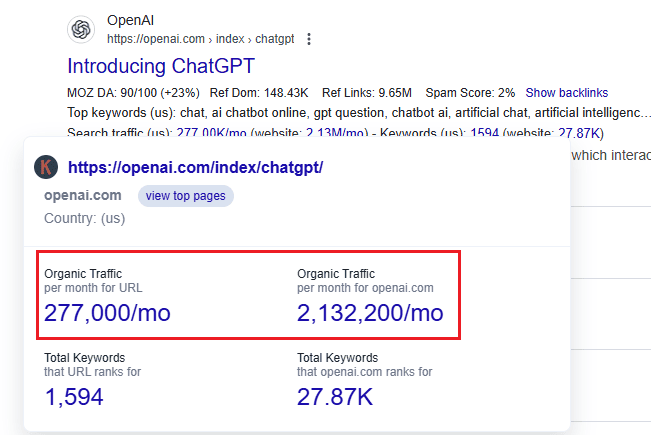
9. Popular SaaS tools like ChatGPT, Canva, LinkedIn, Udemy, Grammarly, and Adobe Acrobat keep getting renewed. ChatGPT alone pulls in 506 million searches a month and 2.13 million visitors through organic traffic, as shown by Keywords Everywhere.
SaaS Market Growth Statistics
While North America dominates the SaaS market share of companies and customers, the global market is forecasted to grow rapidly over the next few years.
Emerging markets and new industries are fueling this expansion with accelerated cloud adoption.
These SaaS statistics reveal the widespread success of the SaaS industry and its expected trajectory in the near future.
10. The global SaaS market is set to explode, jumping from $317.55 billion in 2024 to over $1.2 trillion by 2032.
11. North America is leading the SaaS race, holding 48% of the global market in 2023 with $131.18 billion in revenue.
12. From 2024 to 2032, SaaS is expected to grow steadily worldwide, with an average yearly growth rate of 18.4%.
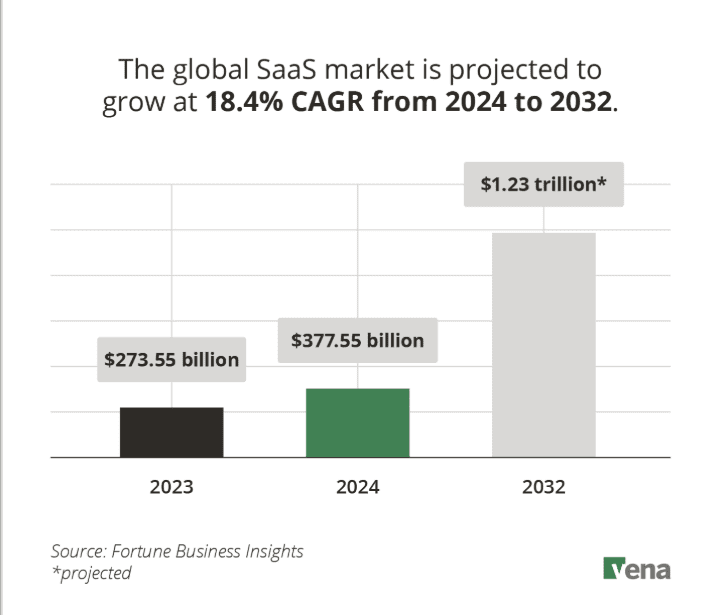
SaaS market projections
13. The Asia Pacific region is about to grow the fastest in the SaaS world, with a powerful 22% yearly growth rate expected over the next 10 years.
14. China’s SaaS market is quickly expanding, with projections showing it will hit $17.4 billion in 2025 and more than double to $37.98 billion by 2029.
15. India’s SaaS industry is on a strong path, aiming to grow fivefold, from $20 billion to $100 billion, by 2035.
16. Brazil is leading Latin America’s SaaS market, which reached $21.4 billion in 2024. Brazil alone was worth $3.9 billion in 2022, and the entire region is expected to grow by 12.5% each year through 2030.
17. Germany remains one of Europe’s top SaaS markets, growing from €6.85 billion in 2020 to a projected €16.3 billion by 2025.
18. There were more than 24,000 SaaS tools available in 2023, with customer service (17,000+ tools), marketing (14,800+), and e-commerce leading the pack.
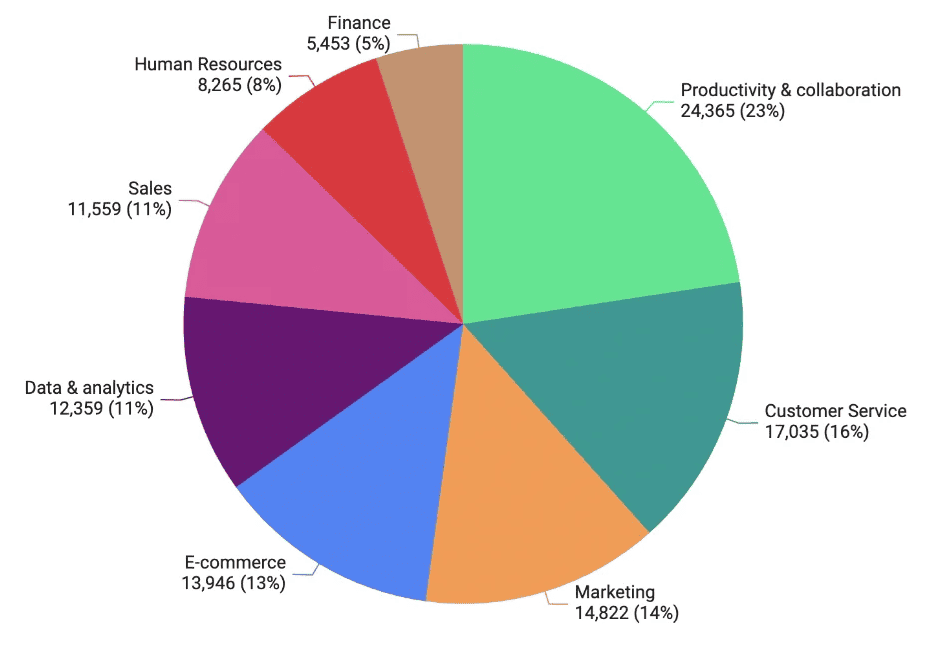
Productivity and collaboration solutions dominates SaaS market
SaaS Revenue and Pricing Statistics
As the SaaS industry expands, revenue models and pricing strategies are becoming key factors in how organizations manage their budgets and choose vendors.
These important statistics offer a clear look at the current trends shaping SaaS revenue and pricing.
19. Nearly 75% of SaaS is now bought directly from vendors, which is a huge drop of almost 87% from last year, showing more people prefer using resellers or online marketplaces instead.
20. Only 15% of SaaS companies rely mostly on pay-as-you-go pricing, while nearly half (46%) use a mix of usage-based and flat-rate pricing to offer more flexibility.
21. In 2024, public SaaS companies grew more slowly than usual, with their median growth rate falling below 20% for the first time.
22. Software now makes up more than 84% of the SaaS market, showing how product-based offerings are dominating over service-based ones.
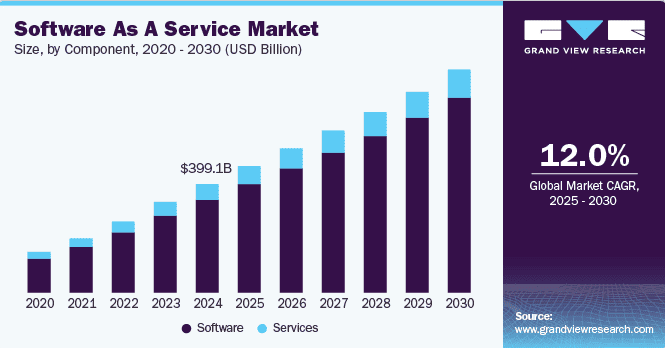
Software as a service market
23. By 2025, global SaaS revenue is expected to hit $390.5 billion, as more businesses keep turning to software solutions.
24. Big companies with over 1,000 employees brought in more than 60% of all SaaS revenue worldwide back in 2022, proving that large enterprises are still the biggest buyers.
25. Private cloud providers led the way in 2022, grabbing 43% of the SaaS market—the largest share among all market types.
26. For private SaaS companies, those earning under $1 million in annual recurring revenue (ARR) had a net revenue retention rate of 100%, while those making over $20 million reached 104%.
27. About 39% of SaaS businesses use value-based pricing, tailoring their rates to the benefits they offer, while 24% copy what their competitors charge.
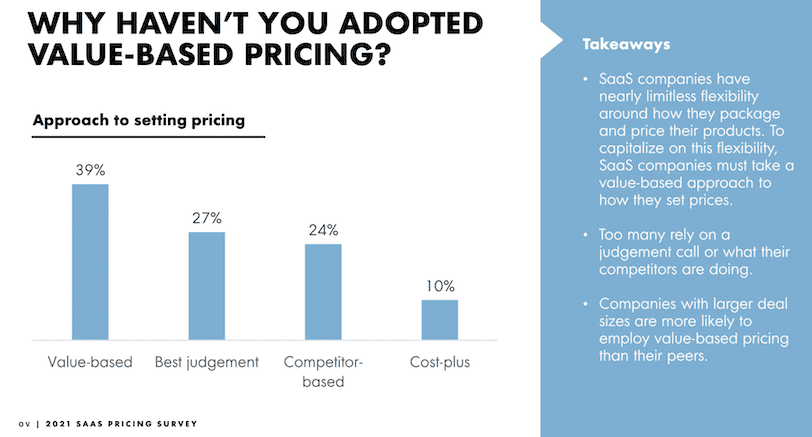
SaaS businesses pricing methods
28. There’s a near 50/50 split when it comes to showing pricing, with 45% of companies making their prices public and 55% keeping them hidden.
29. Most SaaS companies don’t give many discounts, with 68% saying they discount fewer than one in four deals, and nearly 30% saying their sales teams barely discount.
SaaS Adoption and Usage Statistics
SaaS tools are no longer limited to IT or tech teams—today, they’re used across departments and industries.
These stats show how SaaS adoption has expanded and how companies leverage these platforms in day-to-day operations.
30. By 2025, a solid 85% of business apps will run on SaaS, showing that cloud-based software has become the go-to choice for most enterprises.

Average number of SaaS apps per company over the years
31. In 2024, 42% of SaaS tools used by companies were considered shadow IT, meaning they weren’t managed by the IT department, and with 65% of apps unapproved, this creates serious security risks.
32. Operations teams added more SaaS apps than before, growing from 74 to 87 tools, though other teams like IT, Sales, and Product saw even faster growth.
33. Customer success teams had the slowest growth in SaaS use, adding just 5% more tools and averaging 61 apps overall.
34. The average company used 112 SaaS apps in 2024, down from 130 in 2022. Nearly half of those licenses go unused, and spending per employee reached $5,607.
35. Companies cut back on app use in 2024, with the average number dropping to 342 from 374 in 2022. Still, most apps (65%) remain unsanctioned, and ChatGPT was the most-used shadow IT tool.

Workplace AI usage by account type
36. SaaS companies rely on software just like everyone else, with nearly 90% of IT pros saying automation is essential—and 64% noting it’s helped them cut down on manual work in a big way.
SaaS Churn and Retention Statistics
SaaS used to be seen as a smart way to trim IT budgets, but that view has shifted. More companies now recognize that SaaS tools can reshape how entire teams work—not just save a few dollars.
As adoption surged, so did the number of SaaS vendors on the market. That led to tool overlap, and now, with tighter budgets, many businesses are rethinking what they really need and where they can cut back.
Churn has always been a tricky KPI in the SaaS space. Even when companies ask why users leave, the answers aren’t always clear—and predicting churn is even harder.
Without knowing exactly what’s driving it, fixing it becomes a challenge.
Let’s dig into the latest SaaS adoption and churn statistics.
37. Most SaaS companies lose about 5% to 7% of their customers each year, which is seen as a healthy range—anything higher usually means it’s time to improve customer loyalty.
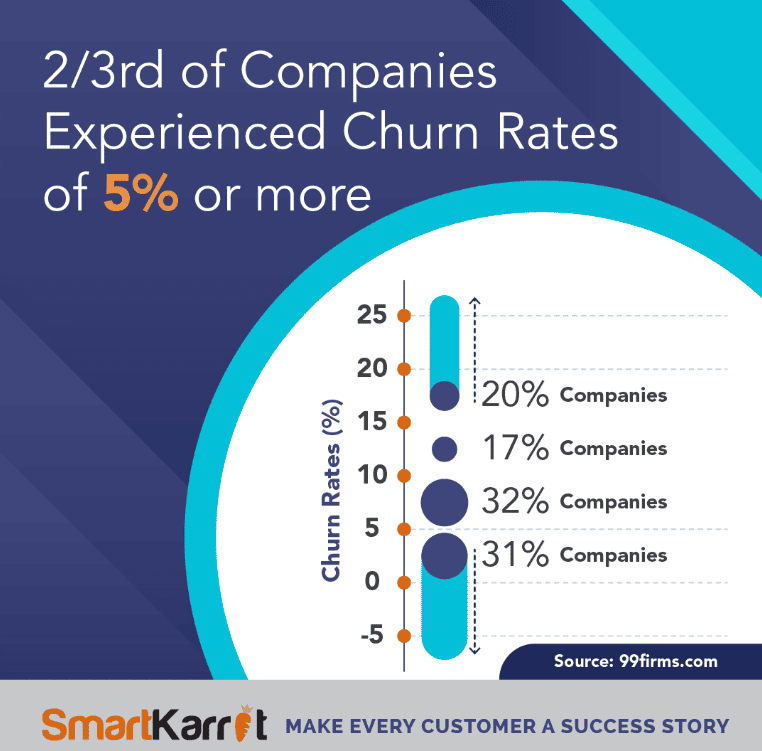
SaaS companies churn rates
38. Bigger SaaS companies making over $10 million a year have an average churn rate of 8.5%, while smaller companies often lose over 20% of their customers.
39. Just cutting churn by 5% can boost profits by 25% to 95%, showing how keeping customers longer can make a huge difference financially.
40. SaaS companies with monthly contracts lose about 14% of customers, while those on 1 to 1.5-year contracts aren’t far behind at 15%, showing that longer contracts don’t always mean lower churn.
41. Up to 40% of customer churn can be avoided, often caused by things like failed or expired credit cards—this kind of preventable loss can cost companies 1–2%, even when overall churn looks low.
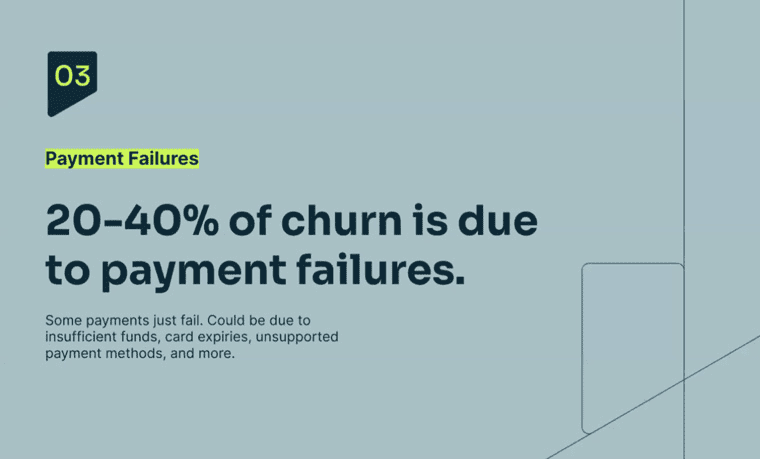
Payment failure is a big reason for churn
42. SaaS companies earning over $1,000 per account monthly see strong retention, with top performers keeping more than 110% of their revenue thanks to loyal, growing customers.
43. On the flip side, B2C companies making less than $25 per account per month see much lower retention, with top performers only hitting 70%, which shows how pricing and customer type can impact loyalty.
44. The best SaaS companies at keeping customers grow nearly twice as fast as their rivals, proving that retention is a key driver of success.
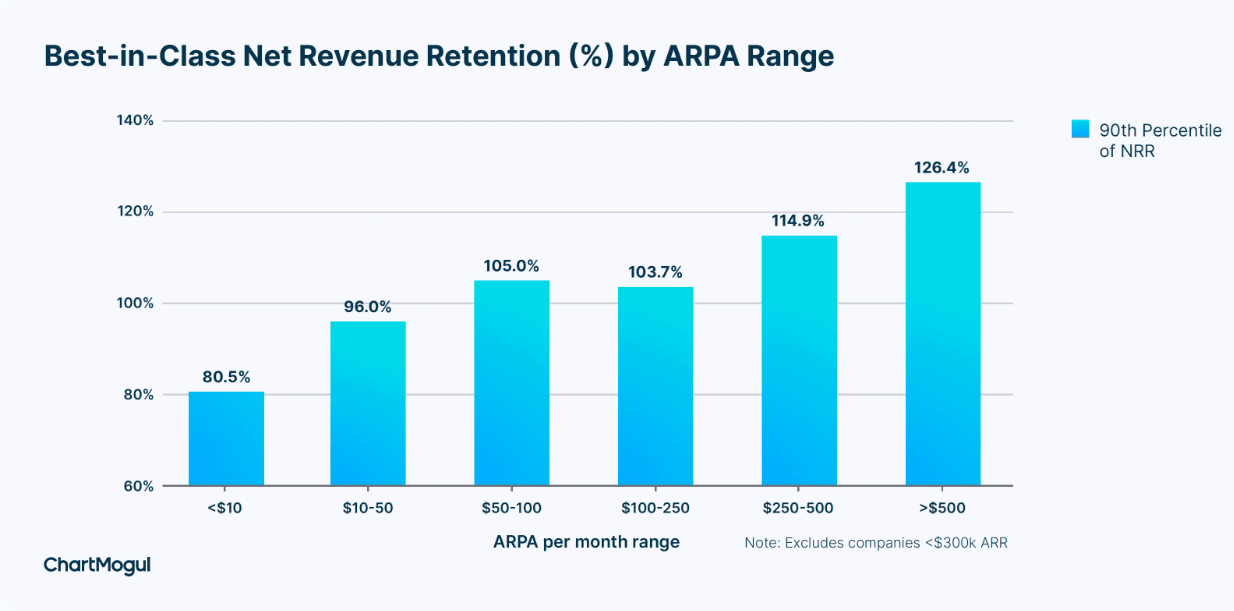
SaaS companies best-in-class net revenue retention
AI and Automation in SaaS
AI is becoming deeply integrated into SaaS products since 2023/24, changing how platforms operate and what users expect.
From smart analytics to automated workflows, these SaaS stats highlight the rising role of AI across the SaaS landscape.
45. The global AI software market hit $16.98 billion in 2024 and is set to grow fast, reaching $80.6 billion by 2031, with a yearly growth rate of nearly 30%.
46. Private investment in AI startups is booming, with global funding expected to reach $200 billion by 2025—and half of that coming from the U.S. alone.
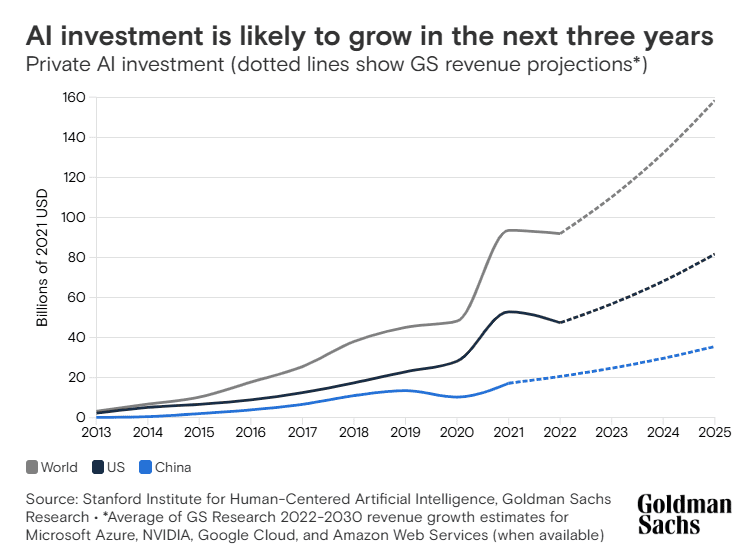
AI Investment will grow in the coming years
47. By 2028, generative AI could cut the risk of breaking software and cloud rules by 30%, helping companies stay compliant more easily.
48. Over 80% of businesses are expected to use AI-powered apps in their IT systems by 2026, a huge jump from just 5% in 2023.
49. AI-driven SaaS tools are great at handling repetitive tasks, helping companies save time, lower costs, and get more done with less effort.
50. Using AI for cybersecurity can lead to big savings, with companies that use AI and automation heavily saving an average of $2.22 million by preventing data breaches.
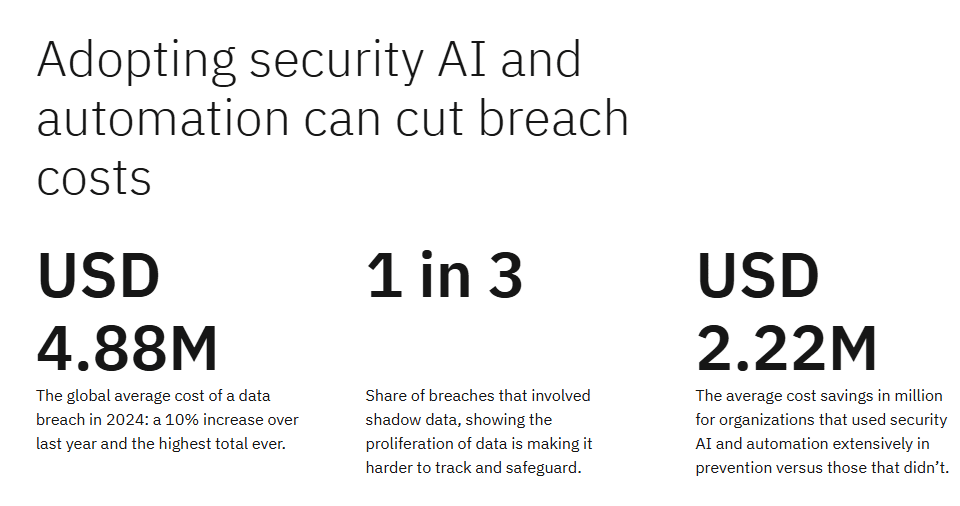
AI and automation can cut data breach costs
51. AI is becoming standard in tech development, with 43% of Bessemer Venture Partners’ investors saying nearly all their companies have AI-powered features on the way—and another 23% say most of their companies do too.
SaaS Spending and Investment Statistics
SaaS spending keeps climbing as businesses expand their digital tools and lean harder into cloud-based solutions. With more platforms in play, knowing where the money goes has become just as important as the tools themselves.
Looking at how companies spend on SaaS can reveal a lot—how they prioritize, where they might overspend, and what budgeting looks like moving forward.
Here are some key stats that break down SaaS spending and investment trends.
52. In 2022, companies spent over $172 billion on SaaS tools, which is nearly 450% more than they paid in 2015, showing just how fast cloud software has taken over.
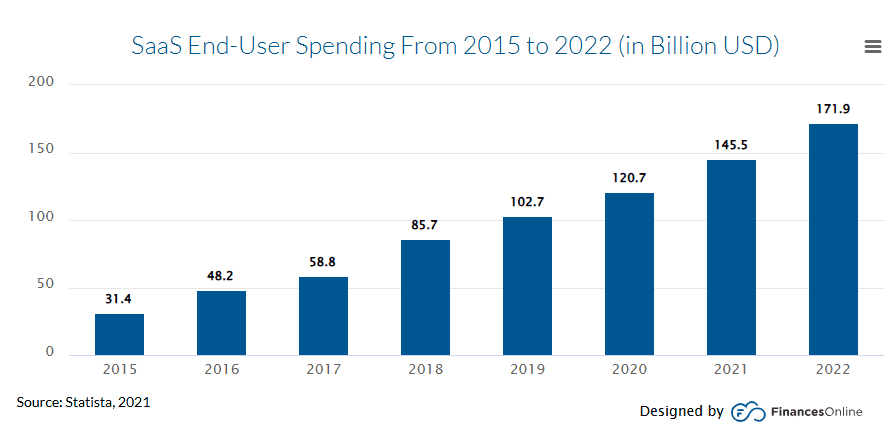
SaaS end-user spending from 2015-2022
53. Today, business teams control 70% of SaaS budgets and buy over half of all apps, showing a shift away from IT departments making all the decisions.
54. Nearly all IT leaders—94%—say managing SaaS manually leads to bad choices, especially when it comes to spending and keeping track of tools.
55. Employees are behind 34% of the SaaS apps companies use, but those only make up 4% of total spending, meaning people add lots of tools without big budgets.
56. The average company now spends around $49 million on SaaS, or about $4,830 for each employee, slightly up from $4,600 per employee the year before.
57. More than half of SaaS licenses—about 53%—go unused, costing companies around $21 million a year in wasted spend, and that number keeps climbing.
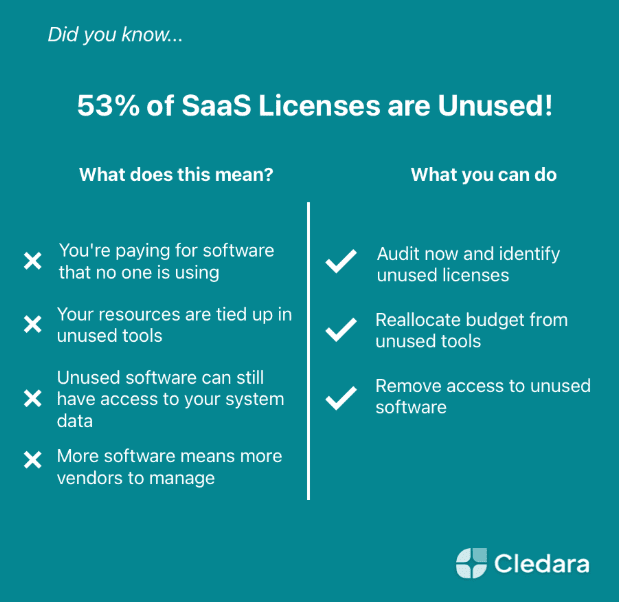
More than half SaaS licenses are unused
58. Most SaaS budgets—85%—go toward renewing existing tools, while only 15% is spent on trying new ones, which shows companies are focused on keeping what they already use.
59. Only 36% of traditional companies set aside money for SaaS, compared to 44% of businesses actively moving toward digital transformation.
SaaS Security and Privacy Statistics
Nearly every SaaS platform handles sensitive data, which puts a target on their back. Bad actors are always looking for gaps to exploit—and in many cases, they find them in places companies didn’t even realize were exposed.
Missteps like misconfigurations or overlooked settings often come down to a lack of know-how or resources. But the damage they cause, especially to a company’s reputation—can be massive.
As the stakes rise, security is no longer just an IT concern. More CFOs are stepping in to help shape stronger privacy and risk strategies.
Here are the important SaaS stats driving how companies approach security today.
60. In 2025, the top three SaaS worries for companies are apps storing sensitive data without approval (34%), important files being shared publicly (34%), and not knowing where all their sensitive data is (31%).
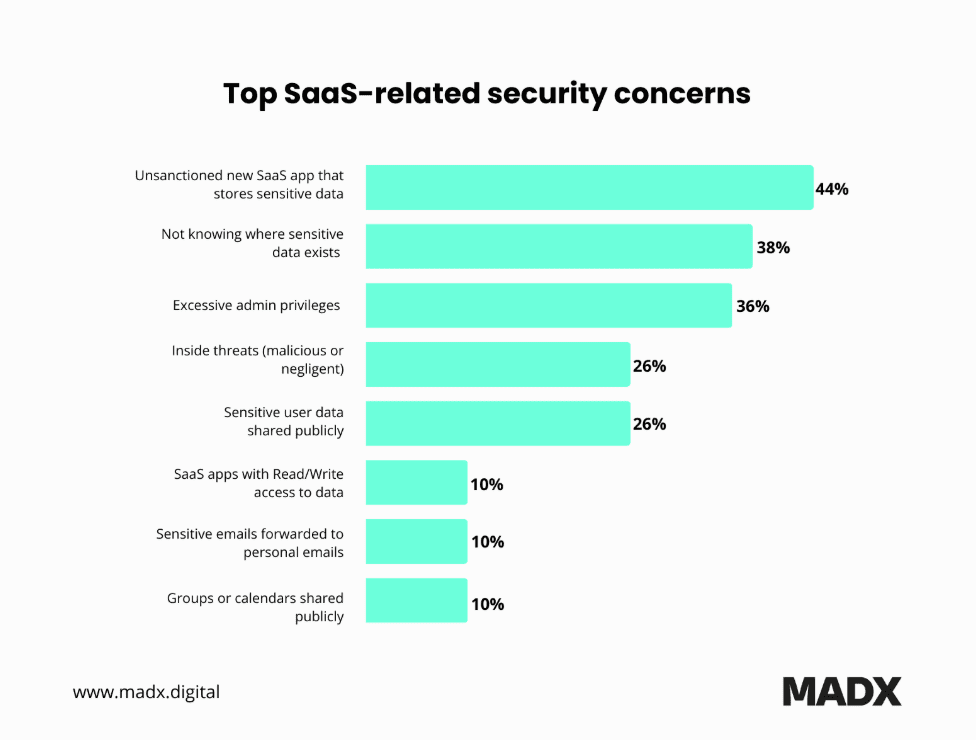
SaaS-related security concerns
61. Insider threats, like ex-employees still having access to company tools, are behind 22% of security breaches, showing how dangerous leftover permissions can be.
62. Nearly half of companies (48%) didn’t realize former employees could still access their systems, making it easy for accidental or intentional breaches to happen.
63. More than half of workers (56%) admitted using software without their IT team’s approval, which creates major risks for security and data leaks.
64. SaaS settings are often tricky to manage, and 46% of companies only review them once a month or less, while 5% never check them.
65. Over half of enterprise software—56%—isn’t being properly managed, meaning no one’s tracking things like who’s using what, when licenses expire, or if tools follow company rules.
66. In most workplaces, about 65% of SaaS apps are unsanctioned, meaning employees started using them without IT knowing or giving the green light.
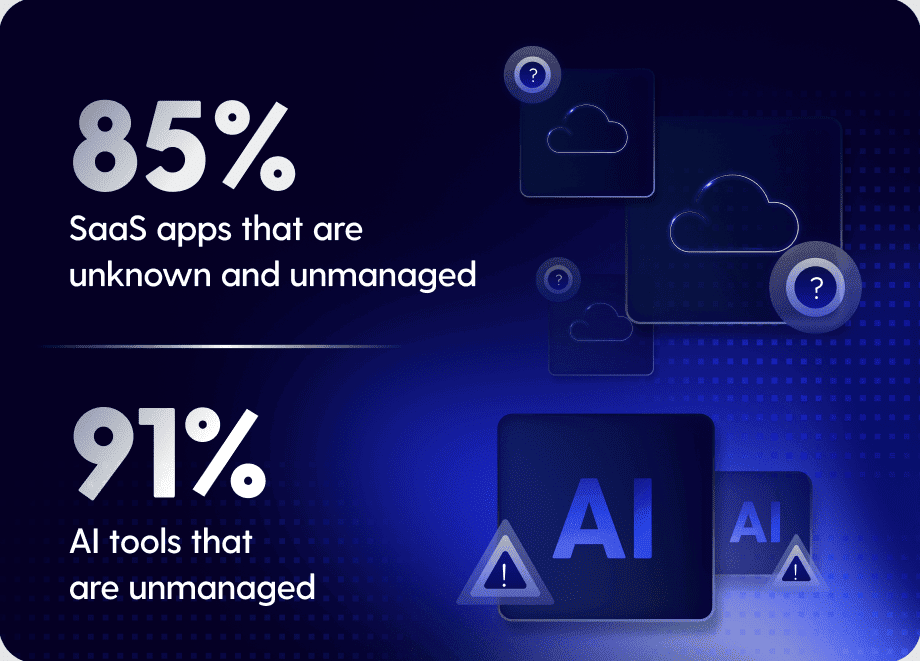
Majority of SaaS apps are unknown and unmanaged
SaaS By Business Function
SaaS isn’t just a tech solution—it’s a tool used by marketing, finance, HR, sales, and more.
This section explores how various departments are integrating SaaS into their workflows to boost productivity and cut down on manual work.
67. FinTech is still the biggest player in SaaS, but AI-powered tools and industry-specific platforms like healthcare and education are growing faster than ever, showing how demand is shifting toward smarter and more focused solutions.
68. In 2025, 41% of companies plan to boost their HR tech spending, while just 7% expect to cut back—highlighting how important digital tools for hiring and managing teams have become.
69. Most companies set aside about 10–15% of their SaaS budget for marketing tools, which help them connect with customers and grow their audience.

SaaS marketing spend benchmarks
70. Sales tools like CRMs lead the way in SaaS, with over 90% of businesses that have more than 11 employees using one to manage leads and boost sales.
71. Businesses use an average of 46 IT-related SaaS apps, including ones for DevOps, security, and managing infrastructure, which are essential for keeping systems running smoothly.
72. On average, SaaS companies spend around 10.5% of their budget on sales and 8% on marketing, based on a survey of 1,500 companies.

Median ARR spend by department
73. Customer support and success teams, which help keep users happy and loyal, receive about 10% of a company’s annual revenue, showing how much value they bring.
74. SaaS companies backed by investors spend nearly twice as much on sales and over 50% more on marketing compared to those that grow without outside funding, aiming to scale faster and grab market share.
Challenges Faced by SaaS Companies
SaaS businesses constantly navigate a range of challenges, many of which evolve quickly—like the unpredictable flow of venture capital.
Beyond funding, issues such as maintaining user security, managing an ever-changing workforce, and planning for steady revenue are ongoing struggles in the industry.
The SaaS stats below reveal the top struggles SaaS companies face in today’s fast-moving market.
75. IT teams now spend a quarter of their time managing outside vendors and tools, and nearly a third of their time is tied up in security and compliance, showing just how complex and demanding SaaS management has become.
76. Gartner warns that companies without a centralized system for managing their SaaS tools are 5x more likely to face data loss or security issues from misconfigurations, highlighting the risks of a scattered approach.
77. Security, compliance, lack of training, privacy concerns, vendor lock-in, and cost are the top challenges businesses face when using public cloud services, with security alone worrying 66% of companies.
78. Venture capital interest in SaaS is booming, with investments in startups jumping to 47%, making the space more competitive than ever for new players trying to stand out.
79. Almost 60% of SaaS vendors admit to hiding price increases to stay competitive, which can erode customer trust and make it harder to keep users long-term.
80. Over 60% of expensed software is rated poorly on security, creating major compliance headaches for companies trying to stay on top of their risk exposure.
81. More than half (53%) of SaaS companies struggle to find qualified people for key data science and engineering roles, slowing down innovation and growth in the sector.
82. The average employee switches between about 13 SaaS tools every workday, showing how digital overload and app fatigue can impact productivity and focus.
83. Roughly 40% of employees who could work remotely have moved away from full-time office work, which makes it harder for teams to maintain strong collaboration and company culture.
Conclusion
The SaaS statistics above make it clear that the industry continues to expand quickly and shows no signs of slowing down.
As more companies rely on digital tools and cloud-based platforms, SaaS providers are in a strong position to lead this shift.
But with that growth comes greater competition, making it more important than ever for companies to stay agile and forward-thinking.
Customer experience remains a top priority. To thrive, SaaS companies must deliver reliable, user-friendly solutions that solve real problems.
Loyal users not only stick around—they help fuel growth through word of mouth. In short, SaaS is a dynamic space full of opportunity for those ready to evolve and meet the changing needs of today’s market.