Did you know that in 2025, global eCommerce sales will reach $6.86 trillion? This massive number shows just how essential online shopping has become for businesses everywhere.
eCommerce isn’t just a sales channel—it’s a game-changer that’s reshaping the entire way companies run and market their products.
In this article, we’re going to dive into the latest eCommerce stats. We’ll break down the current trends and shifts in online shopping, giving you the insights you need to stay informed and ahead of the competition.


What is Ecommerce?
eCommerce is basically buying and selling goods and services online. It lets businesses reach customers without needing a physical store.
Everything happens on the Internet, which makes it super easy for both businesses and shoppers to connect and get things done.
Now let’s understand this with the help of an example.
Imagine a local bakery that wants to share its delicious cakes with people beyond its town. They set up a website where you can check out all their cake options, place an order, and pick delivery options.
Now someone from another city can pop onto the bakery’s site, order a cake for a special occasion, and have it delivered right to their door.
This way, the bakery can attract new customers and boost sales without having to open new locations.
General Ecommerce Statistics
In this overview, we’ll check out some important eCommerce stats, like how online shopping is expected to grow and what’s happening with retail sales.
We’ll also look at how many people are shopping online, how many online stores are out there, and which products are flying off the virtual shelves.
These insights are handy for any online retailer—no matter where they are.
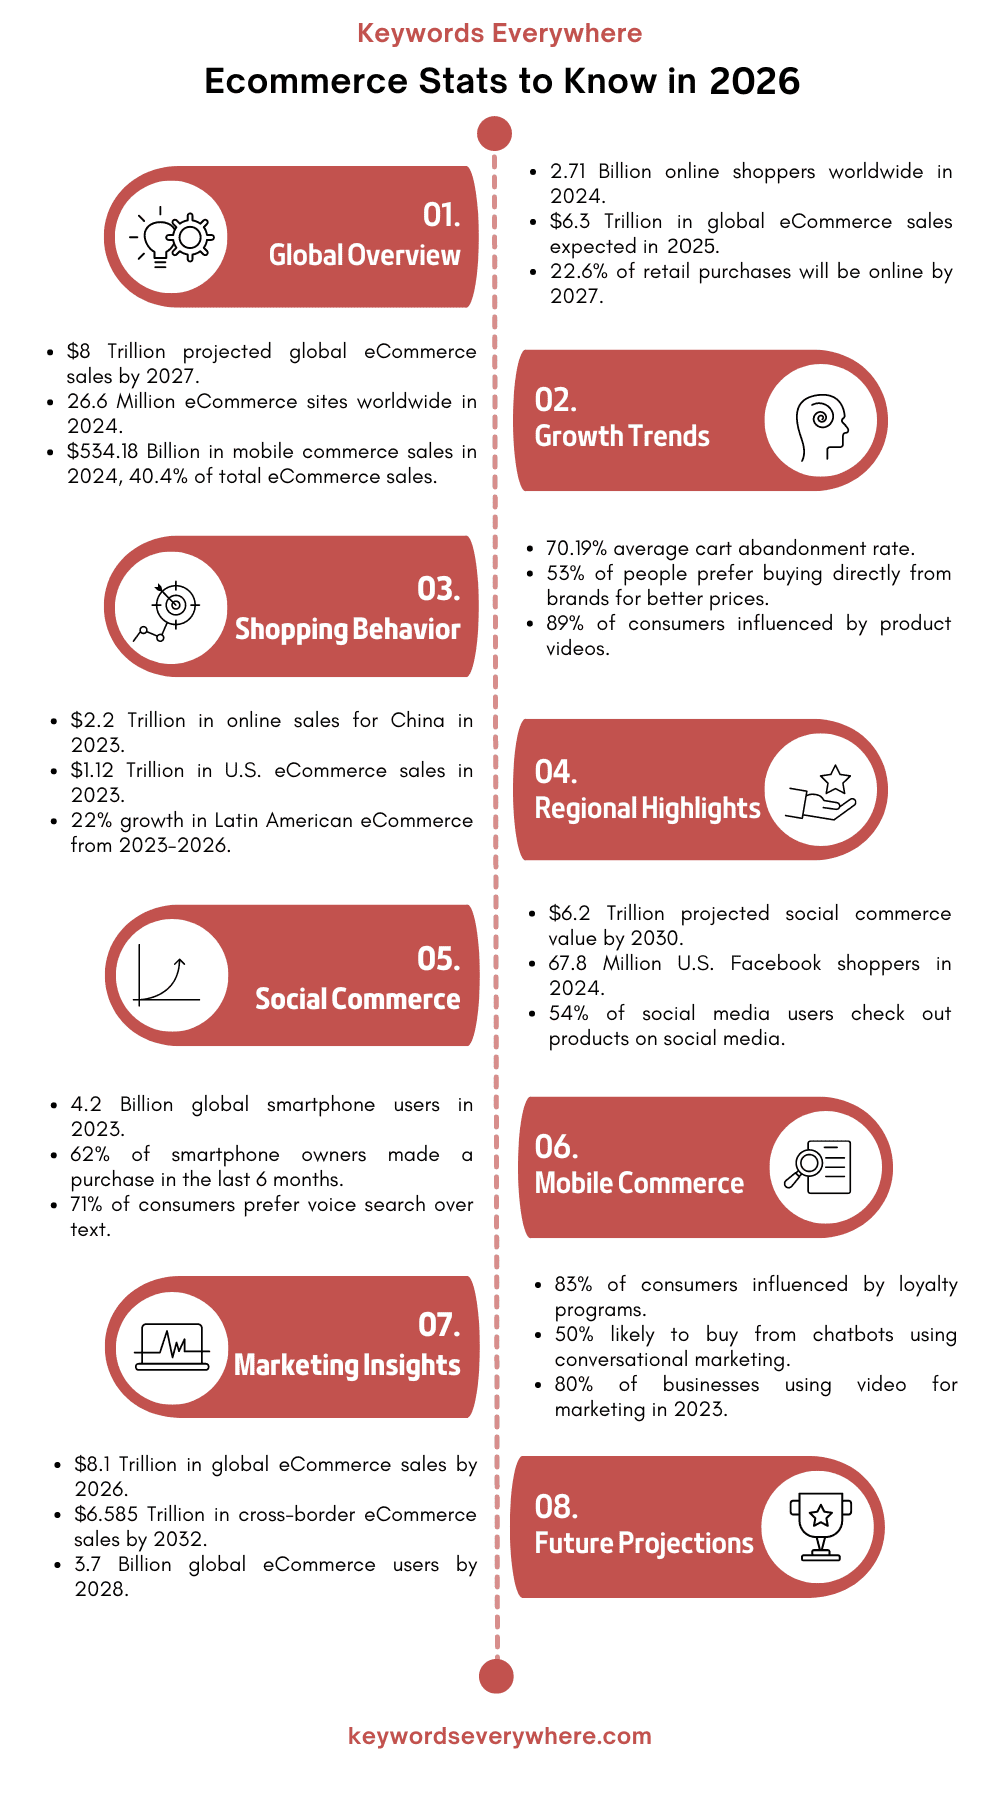
1. As of 2024, there are 2.71 billion online shoppers around the world. That’s about 33% of the global population shopping online, showing a 2.7% increase from last year.
2. China is leading the way with 915.1 million online shoppers, while the US has 270.11 million online buyers in 2024.
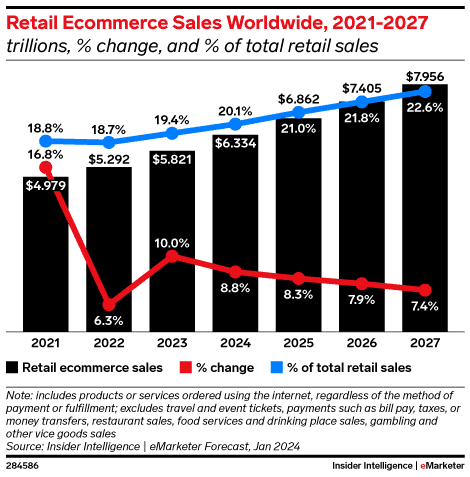
3. By 2027, it’s expected that 22.6% of all retail purchases will be made online—with the share of online retail growing by an average of 0.32% each year since 2021.
4. Global eCommerce sales are set to hit $6.8 trillion in 2025, an 8.37% jump from 2024. Sales are projected to keep growing at a rate of 7.8% annually, reaching $8 trillion by 2027.
Source
5. There are 26.6 million eCommerce sites worldwide in 2024, marking a 3.83% increase from last year. That means about 2,685 new eCommerce websites started each day between 2023 and 2024. The United States hosts almost 50% of all these sites.
6. Consumer electronics are expected to generate $922.5 billion in sales this year. Fashion is close behind, with an estimated $760 billion, and the food and beverages sector will see a massive $708.8 billion in spending.
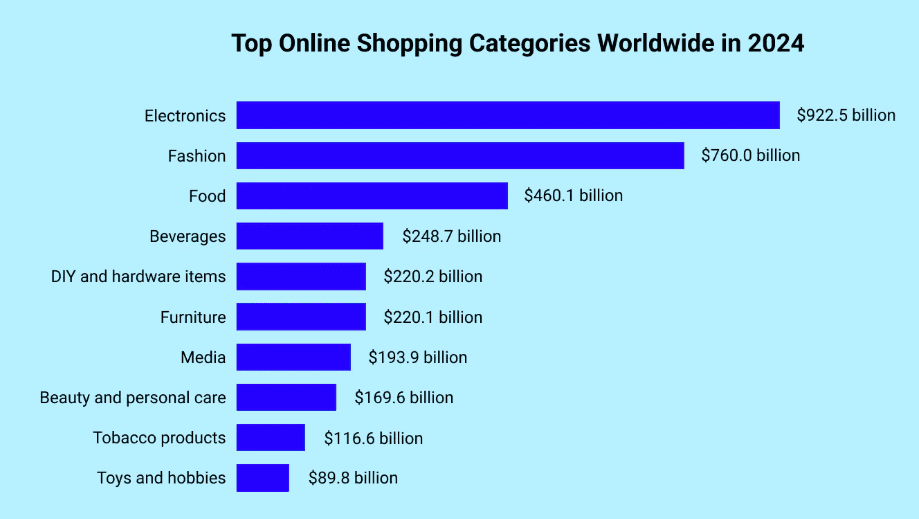
Source
7. In the United States, eCommerce sales have been steadily rising for over a decade, reaching a record high of $1.12 trillion in 2023. This is a 330% increase from $260.4 billion in 2013.
8. Experts predict sales will hit $1.26 trillion in 2024 and $1.72 trillion by 2027. By then, online sales will account for about 22.6% of total US retail sales.
9. When it comes to starting their shopping journey, 44% of shoppers use search engines, 41% go directly to online stores like Amazon or a business’s website, and 14% prefer starting on social media.
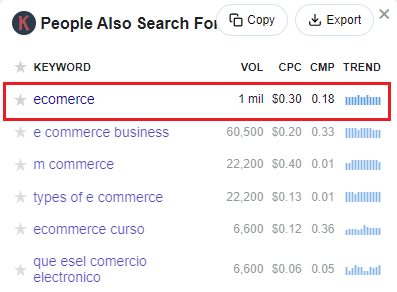
10. According to Keywords Everywhere, the search term “eCommerce” has more than one million searches, showing that more people are interested in learning about it and starting their online businesses.
Global Ecommerce Statistics
With so many people shopping online these days, the eCommerce world is evolving fast.
Knowing the latest trends and eCommerce stats can really help businesses make smart moves and grow in the global market.
So let’s take a look at the numbers that break down online shopping trends, focusing on data from different countries and regions.
11. The global eCommerce market is about to reach $6.8 trillion in 2025, and it’s expected to keep growing in the coming years. This shows that selling online across borders is becoming a smart move for many retailers.
12. China is still the big player in eCommerce, making up over 33% of global retail sales and expected to hit $2.2 trillion in online sales. Plus, China’s retail scene saw a 6.8% boost in the third quarter of 2023.
13. After China and the US, the UK is now the third-largest eCommerce market, with over $195 billion in sales in 2023. Japan and South Korea are next, bringing in $193 billion and $147 billion, respectively.
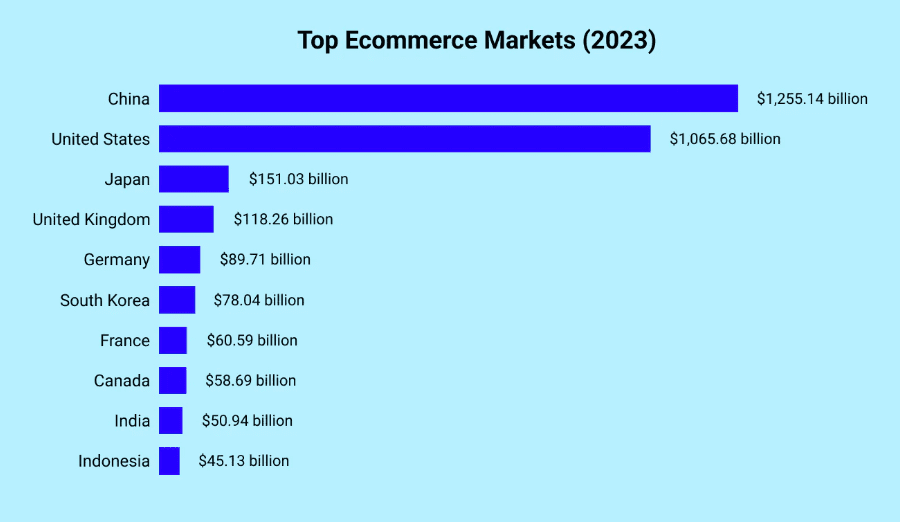
Source
14. In Latin America, which includes Peru, Argentina, Brazil, Chile, Colombia, and Mexico, eCommerce is set to grow by 22% from 2023 to 2026—reaching over $700 billion in total sales.
15. A recent survey found that around 42% of Americans plan to spend more online in the next year, according to Retail Dive.
16. According to Precedence Research, the global B2C eCommerce market is projected to exceed $7.45 trillion by 2030. It is growing at a steady 7.6% per year from 2022 to 2030.
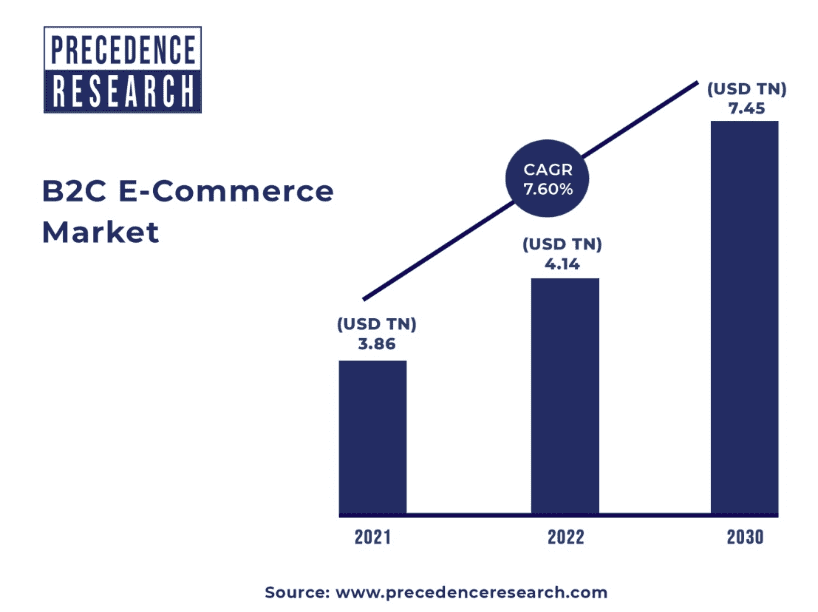
Source
Ecommerce Shopping Behaviour Statistics
Understanding online shopping trends and what drives customer behavior can seriously ramp up your sales and build loyalty. It’s essential for any eCommerce game plan, no matter your niche.
So let’s dive into the top eCommerce stats on shopping habits and find out how you can use this info to your advantage.
17. 52% of online shoppers are searching for products from around the globe. It’s all about the ease of international shipping and the convenience of online ordering.
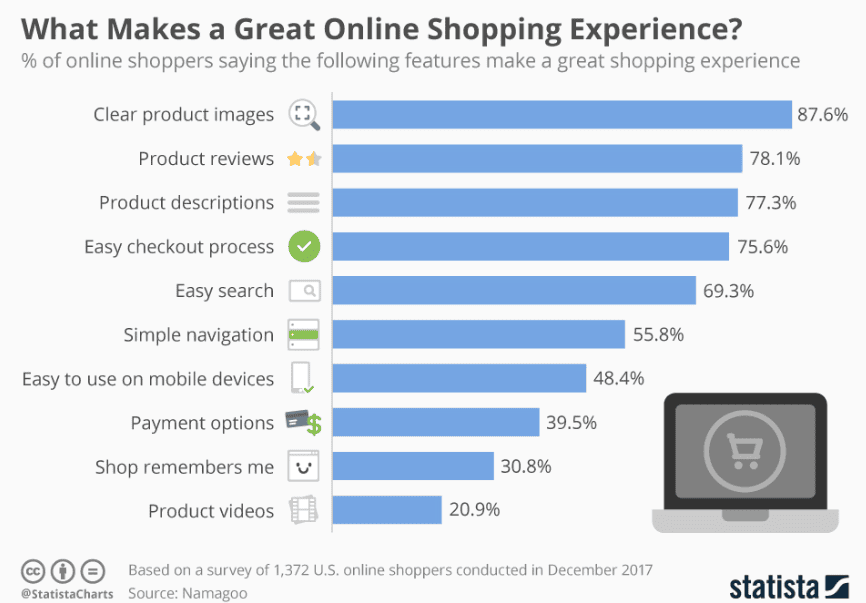
18. 99% of shoppers check reviews before buying, with 96% specifically hunting for negative ones.
19. The average cart abandonment rate is a whopping 70.19%. Mobile users are the biggest culprits with an 86.7% abandonment rate, followed by tablets at 80.7%, and desktops at 69.8%.
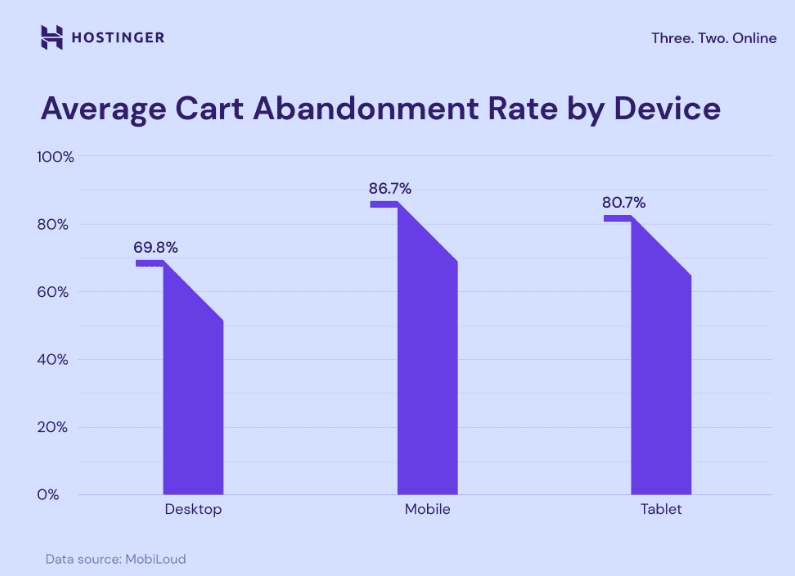
Source
20. 53% of people prefer buying directly from brands online to snag better prices. On the flip side, only 16% find personalized products a strong reason to shop directly from brands.
21. 50.6% of people shop online mainly for the free shipping, while 39.3% are motivated by coupons and discounts.
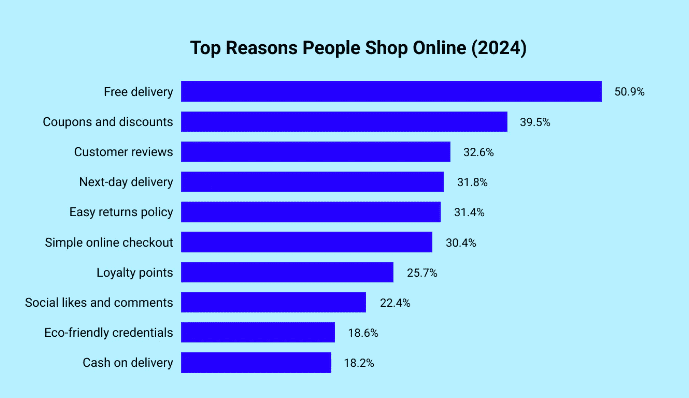
Source
22. More than 75% of consumers have made accidental purchases because online shopping is just so convenient.
23. Research shows that for every second your site loads faster, conversion rates can jump by 17%. So speedy loading times are key to keeping users engaged.
24. 89% of consumers say watching a video swayed their decision to buy a product or service, highlighting the power of multimedia in online shopping.
Source
25. 67% of online shoppers prefer live chat for support over phone, email, or social media. Millennials, in particular, love live chat over all other communication channels.
Mobile Ecommerce Statistics
Mobile commerce is really taking off, letting sellers connect with buyers right through their phones and tablets. If you stay on top of mobile shopping trends, you can boost your brand’s visibility and turn those mobile visits into real sales.
Here are some key mobile eCommerce stats and tips on how to use them to drive more sales and conversions.
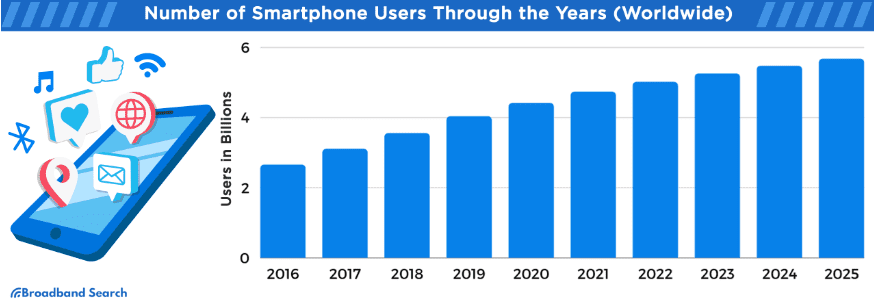
26. By 2023, global smartphone users topped 4.2 billion, up from 3.6 billion the year before. With a growth rate of 30.6%, we might see this number hit 6.3 billion by 2029.
Source
27. Forecasts indicate that mobile commerce sales will reach $4.01 trillion in 2025, making up 59% of all eCommerce sales. Smartphones and tablets are leading the charge in this mobile shopping boom.
28. Mobile commerce is growing at a speedy 29%, outpacing traditional eCommerce by 7%.
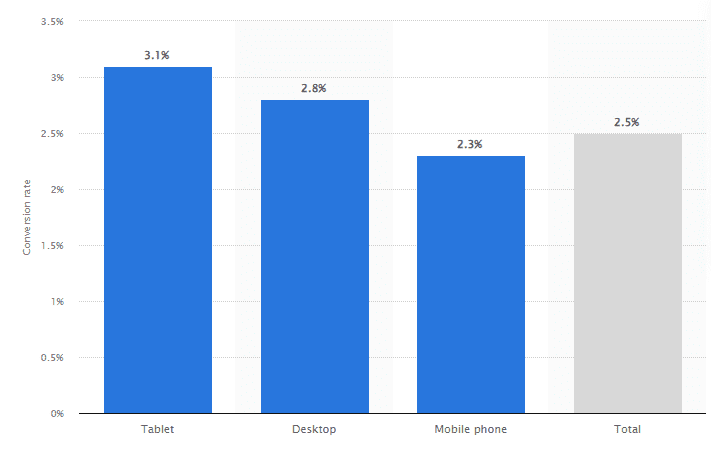
29. Tablets have the highest conversion rate at 3.1%, followed by desktops at 2.8%. Smartphones are close behind with a 2.3% conversion rate, just shy of the overall eCommerce rate of 2.5%.
Source
30. 62% of smartphone owners have made a purchase using their device in the last six months.
31. With 71% of consumers favoring voice search over text—eCommerce businesses should tweak their sites for voice-based shopping.
32. 50% of smartphone users prefer visiting a brand’s mobile site over downloading an app.
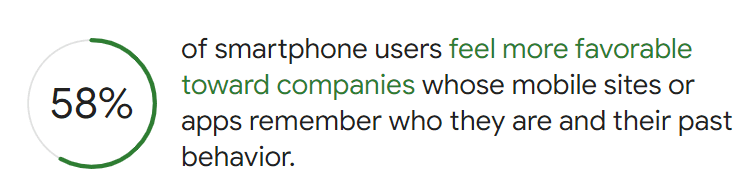
33. 58% of smartphone users like it when companies’ mobile sites or apps remember who they are and their past behavior.
Source
Social Commerce Statistics
Social commerce is all about selling products and services directly through social media. It combines eCommerce and social media, making it easier for you to boost sales and stay in touch with your followers.
Customers can discover products, make purchases, and complete the whole shopping process right on social media platforms. For businesses, this means more exposure and a new, easy way for customers to shop.
Here are some latest social commerce stats you need to know:
34. By 2030, social commerce is expected to hit a whopping $6.2 trillion! It’s currently growing at a rate of 31%, but that’s set to climb even higher to 35.3% by 2026.
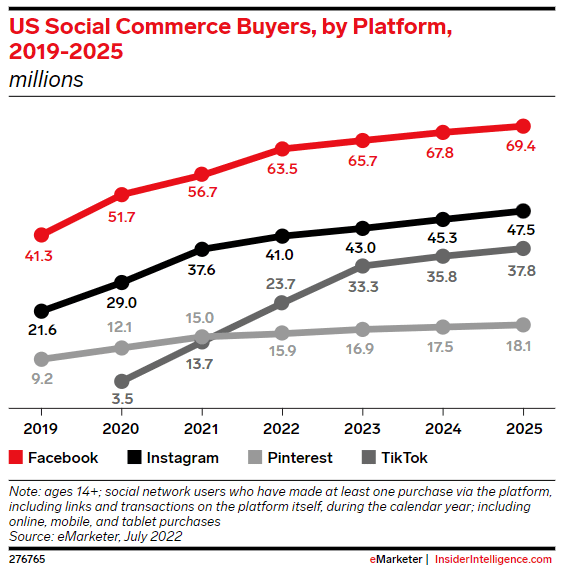
35. In 2024, about 67.8 million people in the U.S. will shop on Facebook, making it the top platform for social commerce. That’s 20% of the country’s population. Instagram is also a big player with 45.3 million expected shoppers, and TikTok isn’t far behind with 35.8 million shoppers.
Source
36. Over half (54%) of social media users check out products on social media, and 71% are more likely to buy based on social media recommendations.
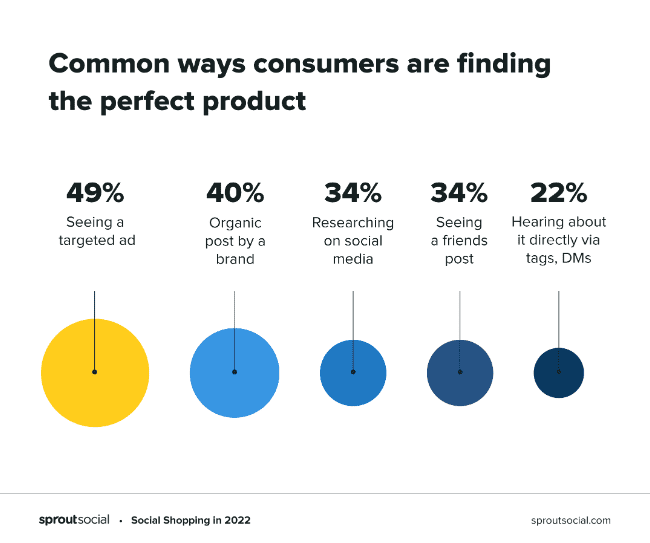
37. Nearly 30% of consumers prefer discovering new products through social media over any other method.
38. The average person now uses seven different social networks each month, spending a record 151 minutes a day on social media.
39. About 29% of social media users are likely to make a purchase on the same day they use social media.
40. Friend’s posts on social media influence 81% of consumers’ buying decisions, while 78% are swayed by brand posts.
Source
41. Influencer recommendations on social media help 49% of consumers decide what to buy, and about 80% of people have bought something after seeing it recommended by an influencer.
42. People who have bought something through social commerce are twice as likely to try a new brand compared to those who haven’t.
43. Social media is preferred for finding new products by 54% of Gen Z and 58% of Millennials, compared to online searches.
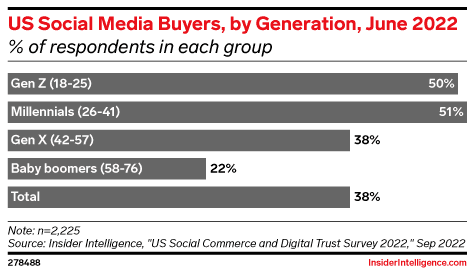
44. Around half of the U.S. Gen Z and Millennial social media users make purchases on the social platforms, while only 38% of all U.S. adults do. Boomers are the least likely to shop this way.
Source
Ecommerce Platform Statistics
If you’re thinking about starting your own eCommerce business, you might be curious about which platform is the most popular. Check out these key stats on the top eCommerce platforms:
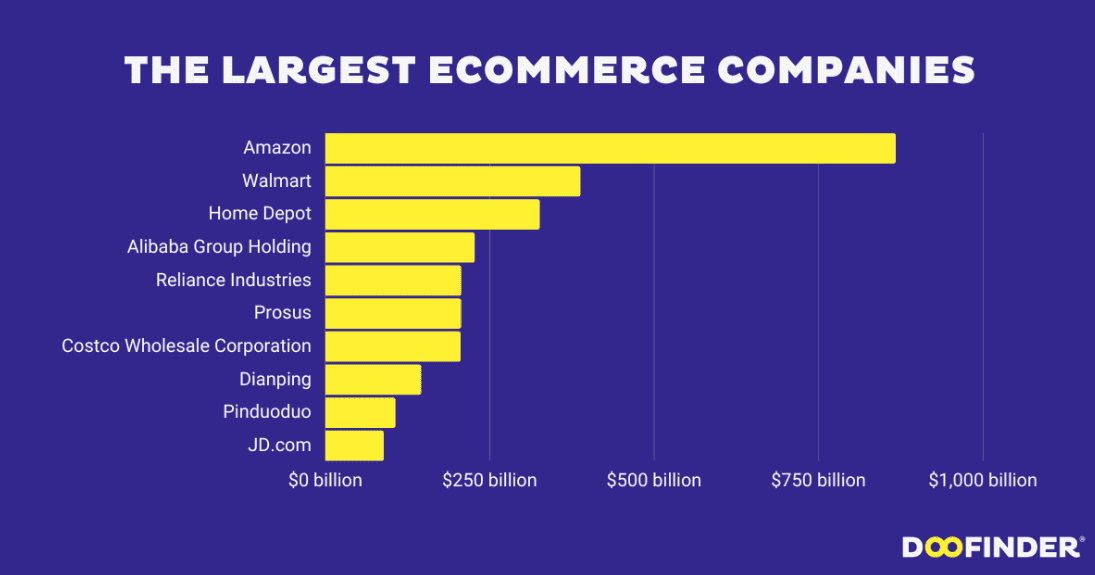
45. Amazon.com is a major player in the eCommerce world—offering everything from online shopping and computing services to electronics and groceries. Its market value is a staggering $867.58 billion.
46. Walmart had global sales of nearly $568 billion in 2022, making it the top retailer by revenue. Its profit margin has stayed steady at about 24-25% in recent years.
47. Home Depot ranks as the third largest eCommerce company worldwide—with current revenue of $151.83 billion according to their latest reports.
Source
48. Alibaba is the fourth-largest eCommerce giant. As of July 2024, its market value was $182.09 billion, making it the 69th most valuable company globally.
49. The top 10 eCommerce companies together pulled in an impressive $3.5 trillion in online sales in 2022, capturing 61% of the global market. Alibaba led the pack with a 23% share.
Ecommerce Marketing Statistics
Creating effective marketing campaigns is key to staying competitive in the eCommerce world.
It’s important to keep up with the latest digital marketing trends so you can make smart choices for your ads, strategies, and driving impactful conversions.
Here are some crucial eCommerce stats to help you design marketing campaigns that really work.
50. 78% of marketers say their customer engagement depends on data-driven methods.
51. 83% of consumers are influenced to buy again because of loyalty programs. Plus 33% of businesses without a loyalty program now plan to start one by 2027.
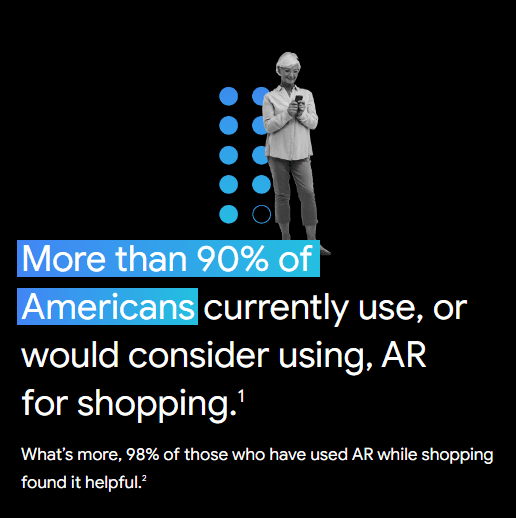
52. Over 90% of Americans either use or are open to using Augmented Reality for shopping.
53. 40% of buyers are willing to pay more for a product if they can first try it out with AR.
Source
54. eCommerce businesses saw an 80% boost in lead generation and a 45% increase in return on investment (ROI) by using eCommerce automation.
55. 50% of people are likely to buy from a website’s chatbot if it uses conversational marketing.
56. In 2023, an impressive 91% of businesses used video for marketing, up 5% from the year before, and saw a good return on investment. 68% of those who haven’t used video plan to start in 2024.
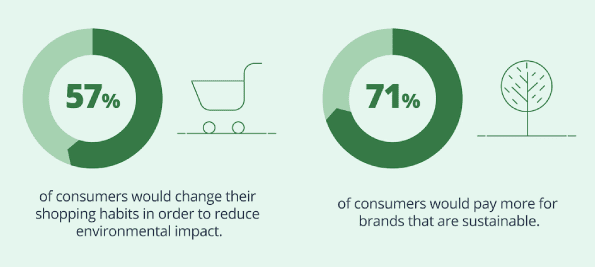
57. Brands that make over half their sales from products with ESG-related claims see 32% to 34% repeat purchases.
58. According to a PRN survey, 80% of consumers trust companies more when they back up their sustainability claims with publicly available data.
Source
59. The subscription eCommerce sector is expected to skyrocket past $450 billion by 2025, a huge jump from $15 billion in 2019. Subscriptions offer a win-win for both shoppers and businesses—giving customers what they want and providing companies with a steady income.
60. According to Keywords Everywhere, the keyword “eCommerce marketing” has had steady interest over the past year, showing that people are consistently looking for information and strategies in this area.
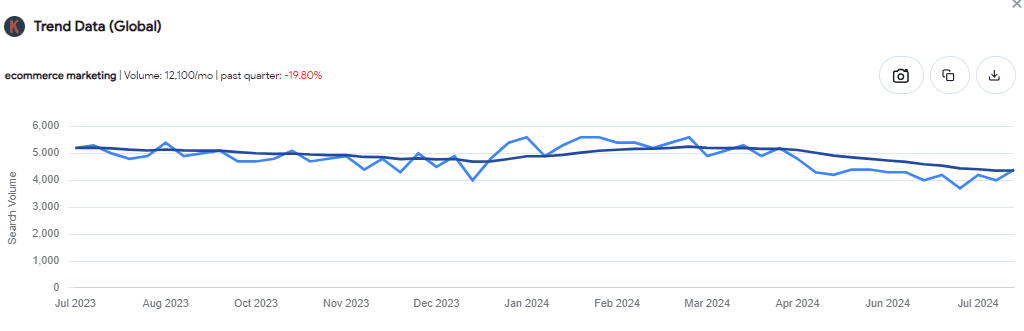
Ecommerce Growth Projections
The eCommerce sector has grown incredibly over the past decade, and it’s expected to keep expanding, dramatically changing the retail world.
Staying updated on this growth helps businesses make smart decisions and plan their strategies.
Check out these key stats to get a better grasp of how eCommerce is growing:
61. Global eCommerce sales are set to hit $8.1 trillion by 2026.
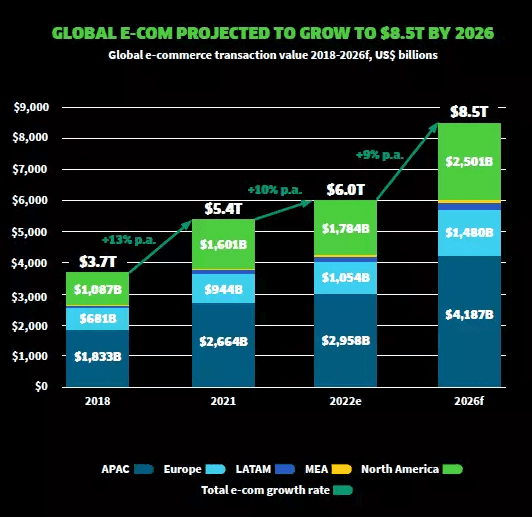
Source
62. Mobile shopping is really taking off. By 2024, mCommerce sales are expected to hit $534.18 billion—making up 40.4% of all online sales.
63. In the U.S., B2B eCommerce sales are projected to grow from $1.676 trillion in 2022 to $2.472 trillion by 2026.
64. By 2028, there will be about 3.7 billion eCommerce users globally. The number of users is expected to rise from 43.1% in 2023 to 52.5% by 2028, with each user generating an average revenue of $1,170.
65. Cross-border eCommerce is booming too. Sales are predicted to jump from $750.1 billion in 2022 to $6.585 trillion by 2032.
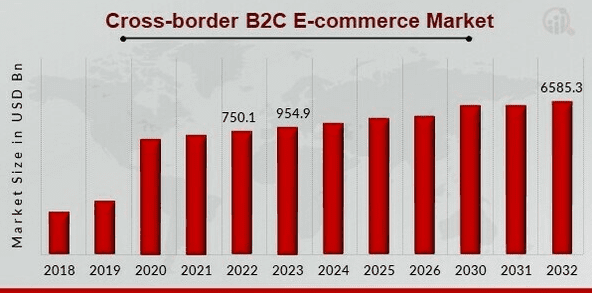
Source
66. Shoppers will increasingly use AI assistants like Alexa, Google Assistant, and Siri to find and choose products online.
67. Most consumers (59%) are actually excited about personalized shopping, where retailers use their preferences and past shopping history to make the shopping experience more tailored to them.
Conclusion
eCommerce is definitely here to stay and it’s only going to keep growing in the coming years.
With more people getting smartphones and better internet access, plus supply chains getting smoother, online shopping is becoming the go-to way to buy things worldwide.
This industry isn’t just a passing fad—it’s a huge and exciting area full of opportunities. Use our eCommerce stats to plan smarter and stay ahead of the competition. This way, you’ll be set to thrive in this fast-changing market.