Blockchain has transformed from a strange and confusing idea into one of the most powerful forces shaping industries around the world, and in 2025, its influence is bigger than ever as businesses, governments, and individuals find new ways to use it in everyday life.
Recent reports show that more than 80 million people actively use blockchain wallets worldwide.
So today, we’re sharing the important blockchain stats to help you understand the real numbers behind blockchain’s growth, adoption, and future potential.


Top Blockchain Stats
From the billions of dollars being invested in blockchain solutions to the rapid increase in global adoption, these key stats offer a snapshot of the transformative power of blockchain and give us a glimpse into its potential to reshape industries and economies.
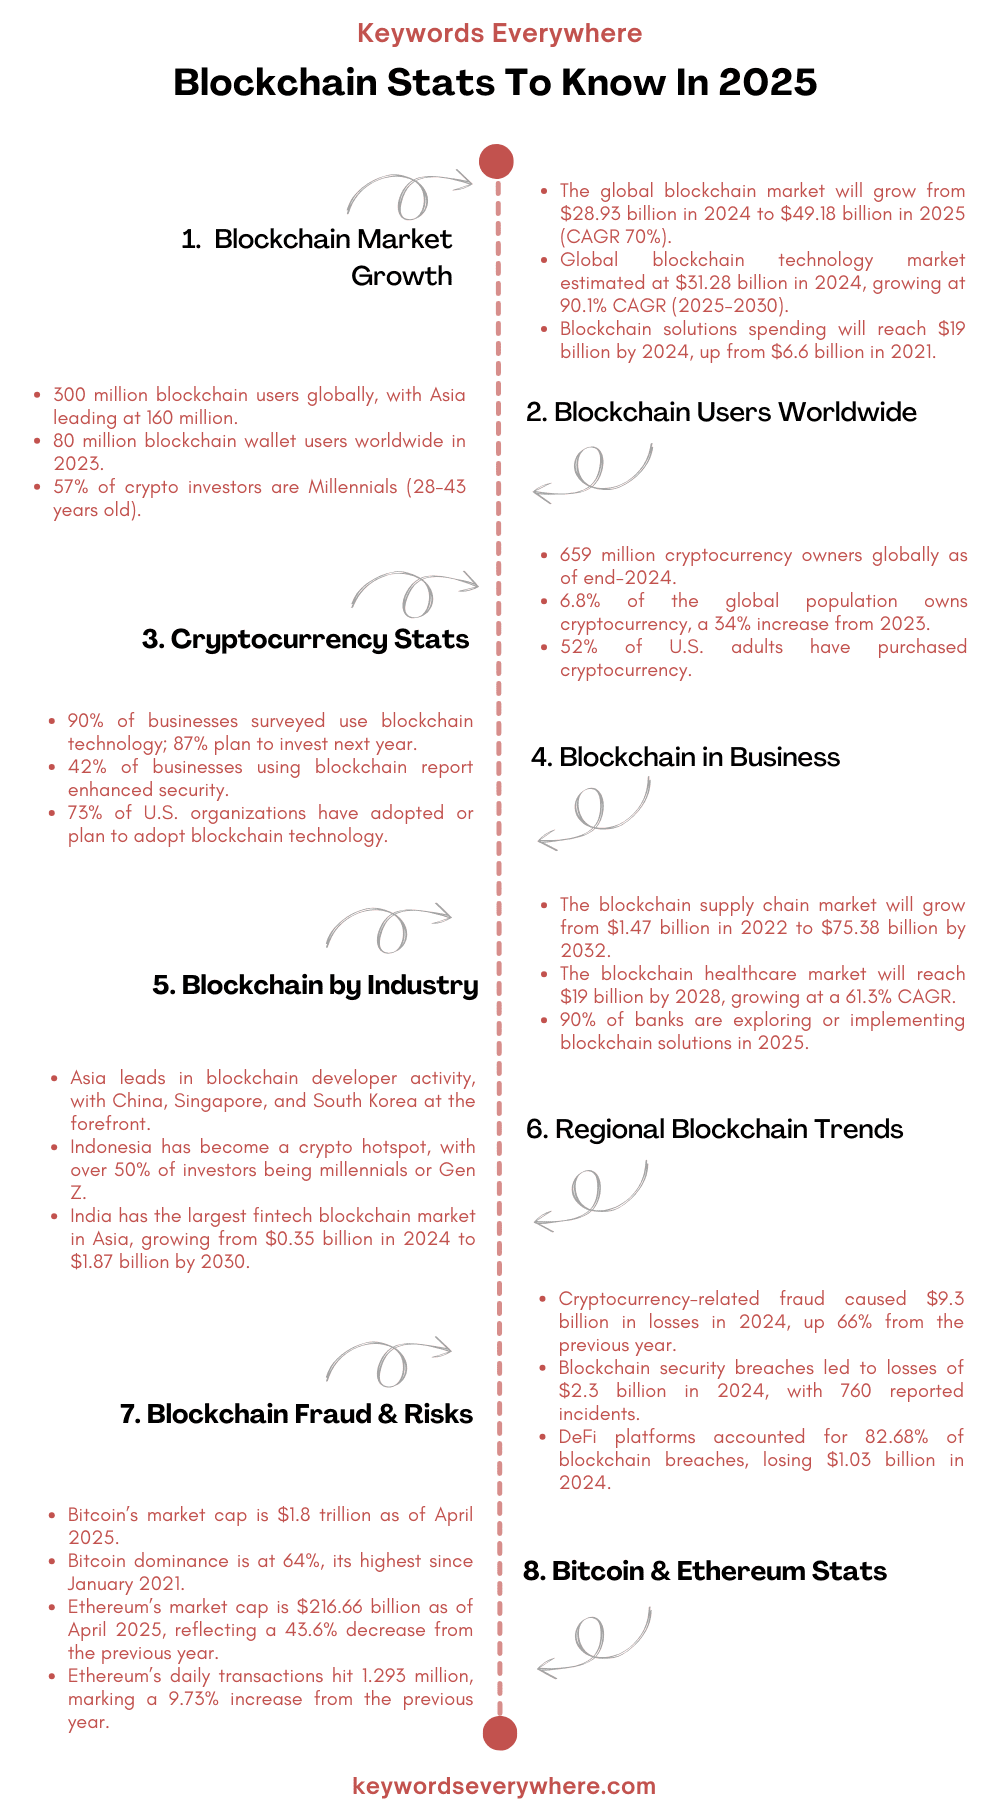
1. The global blockchain market will grow from $28.93 billion in 2024 to $49.18 billion in 2025, highlighting a compound annual growth rate of 70%.
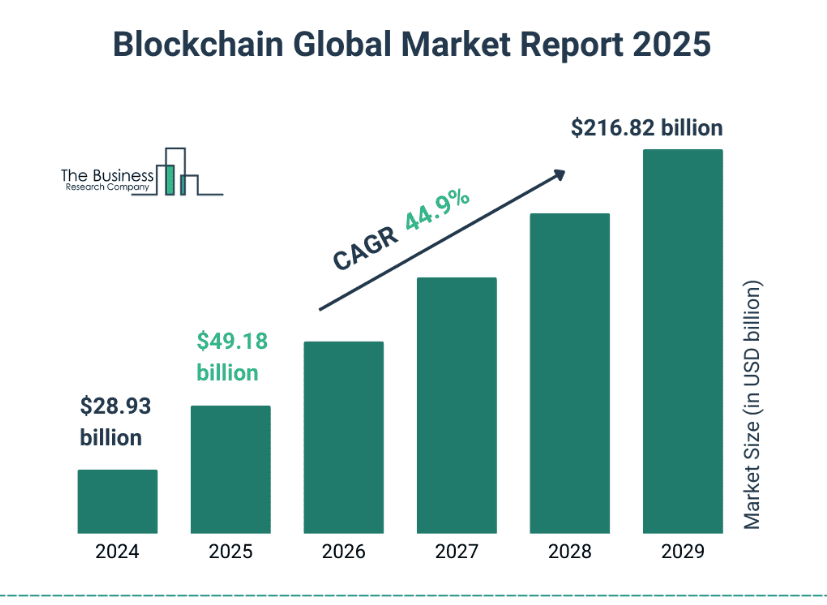
Blockchain global market size 2025
2. As of 2025, there are over 300 million blockchain users globally, with Asia leading at 160 million users, followed by Europe (38 million), Africa (32 million), North America (28 million), South America (24 million), and Oceania (1 million).
3. There are nearly 20,000 cryptocurrencies in existence, with approximately 10,025 currently active.
4. Worldwide spending on blockchain solutions is anticipated to reach $19 billion by 2024, which is up from $6.6 billion in 2021.
5. The global blockchain technology market size was estimated at $31.28 billion in 2024 and is forecasted to grow at a CAGR of 90.1% from 2025 to 2030.
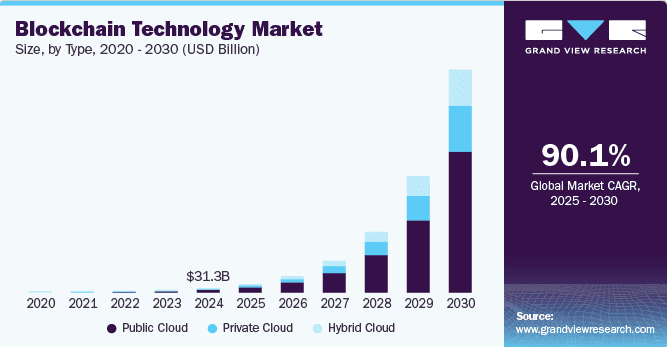
Blockchain technology market 2020-2030
6. Nearly 90% of businesses surveyed reported deploying blockchain technology in some capacity, and 87% say they plan to invest next year.
7. 60% of blockchain developers use JavaScript, with over 18,000 JavaScript blockchain repositories on GitHub.
8. Blockchain is expected to increase global GDP by $1.76 trillion by 2030, accounting for 1.4% of the worldwide GDP.
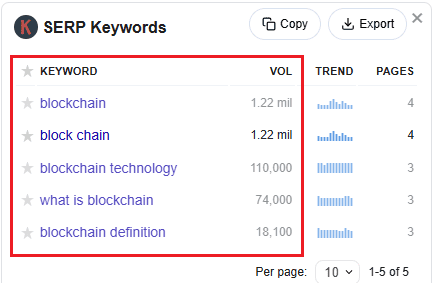
9. According to Keywords Everywhere, “blockchain” receives around 1.2 million searches on Google monthly. This shows the growing interest of individuals and companies in exploring this technology.
Blockchain User Statistics
Blockchain has quickly moved from being a niche technology used by a handful of tech enthusiasts to something millions of people around the world rely on for daily activities like payments, investing, and even gaming.
Here are some top blockchain stats to help you know who these users are and how quickly their numbers are growing:
10. Over 300 million people worldwide use blockchain technology, representing approximately 3.9% of the global population.
11. Cryptocurrency ownership reached 659 million individuals globally by the end of 2024, marking a 13% increase from 583 million in January 2024.
12. Approximately 61% of cryptocurrency owners are male, while 39% are female.
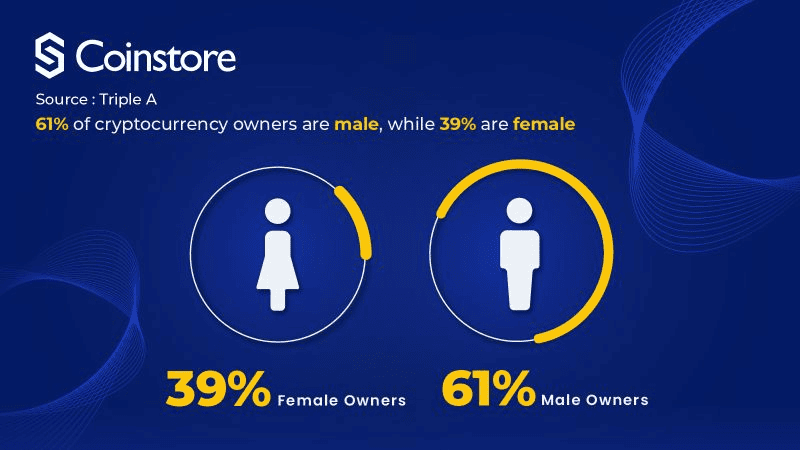
Cryptocurrency ownership by gender
13. Monthly active crypto users are estimated between 30 to 60 million, accounting for about 5–10% of total crypto owners.
14. Over 80 million individuals used a blockchain wallet in 2023, indicating the growing adoption of blockchain technology worldwide.
15. In Q2 2024, the number of Web3 users surged by 40%, reaching 10 million daily active wallets, reflecting increased engagement with decentralized applications.
16. In the United States, 16% of men and 7% of women have invested in blockchain technology.
17. If we talk about regional distribution, 160 million blockchain users are in Asia, while Oceania has only 1 million blockchain users.
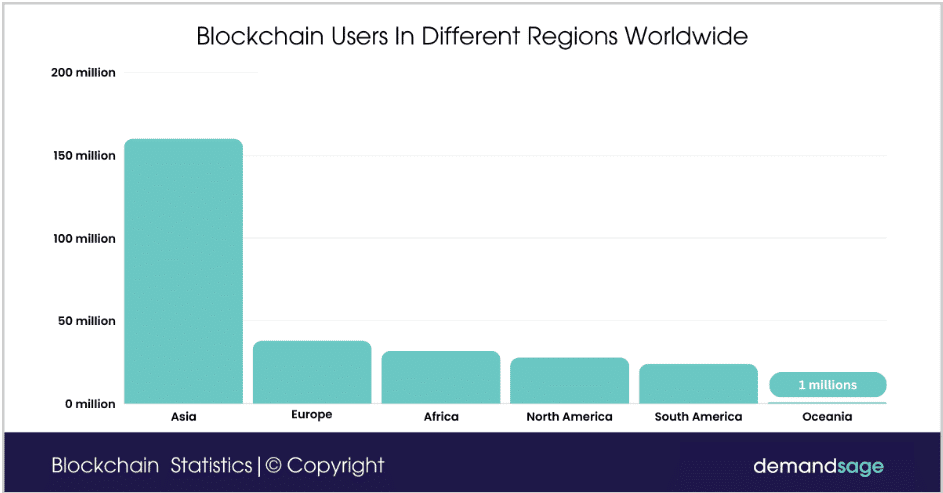
Blockchain users in different regions worldwide
18. 57% of crypto investors are Millennials (ages 28–43), followed by 20% from Generation X (ages 44–59).
19. In the U.S., 15% of individuals aged 18–34 own cryptocurrency, compared to 11% of those aged 35–64 and 4% of those aged 65 and older.
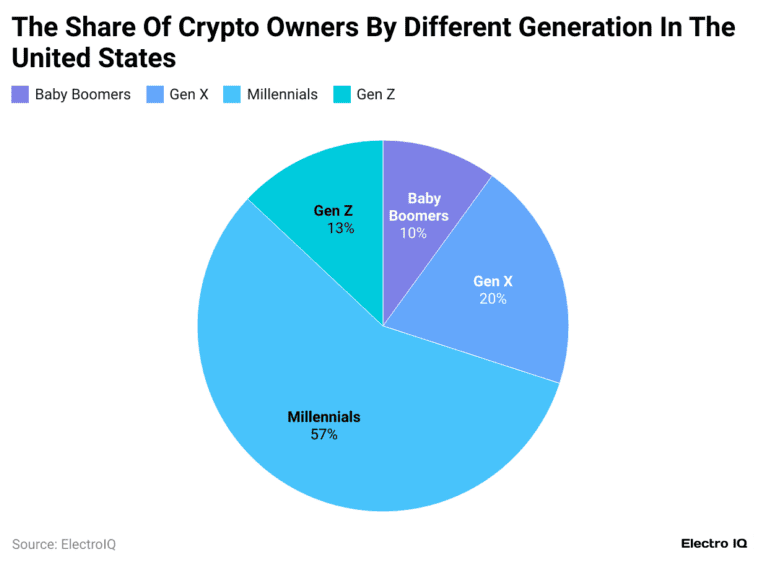
Crypto owners by generation in the United States
20. About 71% of cryptocurrency users have a bachelor’s degree or higher, indicating a well-educated user base.
21. India has become the leader in cryptocurrency adoption for the second consecutive year, reflecting significant engagement with blockchain technology.
Blockchain Market Size and Growth
The blockchain industry has exploded in size over the past few years, turning from a small experimental space into a massive market that’s reshaping finance, technology, and business across the globe.
In 2025, the global blockchain market is valued at over $200 billion.
These blockchain market stats show how fast it has grown — and where it’s headed next.
22. The global blockchain market will grow from USD 28.93 billion in 2024 to USD 49.18 billion in 2025, indicating a CAGR (compound annual growth rate) of 70.0%.
23. The U.S. blockchain technology market was valued at $5.68 billion in 2023 and is expected to grow to approximately USD 619.28 billion by 2034, with a projected CAGR of 53.2% between 2024 and 2034.
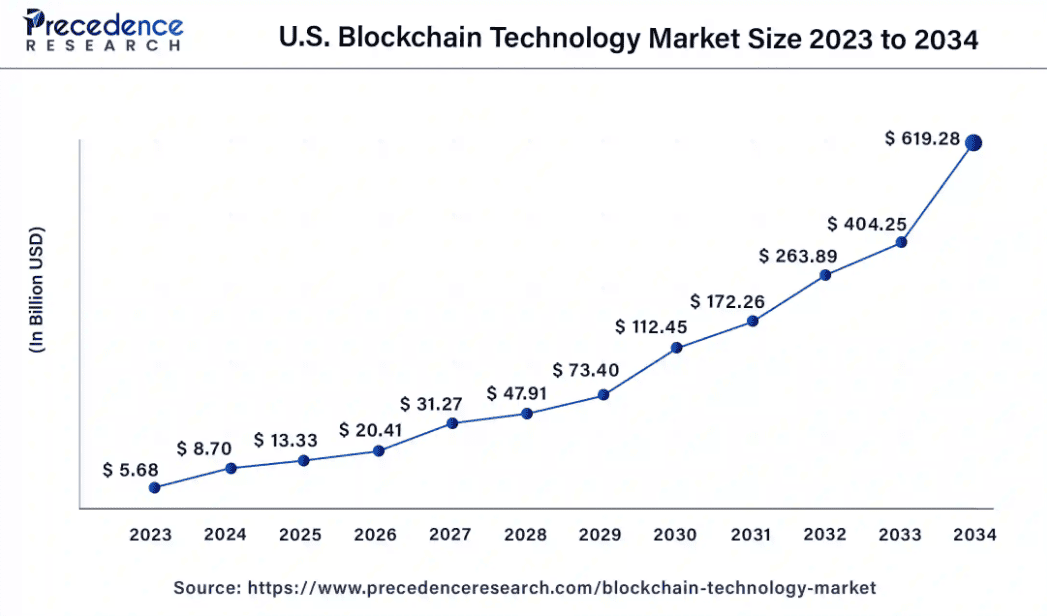
US blockchain technology market size
24. The North American blockchain technology market size reached USD 8.1 billion in 2023, indicating significant adoption in the region.
25. Valued at USD 9.67 billion in 2023, the enterprise blockchain market is expected to reach USD 213.40 billion by 2031, showing a CAGR of 47.36% during the forecast period.
26. The blockchain supply chain market is about to grow from $1.47 billion in 2022 to $75.38 billion by 2032 at a CAGR of 48.25%.
27. The blockchain market within the healthcare sector is about to reach USD 19 billion by the end of 2028, with a CAGR of 61.3%.
Regional Blockchain Trends
While blockchain is growing everywhere, some parts of the world have embraced it much faster and are leading the way with innovation, investment, and real-world adoption across industries.
Here are key blockchain stats showing how different regions are developing their blockchain ecosystems to give you a better understanding of where the biggest opportunities and breakthroughs are happening.
28. Asia has outperformed North America in blockchain developer activity, with countries like China, Singapore, and South Korea leading in both developer engagement and blockchain-related innovations.
29. Singapore has experienced a 250% increase in cryptocurrency adoption since 2023, reaching approximately 1.5 million active users in 2024.
30. Indonesia, one of the fastest-growing crypto markets, leads the region in decentralized exchange (DEX) and decentralized finance (DeFi) activity, with millennials and Gen Z comprising over 50% of its investor base.
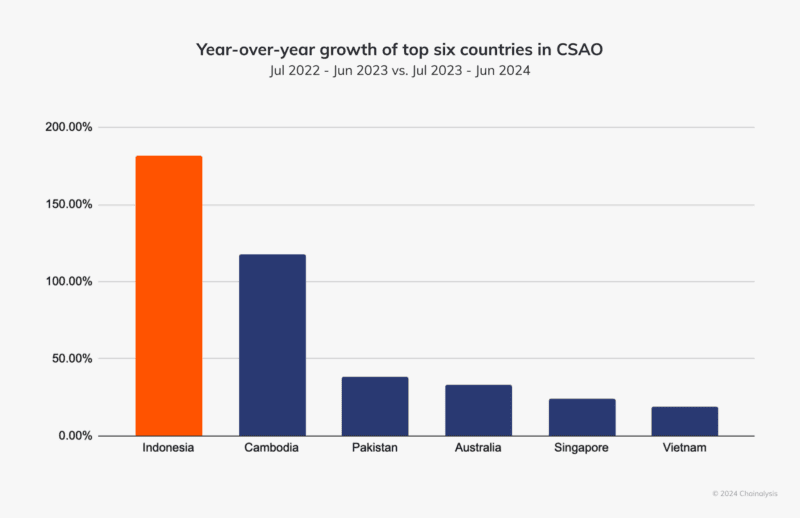
Indonesia as the fastest-growing crypto market
31. India’s fintech blockchain market was valued at USD 0.35 billion in 2024 and will reach USD 1.87 billion by 2030, increasing at a CAGR of 32.10%.
32. North America is anticipated to lead the blockchain tech market in Banking, Financial Services, and Insurance (BFSI) with a 39.7% share in 2024, led by advanced tech infrastructure and major financial players.
33. The UK government is under increasing pressure to deliver clear and robust regulatory frameworks for crypto assets, aiming to position the UK as a global crypto hub.
34. Nigeria leads the Central & Southern Asia and Oceania (CSAO) region in cryptocurrency value received, at approximately $157.1 billion.
35. South Africa ranks second in the CSAO region for crypto adoption, with 66% of respondents reporting crypto wallet ownership in 2024.
36. Seven of the leading 20 countries in the Global Adoption Index are from the CSAO region, including India, Indonesia, Vietnam, the Philippines, Pakistan, Thailand, and Cambodia.
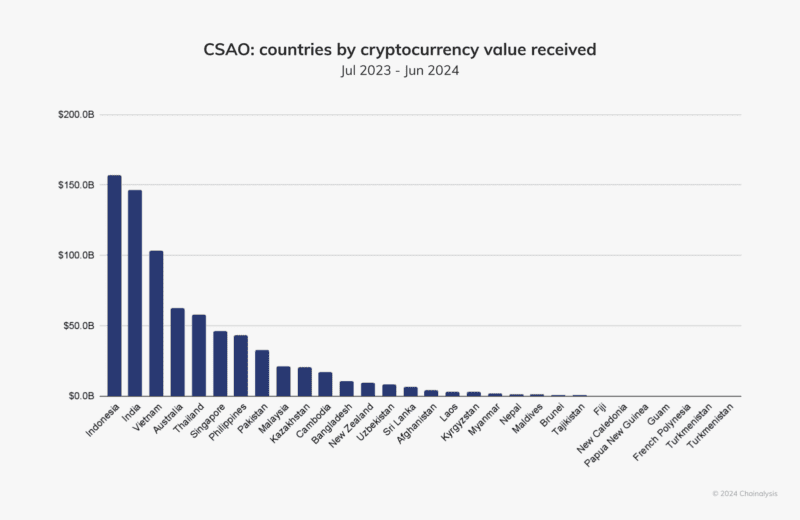
CSAO countries by cryptocurrency value received
37. In 2024, 84% of Nigerians, 66% of South Africans, 60% of Vietnamese, 54% of Filipinos, and 50% of Indians reported owning a crypto wallet.
Blockchain Adoption by Businesses
Businesses that once saw blockchain as a risky experiment are now fully embracing it to solve real problems like tracking supply chains, securing payments, and protecting sensitive data.
These blockchain stats reveal how businesses are putting blockchain to work to show just how mainstream and essential this technology is becoming across every industry.
38. Approximately 90% of businesses surveyed reported deploying blockchain technology in some capacity, and 87% plan to invest further in blockchain initiatives.
39. Nearly 80% of global executives view blockchain as “very important” for their organizations.
40. The global business blockchain adoption rate stands at 10%, with small businesses increasingly integrating blockchain and AI technologies to enhance operations.
41. The financial sector leads in blockchain adoption, with 90% of banks exploring or implementing blockchain solutions as of 2025.
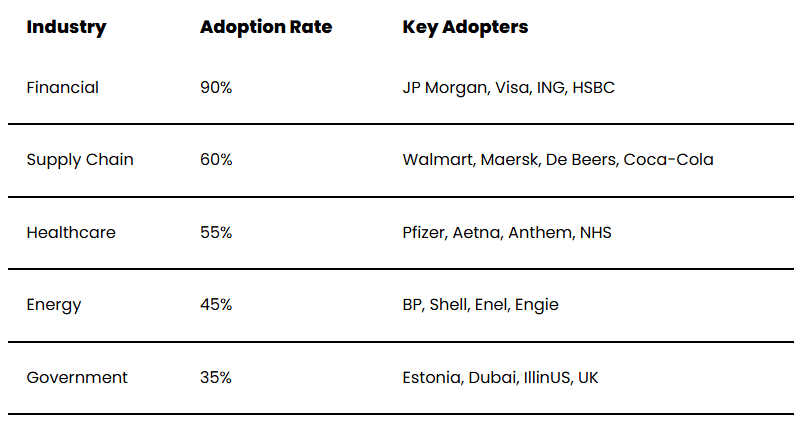
Blockchain adoption rates by industry
42. Blockchain adoption in the gaming industry for managing in-game assets is expected to grow by 45% by 2024.
43. In 2023, 73% of organizations in the United States had adopted or planned to adopt blockchain technology.
44. Data provenance is a top use case for blockchain, and it is expected to contribute billions to the global GDP in the next decade.
45. 42% of businesses utilizing blockchain technology report benefiting from its enhanced security capabilities.
Blockchain Spending and Investment Statistics
The amount of money flowing into blockchain technology is a clear indicator of just how much faith investors, companies, and governments are putting in its future.
These investment trends highlight the growing belief that blockchain will be a cornerstone of the digital economy moving forward.
46. Global investment in blockchain has remained steady since 2017, reaching $0.95 billion and growing to $4.5 billion by 2020.
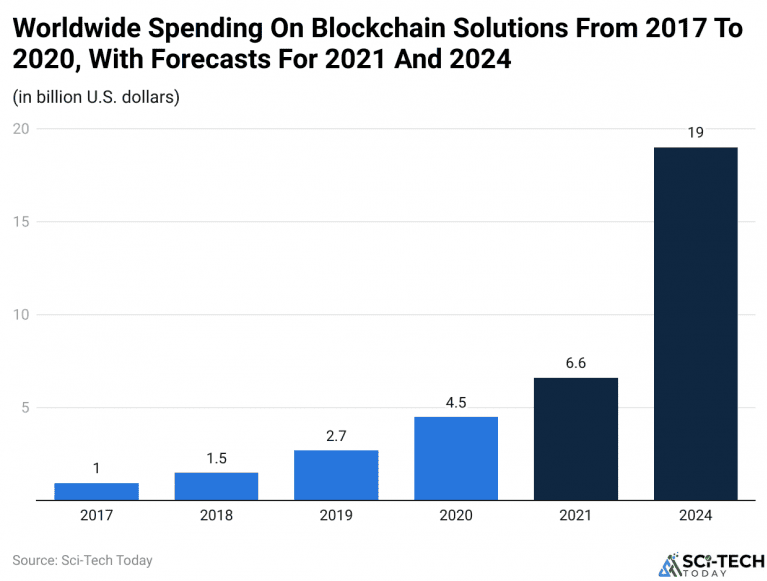
Worldwide spending on blockchain solutions
47. Following the COVID-19 pandemic, blockchain investments surged dramatically, hitting $6.6 billion in 2021.
48. Projections suggest that by 2024, investment in blockchain will climb to $19 billion, which is more than triple the amount invested in 2021.
49. Following the U.S. Securities and Exchange Commission’s approval of crypto ETFs in January 2024, major hedge funds such as Brevan Howard and Galaxy Digital have significantly increased their Bitcoin holdings.
50. Bitcoin’s price increased to an all-time high of $103,649 in December 2024, fueled by increased institutional investment and favorable regulatory developments.
Cryptocurrency Ownership and Usage
Cryptocurrencies like Bitcoin and Ethereum have become more than just digital assets; they’re now part of everyday financial conversations, with millions of people using them for everything from saving and investing to making purchases.
By 2025, nearly 300 million people are expected to own or use cryptocurrency.
Let’s look at the top cryptocurrency stats to know how and why people are adopting these digital currencies:
51. As of 2024, approximately 6.8% of the global population, equating to 562 million people, own some form of cryptocurrency. This marks a 34% increase from 420 million in 2023.
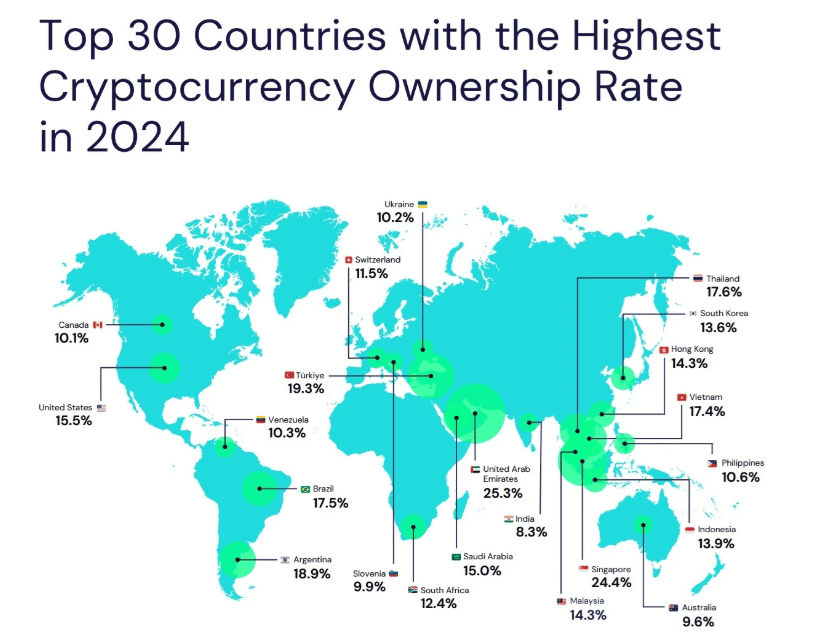
Countries with the highest cryptocurrency ownership rate
52. Over 52% of American adults have purchased cryptocurrency.
53. Stablecoins account for 32% of daily crypto usage, second only to decentralized finance (DeFi) at 34%, highlighting their significance in daily transactions.
54. In 2024, the number of individuals holding over $1 million in crypto assets nearly doubled to 172,300, a 95% increase from the previous year.
55. The count of Bitcoin millionaires more than doubled to 85,400 in 2024.
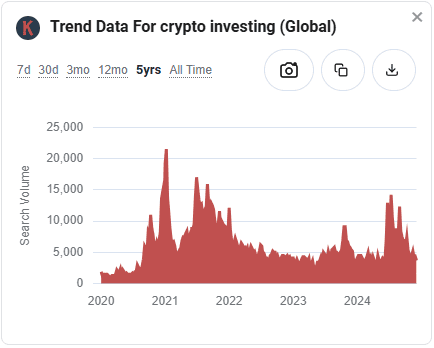
56. According to Keywords Everywhere, the trend data for crypto investing has been unstable during the last five years. It shows sharp rises during major bull markets and steep drops during bearish periods.
Bitcoin-Specific Statistics
Once a niche cryptocurrency, Bitcoin has now evolved into a global financial powerhouse, influencing everything from market trends to national policies.
These bitcoin stats help you understand its current use and adoption so you know how this pioneering cryptocurrency continues to shape the future of digital finance.
57. As of April 2025, Bitcoin’s market capitalization stands at approximately $1.8 trillion.
58. Bitcoin’s dominance in the global cryptocurrency market has surged to 64%, its highest since January 2021, driven by increasing institutional investment and a weakening altcoin market.
59. In January 2024, Bitcoin’s on-chain monthly transaction volume reached $1.21 trillion, scoring a new high since September 2022.
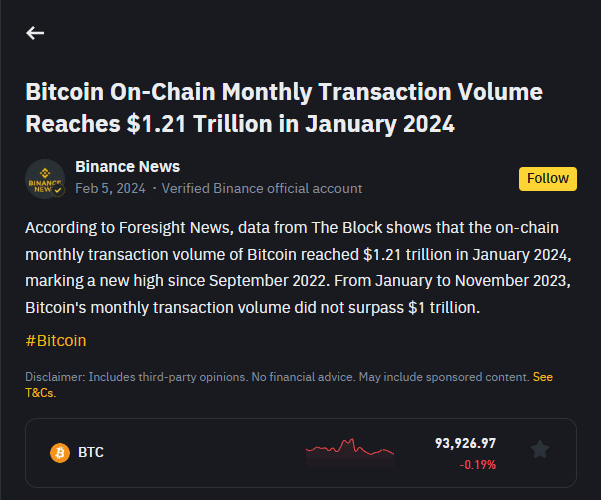
Bitcoin on-chain monthly transaction volume reaches $1.21 trillion
60. Throughout 2024, Bitcoin processed approximately $3.2 trillion in on-chain transactions, with an average daily transaction volume of $8.7 billion.
61. In 2024, Bitcoin’s network hashrate increased by 56.7%, starting the year at 515 EH/s and achieving an all-time high of 808 EH/s by year-end.
62. Each Bitcoin transaction consumes about 707.6 kilowatt-hours (kWh) of electricity, making it the least energy-efficient cryptocurrency compared to others like Ethereum and XRP.
63. On April 22, 2025, Bitcoin surpassed $90,000 for the first time since early March, contributing to the overall crypto market capitalization exceeding $2.8 trillion.
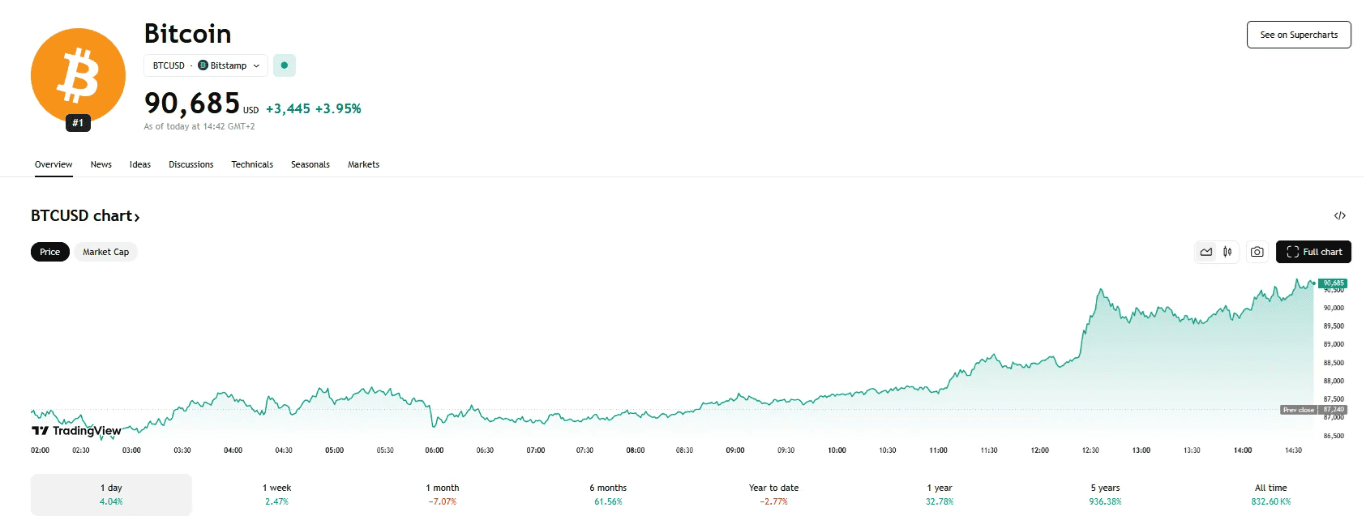
Bitcoin surpassed 90,000 all-time high
Ethereum-Specific Statistics
Ethereum has quickly grown beyond just a cryptocurrency, evolving into the backbone of decentralized finance (DeFi), smart contracts, and digital assets like NFTs.
These stats show how Ethereum’s blockchain is powering much of the innovation taking place within the broader cryptocurrency and blockchain space.
64. As of April 24, 2025, Ethereum’s market capitalization is approximately $216.66 billion, reflecting a 43.6% decrease from $384.14 billion one year ago.
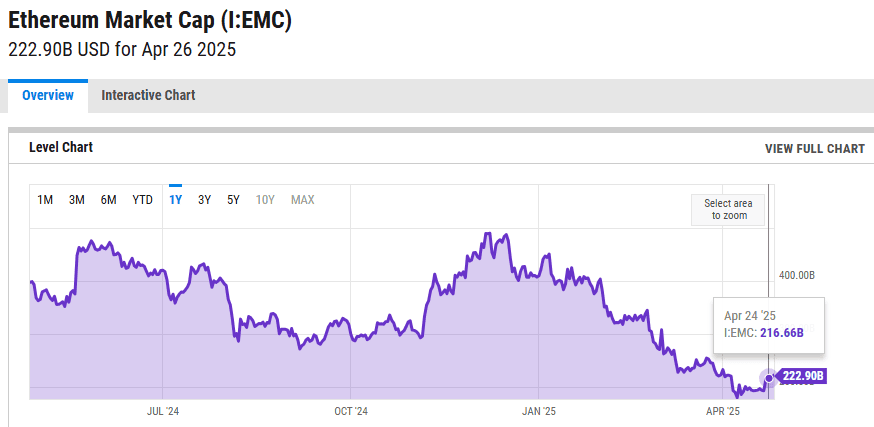
Ethereum market cap 2025
65. Ethereum (ETH) is trading at $1,807.15 USD, with an intraday high of $1,849.82 and a low of $1,785.73.
66. Ethereum processes approximately 1.293 million daily transactions, marking a 9.73% increase from one year ago.
67. In Q4 2024, transactions on the top 10 Ethereum Layer 2 solutions increased by 48.3%, with the Base network accounting for the same percentage of these transactions.
68. Following its change to a proof-of-stake consensus mechanism, Ethereum’s annual energy consumption is approximately 0.0026 terawatt-hours (TWh), making it one of the most energy-efficient blockchains.
69. As of early 2025, Ethereum maintains a 64.9% dominance in the decentralized finance (DeFi) sector, underscoring its leading role in the ecosystem.
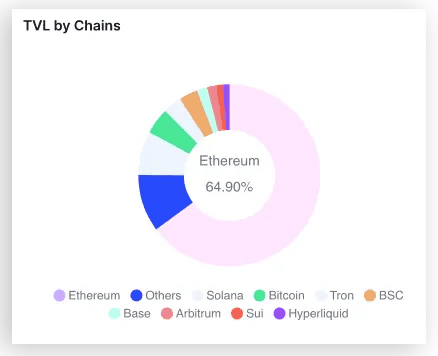
Ethereum dominates the decentralized finance (DeFi) sector
70. The Ethereum-based liquid restaking platform Etherfi saw its TVL surge by 6,159% in 2024, growing from 45,770 ETH to 2.57 million ETH.
71. In March 2024, Ethereum implemented the Dencun upgrade, integrating proto-danksharding to significantly boost transaction throughput, moving toward a goal of 100,000 transactions per second.
Blockchain Fraud, Risks, and Concerns
Despite its promise, blockchain is not without its risks, and as more people and businesses dive into this technology, issues like fraud, hacking, and technical vulnerabilities have become pressing concerns.
Here are the top blockchain fraud stats to show you how investing involves risk:
72. In 2024, cryptocurrency-related fraud resulted in losses of $9.3 billion, marking a 66% increase from the previous year.
73. In 2024, illicit crypto transfers exceeded $40 billion, with a significant portion attributed to sanctions evasion activities, including a 70% increase in Iranian crypto outflows to $4.2 billion.
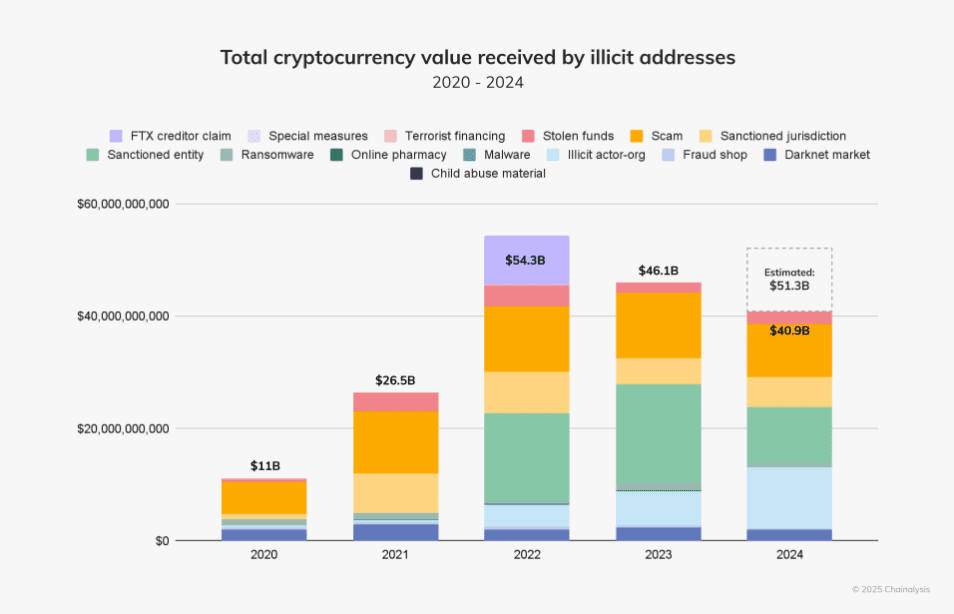
Total cryptocurrency value received by illicit addresses
74. Pig butchering investment scams grew by 40% in 2024, contributing significantly to the estimated $9.9 billion in crypto scam revenue.
75. Blockchain security breaches led to losses exceeding $2.3 billion in 2024, stemming from 760 reported incidents.
76. Decentralized Finance (DeFi) platforms were particularly affected, with 339 security incidents accounting for 82.68% of all blockchain breaches and resulting in losses of $1.029 billion.
77. Individuals aged 60+ reported losses totaling $4.8 billion from over 147,000 complaints related to cyber and scam-related crimes, highlighting the vulnerability of this demographic.
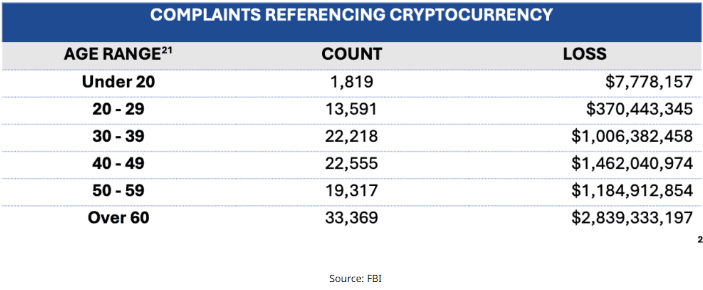
Complaints regarding cryptocurrency
78. The FBI received over 149,000 complaints about crypto fraud, encompassing investment scams, extortion, and ATM-related fraud.
79. The integration of generative AI into fraudulent schemes has increased the effectiveness and frequency of scams, making them more convincing and harder to detect.
Future of Blockchain
Finally, understanding these blockchain projections helps paint a picture of a future where blockchain isn’t just a trend but a fundamental part of our digital lives.
80. The number of banks allocating tokenized assets is forecasted to double in 2025, creating new opportunities for capital formation and asset management.
81. Enterprise blockchain adoption is revving, driven by the tokenization of real-world assets anticipated to reach $600 billion by 2030.
82. Citigroup forecasts a potential fivefold increase in the stablecoin market over the next five years, possibly reaching nearly $4 trillion, driven by a shift from holding traditional currencies to stablecoins for hedging and payments.
83. According to the World Economic Forum, up to 10% of global GDP could be stored on blockchains by 2025.
84. Gartner projects that the business value contributed by blockchain is expected to surge to more than $360 billion by 2026 and overtake $3.1 trillion by 2030.
Conclusion
Blockchain technology has become a powerful force that’s changing how industries operate.
With its decentralized design and ability to provide secure transactions, it’s being recognized as a key innovation for sectors like finance, healthcare, and supply chain management.
The way blockchain uses cryptographic methods to ensure data integrity makes it a reliable system that people can trust. This has the potential to remove unnecessary middlemen, cut down on costs, and improve the overall efficiency of processes.